. 2021 Jan 19;11(7):3472-3488.
doi: 10.7150/thno.53935. eCollection 2021.

Overall survival of pancreatic ductal adenocarcinoma is doubled by Aldh7a1 deletion in the KPC mouse

Affiliations

Overall survival of pancreatic ductal adenocarcinoma is doubled by Aldh7a1 deletion in the KPC mouse

Jae-Seon Lee et al. Theranostics. .

Abstract

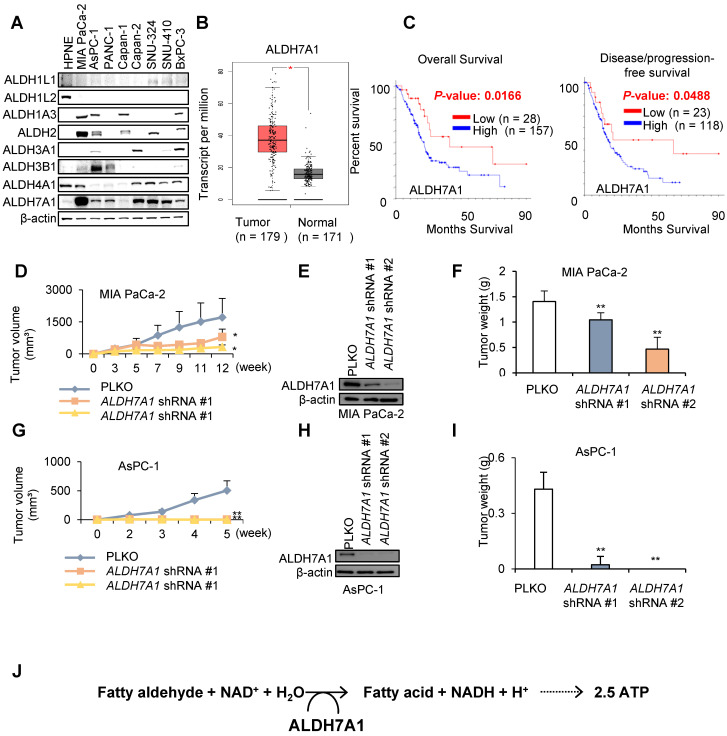
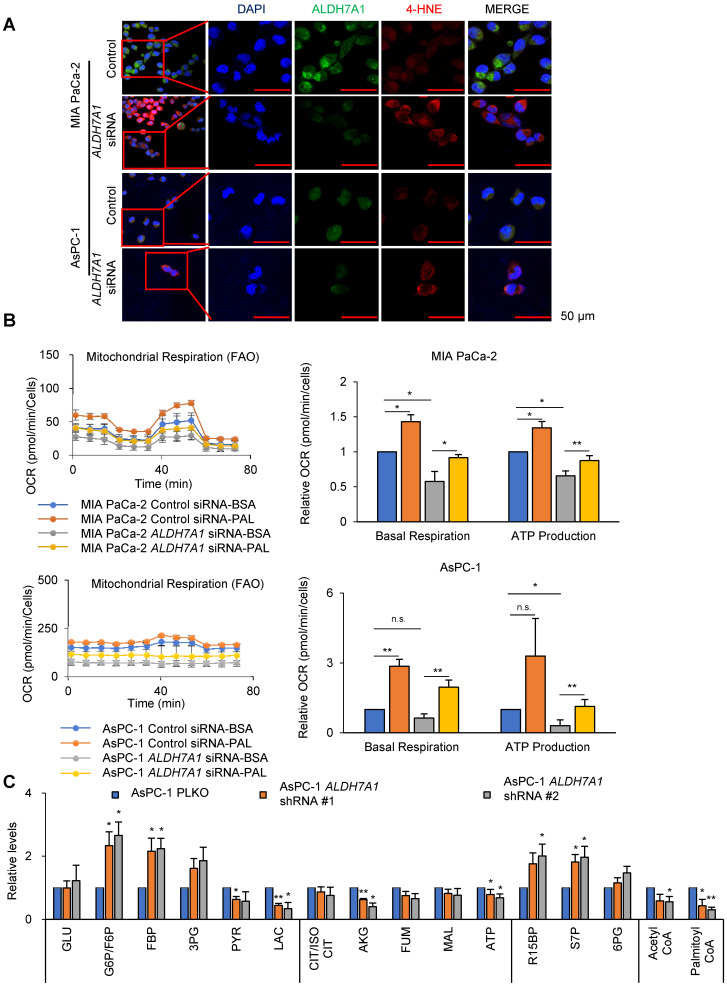
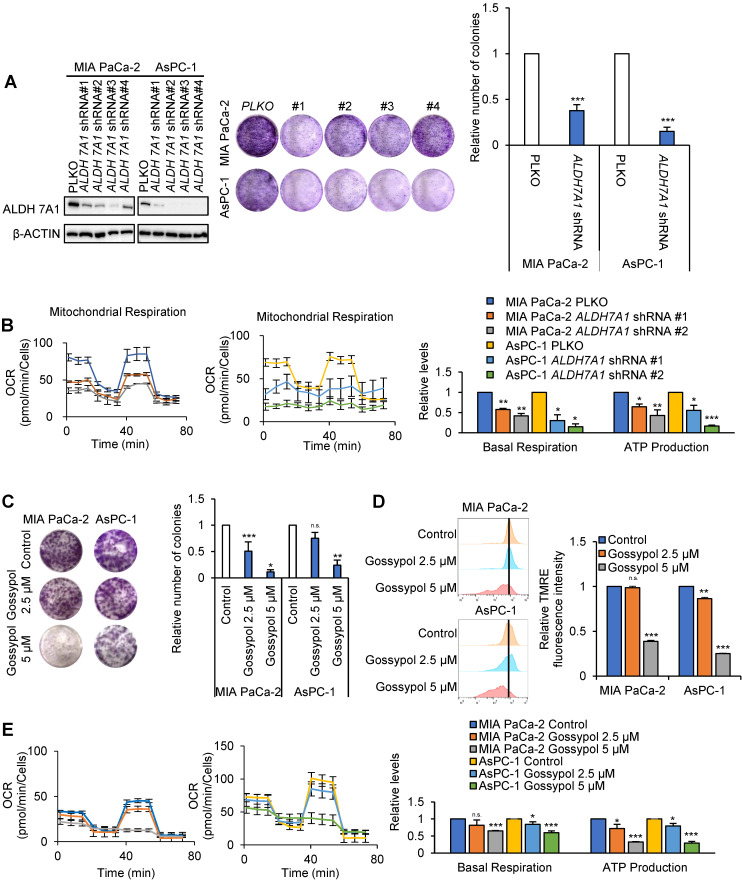
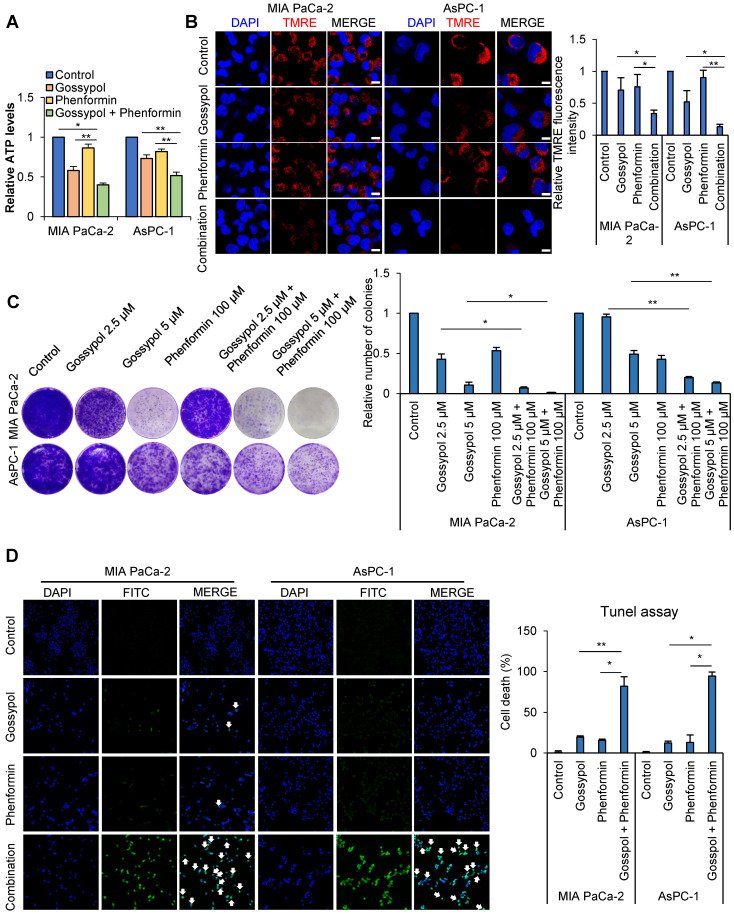
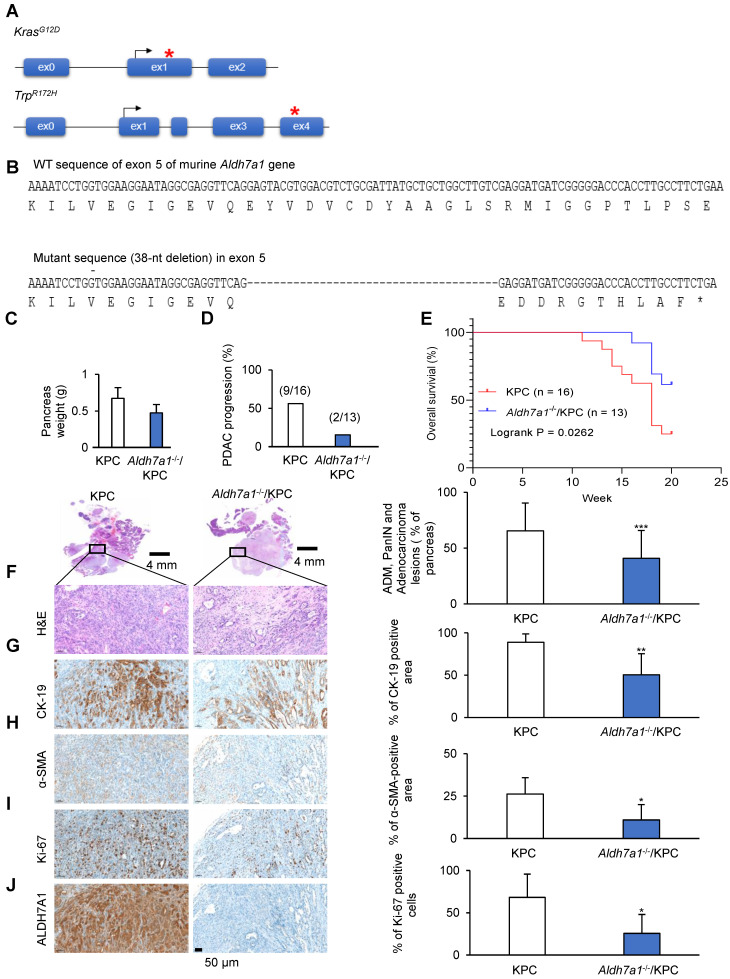
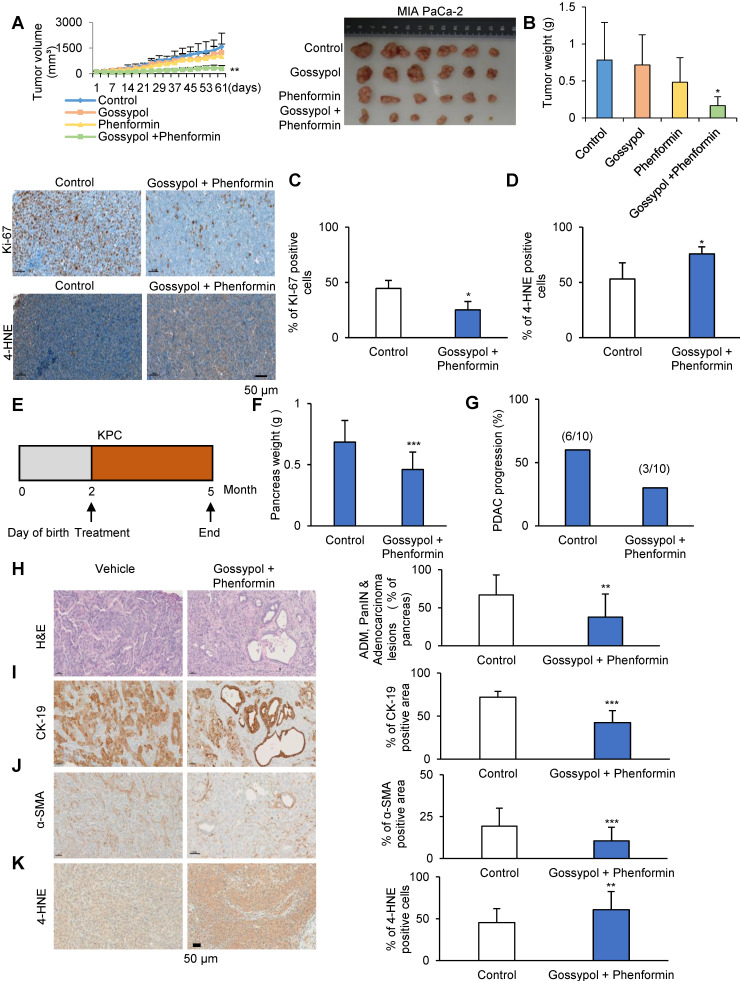
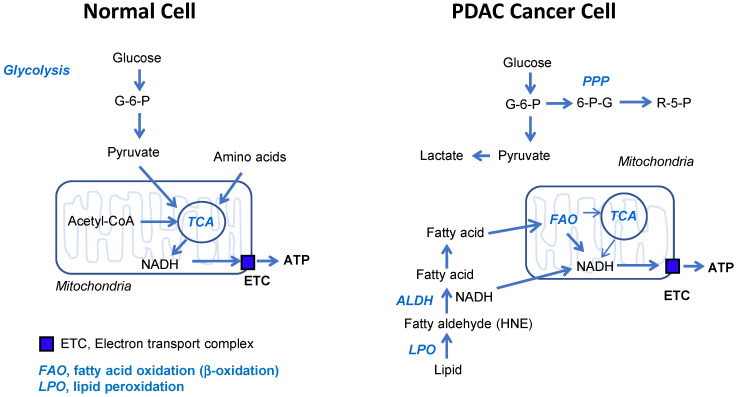
Rationale: The activity of aldehyde dehydrogenase 7A1 (ALDH7A1), an enzyme that catalyzes the lipid peroxidation of fatty aldehydes was found to be upregulated in pancreatic ductal adenocarcinoma (PDAC). ALDH7A1 knockdown significantly reduced tumor formation in PDAC. We raised a question how ALDH7A1 contributes to cancer progression. Methods: To answer the question, the role of ALDH7A1 in energy metabolism was investigated by knocking down and knockdown gene in mouse model, because the role of ALDH7A1 has been reported as a catabolic enzyme catalyzing fatty aldehyde from lipid peroxidation to fatty acid. Oxygen consumption rate (OCR), ATP production, mitochondrial membrane potential, proliferation assay and immunoblotting were performed. In in vivo study, two human PDAC cell lines were used for pre-clinical xenograft model as well as spontaneous PDAC model of KPC mice was also employed for anti-cancer therapeutic effect. Results:ALDH7A1 knockdown significantly reduced tumor formation with reduction of OCR and ATP production, which was inversely correlated with increase of 4-hydroxynonenal. This implies that ALDH7A1 is critical to process fatty aldehydes from lipid peroxidation. Overall survival of PDAC is doubled by cross breeding of KPC (KrasG12D; Trp53R172H; Pdx1-Cre) and Aldh7a1-/- mice. Conclusion: Inhibitions of ALDH7A1 and oxidative phosphorylation using gossypol and phenformin resulted in a regression of tumor formation in xenograft mice model and KPC mice model.

Keywords: ALDH7A1; KPC mice model; cancer metabolism; oxidative phosphorylation complex I; pancreatic ductal adenocarcinoma.


Conflict of interest statement

Competing Interests: The authors have declared that no competing interest exists.

Figures

Figure 1
Figure 1
ALDH7A1 is highly increased in PDAC. (A) Western blot showed increased expression of ALDH7A1 in Pancreatic cancer cell lines compared to other ALDH isotypes. (B) ALDH7A1 expression level in PAAD patients was compared with matched normal by GEPIA webserver (http://gepia.cancer-pku.cn/). (C) PAAD patients with high ALDH7A1 expression showed poor prognosis than the others. Pancreatic adenocarcinoma (TCGA, Provisional) datasets were analyzed by cBioPortal (www.cbioportal.org). ALDH7A1 expression level less than standard deviation from the mean value was considered as low. (D) Knockdown of ALDH7A1 suppressed tumor growth in MIA PaCa-2 cells xenograft mouse model. Graph shows a decrease in tumor growth as measured using calipers. (E) Western blot analysis of MIA PaCa-2 cancer cell lines demonstrating their ALDH7A1 status. Actin used as a loading control. (F) Final weight of subcutaneous tumors derived from MIA PaCa-2. (G) Knockdown of ALDH7A1 suppressed tumor growth in AsPC-1 cells xenograft mouse model. Graph shows a decrease in tumor growth as measured using calipers. (H) Western blot analysis of AsPC-1 cancer cell lines demonstrating their ALDH7A1 status. Actin used as a loading control. (I) Final weight of subcutaneous tumors derived from AsPC-1. (J) Role of the ALDH7A1 in PDAC. *p < 0.05, **p < 0.01, ***p < 0.001.
Figure 2
Figure 2
ALDH7A1 knockdown induces 4-HNE accumulation and decrease in β-oxidation level. (A) ALDH7A1 knockdown increased 4-hydroxynonenal level in Pancreatic cancer cells as determined by Immunocytochemistry analysis. Scale bar = 50 µm. (B) Seahorse XF analysis of cells treated sequentially with oligomycin, the chemical uncoupler FCCP and antimycin A in the presence of bovine serum albumin alone (BSA) or palmitate-BSA. ALDH7A1 knockdown cells showed decreased fatty acid oxidation compared to control cells. (C) Effect of ALDH7A1 siRNA treatment (40 nM for 48 h) on metabolites derived from various metabolic pathways in AsPC-1. Data are expressed as the mean and standard deviation of three independent experiments. *p < 0.05, **p < 0.01, ***p < 0.001.
Figure 3
Figure 3
ALDH7A1 knockdown suppressed proliferation of pancreatic cancer by reduced ATP production. (A) The proliferation was analyzed by crystal violet cell colony assay in ALDH7A1 knockdown pancreatic cancer cell lines in comparison with pLKO.1 pancreatic cancer cell line. (B) The oxygen consumption rate (OCR) was analyzed using the Seahorse XFe96 analyzer in pancreatic cancer cell lines compared to ALDH7A1 knockdown pancreatic cancer cell lines and normalized by SRB assay. (C) Treatment of gossypol for 72 h showed inhibition of cell growth in pancreatic cancer cell, as determined by the clonogenic assay. (D) treatment of gossypol for 24 h reduced mitochondrial membrane potential, as determined by TMRE staining and FACS analyzer. (E) treatment of gossypol for 24 h reduced oxygen consumption rates (OCR) and respiration parameters as determined by Seahorse XFe96 analyzer. Data are expressed as the mean and standard deviation of three independent experiments. *p < 0.05, **p < 0.01, ***p < 0.001.
Figure 4
Figure 4
Pancreas normal duct cell was not affected with combination treatment of gossypol and phenformin. (A) Combined treatment for 24 h reduced ATP production synergistically, as determined by ATP colorimetric assay kit. (B) Combined treatment for 24 h reduced mitochondrial membrane potential synergistically, as determined by TMRE staining and confocal microscopy. Scale bar = 50 µm. (C) Combined treatment of 5 µM gossypol with 100 µM phenformin for 72 h showed synergistic inhibition of cell growth in pancreatic cancer, as determined by the clonogenic assay. (D) Synergistic effect of combined treatment of 5 µM gossypol and 100 µM phenformin after 48h on cell death was determined by TUNEL assay. Scale bar = 200 µm. Data are expressed as the mean and standard deviation of three independent experiments. *p < 0.05, **p < 0.01, ***p < 0.001.
Figure 5
Figure 5
ALDH7A1 deficiency causes a significant reduction in pancreatic cancer progression of mouse. (A) In KPC mouse, the conditional expression of mutant KrasG12D and Trp53R172H is controlled by a Pdx1-Cre. (B) DNA sequence and peptide sequence of murine Aldh7a1 knockout mouse having 38-nt deletion in exon 5, was used in breeding with KPC mouse. This frameshift mutation causes premature translation termination. (C) Quantification of pancreas weight in Aldh7a1 knockout; KPC mouse and KPC mouse. (D) Frequency of pancreatic duct adenocarcinoma in Aldh7a1 knockout; KPC mouse and KPC mouse. (E) Kaplan-Meier survival curves of KPC mouse and Aldh7a1 knockout; KPC mouse. (F-J) H&E (F), CK-19 (G), α-SMA (H), Ki-67 (I) and ALDH7A1 (J) staining of the pancreas Aldh7a1 knockout; KPC mouse and KPC mouse. And quantification of the percentage of lesions, CK-19, α-SMA and Ki-67 positive area. Scale bar = 50 µm. *p < 0.05, **p < 0.01, ***p < 0.001.
Figure 6
Figure 6
Gossypol treatment combined with phenformin synergistically suppresses tumor growth in a human pancreatic cancer xenograft mouse model and KPC mouse model. (A) MIA PaCa-2 (1 × 10⁷) cells were injected in 6-8-week-old BALB/c nude mice. When the volume of the tumor mass reached 110 mm3, the mice were randomly assigned to one of four treatment groups including vehicle control, gossypol, phenformin, and combination of gossypol and phenformin (n=6 per group). Gossypol (40 mg/kg body weight), phenformin (100 mg/kg body weight), and vehicle were administered orally 6 days/week. Graph (left) and photograph (right) shows a synergistic decrease in tumor growth after combined treatment of gossypol and phenformin as measured using calipers. (B) Final weight of subcutaneous tumors derived from MIA PaCa-2. (C) IHC analysis of Ki-67 staining in MIA PaCa-2 tumor xenograft tissues. Scale bar = 50 µm. (D) IHC analysis of 4-HNE staining in MIA PaCa-2 tumor xenograft tissues. Scale bar = 50 µm. (E) Scheme showing the experimental design of drug treatment protocols in KPC mouse (F) Quantification of pancreas weight in mice treated with vehicle or gossypol combined with phenformin. (G) Frequency of pancreatic duct adenocarcinoma in KPC mouse treated with vehicle or gossypol combined with phenformin. (H-K) H&E (H), CK-19 (I), α-SMA (J) and 4-HNE (K) staining of the pancreas in vehicle or gossypol combined with phenformin-treated mouse and quantification of the percentage of CK-19, α-SMA and 4-HNE positive area in mouse treated with vehicle or gossypol combined with phenformin. Scale bar = 50 µm. *p < 0.05, **p < 0.01, ***p < 0.001.
Figure 7
Figure 7
Schematic diagram of normal and cancer energy metabolism. This is based on the relative contribution to ATP production. The most important things are; 1) glucose is not ATP source in cancer, 2) fatty acid oxidation is the most dependent ATP source in cancer, 3) OxPhos is active in cancer. Therefore, targeting ALDH7A1 and mitochondrial complex I selectively blocks cancer energy metabolism.

Similar articles

Cited by

References

    1. Le Large TY, Mato Prado M, Krell J, Bijlsma MF, Meijer LL, Kazemier G. et al. Bioinformatic analysis reveals pancreatic cancer molecular subtypes specific to the tumor and the microenvironment. Expert Rev Mol Diagn. 2016;16:733–6. - PubMed
    1. Kunovsky L, Tesarikova P, Kala Z, Kroupa R, Kysela P, Dolina J. et al. The Use of Biomarkers in Early Diagnostics of Pancreatic Cancer. Can J Gastroenterol Hepatol. 2018;2018:5389820. - PMC - PubMed
    1. Maurel J, Sanchez-Cabus S, Laquente B, Gaba L, Visa L, Fabregat J. et al. Outcomes after neoadjuvant treatment with gemcitabine and erlotinib followed by gemcitabine-erlotinib and radiotherapy for resectable pancreatic cancer (GEMCAD 10-03 trial) Cancer Chemother Pharmacol. 2018;82:935–43. - PubMed
    1. Chen L, Zhou D, Liu Z, Huang X, Liu Q, Kang Y. et al. Combination of gemcitabine and erlotinib inhibits recurrent pancreatic cancer growth in mice via the JAK-STAT pathway. Oncol Rep. 2018;39:1081–9. - PMC - PubMed
    1. Saif MW. Advancements in the management of pancreatic cancer: 2013. JOP. 2013;14:112–8. - PubMed

Publication types

MeSH terms