. 2021 Jan 18:10:617190.
doi: 10.3389/fonc.2020.617190. eCollection 2020.

4-Hydroxyphenylpyruvate Dioxygenase-Like Protein Promotes Pancreatic Cancer Cell Progression and Is Associated With Glutamine-Mediated Redox Balance

Affiliations

4-Hydroxyphenylpyruvate Dioxygenase-Like Protein Promotes Pancreatic Cancer Cell Progression and Is Associated With Glutamine-Mediated Redox Balance

Xianglai Ye et al. Front Oncol. .

Abstract

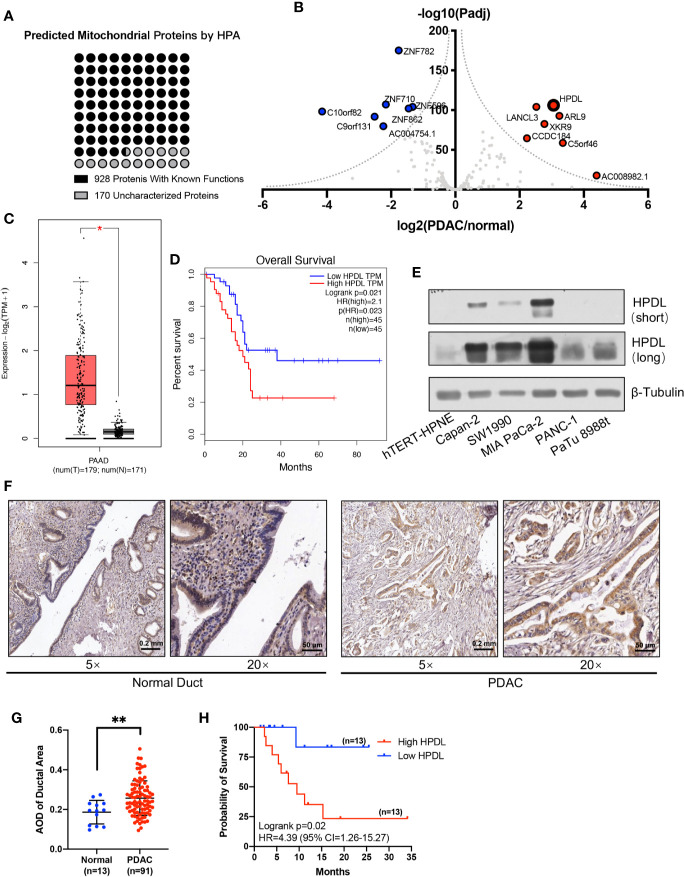
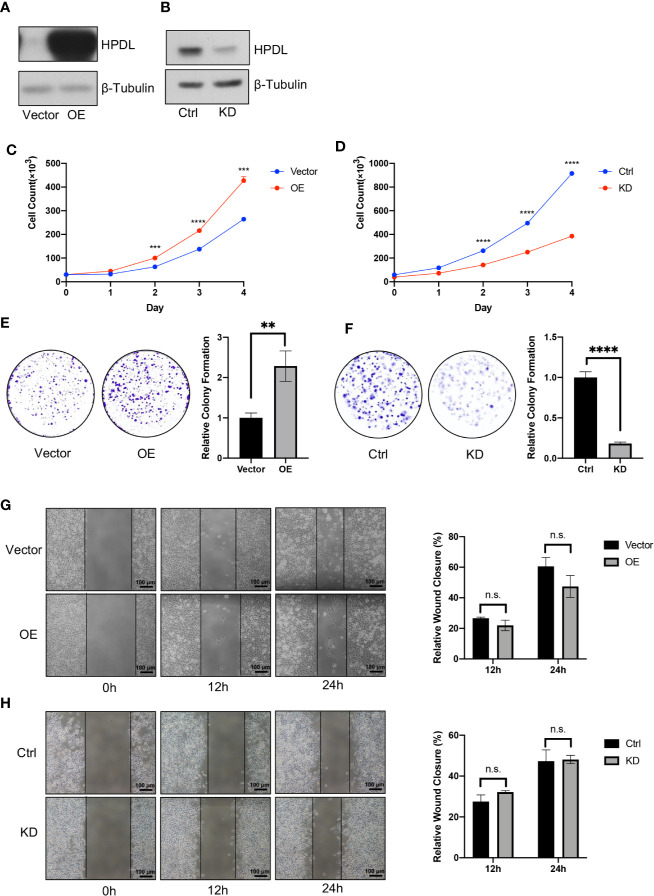
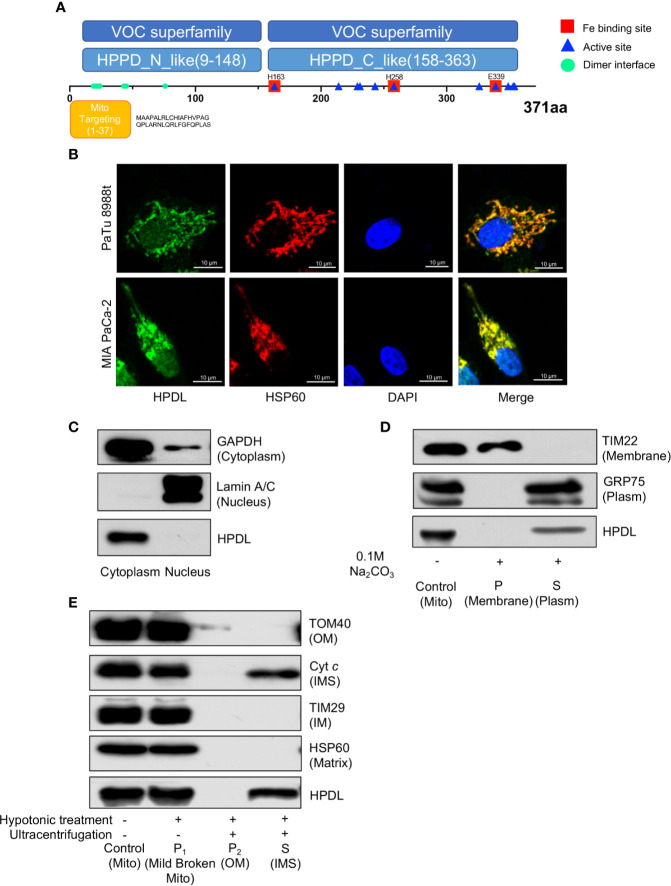
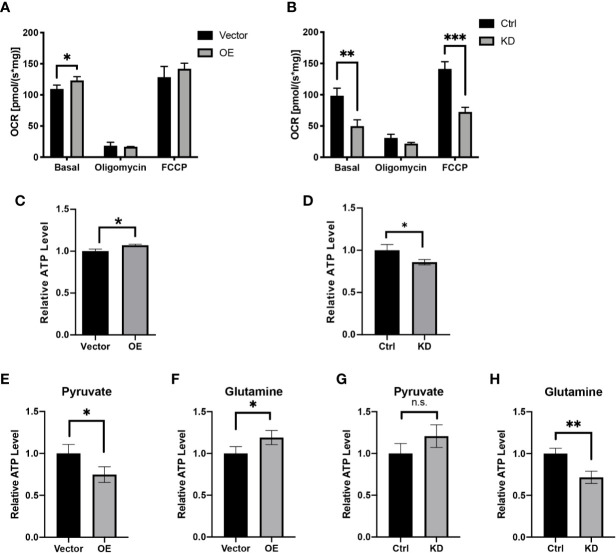
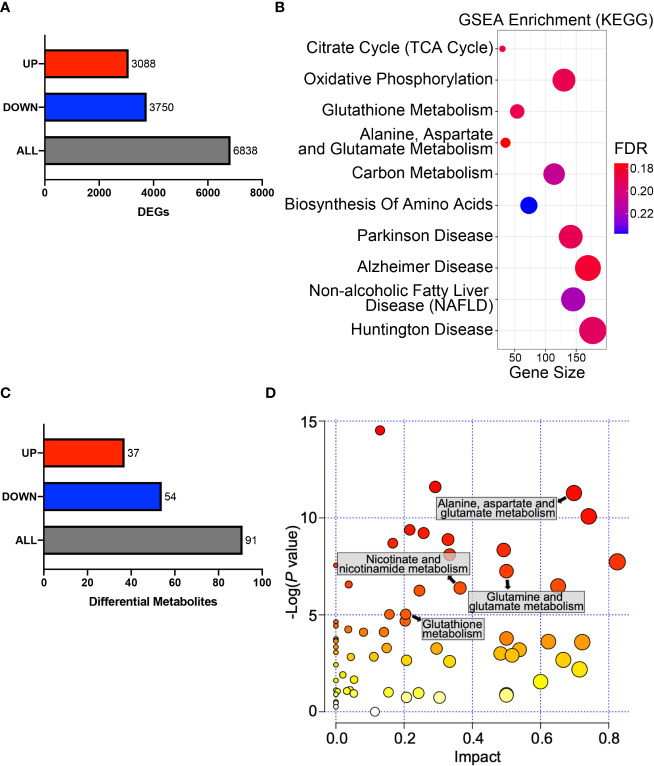
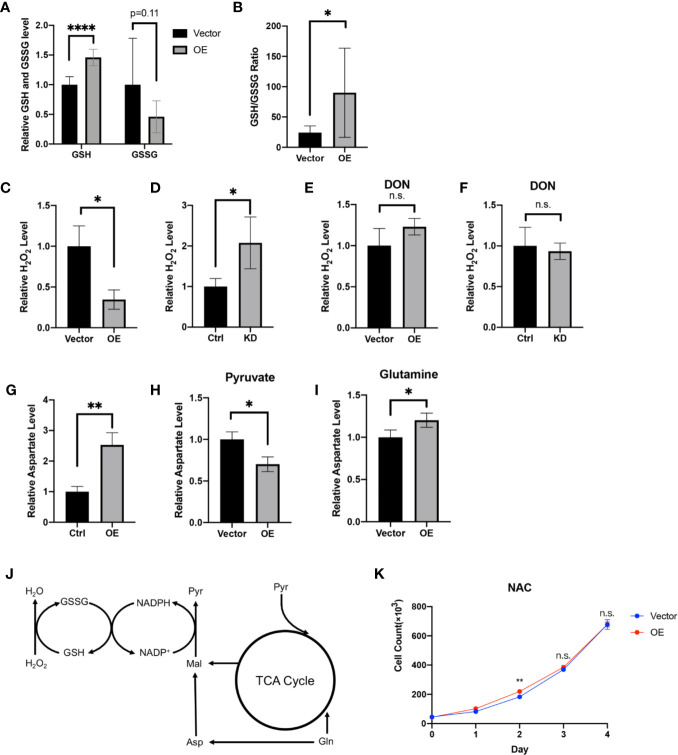
Tumor cells develop a series of metabolic reprogramming mechanisms to meet the metabolic needs for tumor progression. As metabolic hubs in cells, mitochondria play a significant role in this process, including energy production, biosynthesis, and redox hemostasis. In this study, we show that 4-hydroxyphenylpyruvate dioxygenase-like protein (HPDL), a previously uncharacterized protein, is positively associated with the development of pancreatic ductal adenocarcinoma (PDAC) and disease prognosis. We found that overexpression of HPDL in PDAC cells promotes tumorigenesis in vitro, whereas knockdown of HPDL inhibits cell proliferation and colony formation. Mechanistically, we found that HPDL is a mitochondrial intermembrane space localized protein that positively regulates mitochondrial bioenergetic processes and adenosine triphosphate (ATP) generation in a glutamine dependent manner. Our results further reveal that HPDL protects cells from oxidative stress by reprogramming the metabolic profile of PDAC cells toward glutamine metabolism. In short, we conclude that HPDL promotes PDAC likely through its effects on glutamine metabolism and redox balance.

Keywords: glutamine; metabolic reprogramming; mitochondria; pancreatic ductal adenocarcinoma; redox balance.


Conflict of interest statement

The authors declare that the research was conducted in the absence of any commercial or financial relationships that could be construed as a potential conflict of interest.

Figures

Figure 1
Figure 1
HPDL is upregulated in pancreatic ductal adenocarcinoma and associated with poor prognosis. (A) Mitochondrial proteins that experimentally detected in the mitochondria by the Human Protein Atlas (http://www.proteinatlas.org). The functional definitions of these mitochondrial proteins were based on the annotation of Uniprot (https://www.uniprot.org). (B) Gene expression profile of function-unknown mitochondrial proteins based on the data generated by the TCGA (https://www.cancer.gov/tcga) and GTEx (https://commonfund.nih.gov/GTEx) datasets. The genes were plotted with expression of PDAC/normal duct and adjusted p-value. The red points refer to genes up-regulated in PDAC and the blue points refer to genes down-regulated in PDAC. (C, D) Expression plot and survival plot of HPDL in pancreatic adenocarcinoma (PAAD) made by GEPIA server (http://gepia.cancer-pku.cn). For expression plot (C), threshold was set as follows: log2FoldChange <1, p-value <0.01. For survival plot (D), high and low expression groups were split by quartile, and the hazards ratio (HR) was calculated based on Cox PH model. (E) Western blot analysis of HPDL in different human pancreatic adenocarcinoma cell lines and human immortalized pancreatic duct cell line hTERT-HPNE. β-Tubulin was used as loading control. (F) Immunohistochemical (IHC) analysis of tissue microarray (TMA). TMA was incubated with anti-HPDL and stained with DAB and hematoxylin. HPDL expression in normal and malignant pancreatic ducts was shown in different zoom levels. (G, H) Quantitative analysis of HPDL expression in TMA. Quantification of HPDL expression was represented as average optical density (AOD). Comparisons between normal and malignant pancreatic ducts (G) was performed. Survival curve (H) was performed between low HPDL group and high HPDL group which were split by median. (*P < 0.05. **P < 0.01.)
Figure 2
Figure 2
HPDL promotes pancreatic ductal adenocarcinoma in vitro. (A, B) Validation of HPDL overexpression (A) and knockdown (B) cells with theirs paired control cells. HPDL overexpression (OE) model and its empty vector control (Vector) were generated in PaTu 8988t, HPDL knockdown (KD) model and its scramble control (Ctrl) were generated in MIA PaCa-2. Cell lysate was separated with SDS-PAGE and immunoblotted with antibodies as indicated. β-Tubulin was used as loading control. (C, D) Cell proliferation of HPDL OE (C) and KD (D) cells with theirs paired control cells. Cells were seeded in 12-well plate and counted for 4 days. (E, F) Colony formation analysis of HPDL OE (E) and KD (F) cells with theirs paired control cells. Cells were seeded in 6-well plate and stained with crystal violet after 10-day culture. (G, H) Wound healing analysis of HPDL OE (G) and KD (H) cells with theirs paired control cells. Cells were seeded in 6-well plate and scratched with a pipette tip. Wound closure was measured at 0, 12, and 24 h. (**P < 0.01. ***P < 0.001. ****P<0.0001. n.s., no significance.)
Figure 3
Figure 3
HPDL localizes to mitochondrial intermembrane space. (A) Schematic diagram of HPDL protein domain structure. HPPD_N_like and HPPD_C_like, C-terminal or N-terminal domain of 4-hydroxyphenylpyruvate dioxygenase (HppD) and hydroxymandelate synthase (HmaS). (B) Immunofluorescence colocalization analysis of HPDL in PaTu 8988t and MIA PaCa-2. Cells were immunolabeled with HPDL (Alexa flour 488, green) and HSP60 (Alex flour 594, red), and nuclear was stained with DAPI (blue). (C) Subcellular fractionation analysis of HPDL in MIA PaCa-2. Cytosolic and nuclear protein was extracted and immunoblotted with antibodies as indicated. (D) Carbonate extraction analysis of HPDL in MIA PaCa-2. Isolated mitochondria were subjected to 0.1 M Na2CO3. Mitochondrial proteins in membrane and plasm was separated with ultracentrifugation. Proteins were separated with SDS-PAGE and immunoblotted with antibodies as indicated. Mito, isolated crude mitochondria. P, pellet. S, supernatant. (E) Submitochondrial fractionation analysis of HPDL in MIA PaCa-2. Isolated mitochondria were subjected to hypotonic buffer (10 mM HEPES/KOH, pH 7.40) to break the integrity of mitochondrial outer membrane. Mild broken mitochondria were separated with low-speed centrifugation. Proteins in mitochondrial outer membrane and intermembrane space were subsequently separated with ultracentrifugation. Proteins were separated with SDS-PAGE and immunoblotted with antibodies as indicated. Mito, isolated crude mitochondria. P1, pellet in first centrifugation. P2, pellet in second centrifugation. OM, outer membrane. S, supernatant in second centrifugation. IMS, intermembrane space.
Figure 4
Figure 4
HPDL promotes mitochondrial respiration and ATP generation. (A, B) Oxygen consumption rate of HPDL OE (A) and KD (B) cells with theirs paired control cells. Basal, basal respiration with endogenous substrates solely. Oligomycin, respiration in the presence of ATP synthase inhibitor oligomycin (2.5 μM). FCCP, respiration in the presence of uncoupler FCCP (5 μM). (C, D) Relative ATP level of HPDL OE (C) and KD (D) cells with theirs paired control cells. (E–H) Relative ATP level of HPDL OE (E, F) and KD (G, H) cells with theirs paired control cells in different culture conditions. Cells were cultured in medium supplemented with 5 mM pyruvate only (E, G) or 4 mM glutamine only (F, H) for 12 h and subsequently the cellular ATP was measured. (*P < 0.05. **P < 0.01. ***P < 0.001. n.s., no significance.)
Figure 5
Figure 5
HPDL reprograms metabolic profiles in PDAC cells. (A) DEGs in the gene expression profiling results of HPDL OE and control cells. Threshold was set as follows: p-adj<0.05, |log2(OE/Vector) |>0. (B) GSEA in the gene expression profiling results of HPDL OE and control cells. Gene size refers to the count of genes enriched in certain pathways. FDR, false discovery rate. The GSEA was performed based on KEGG database (https://www.genome.jp/kegg/). (C) Differentially metabolites in metabolomic profiling results of HPDL OE and control cells. Threshold was set as follows: p<0.05, OE/Vector>1.2 or < 0.83. (D) MSEA in metabolomic profiling results of HPDL OE and control cells. Different metabolic pathways were plotted with p-value and impact. The MSEA was performed based on KEGG database (https://www.genome.jp/kegg/).
Figure 6
Figure 6
HPDL regulates redox balance via a glutamine-dependent antioxidative pathway. (A, B) Relative GSH, GSSG level (A) and GSH/GSSG ratio (B) in metabolome results of HPDL OE and control cells. (C, D) Relative H2O2 level of HPDL OE (C) and KD (D) cells with theirs paired control cells. (E, F) Relative H2O2 level of HPDL OE (E) and KD (F) cells with theirs paired control cells in the presence of glutamine antagonist DON (5 mM). (G) Relative aspartate level of HPDL OE and control cells. (H, I) Relative aspartate level of HPDL OE and control cells in different culture conditions. Cells were cultured in medium supplemented with 5 mM pyruvate (H) or 4 mM glutamine (I) as the only carbon source for 12 h and subsequently the cellular aspartate was measured. (J) Schematic metabolic pathway of cellular antioxidative process. This diagram was prepared based on a previous work of Son (18). Pyr, pyruvate. Gln, Glutamine. Asp, aspartate. Mal, malate. (K) Cell proliferation of HPDL OE and control cells with NAC treatment. Cells were cultured in medium supplemented with 5 mM NAC. (*P < 0.05. **P < 0.01. ****P < 0.0001. n.s., no significance.)

References

    1. Siegel RL, Miller KD, Jemal A. Cancer statistics, 2020. CA Cancer J Clin (2020) 70(1):7–30. 10.3322/caac.21590 - DOI - PubMed
    1. Adamska A, Domenichini A, Falasca M. Pancreatic Ductal Adenocarcinoma: Current and Evolving Therapies. Int J Mol Sci (2017) 18(7):1–43. 10.3390/ijms18071338 - DOI - PMC - PubMed
    1. Khorana AA, Mangu PB, Berlin J, Engebretson A, Hong TS, Maitra A, et al. Potentially Curable Pancreatic Cancer: American Society of Clinical Oncology Clinical Practice Guideline. J Clin Oncol (2016) 34(21):2541–56. 10.1200/JCO.2016.67.5553 - DOI - PubMed
    1. Pavlova NN, Thompson CB. The Emerging Hallmarks of Cancer Metabolism. Cell Metab (2016) 23(1):27–47. 10.1016/j.cmet.2015.12.006 - DOI - PMC - PubMed
    1. Dougan SK. The Pancreatic Cancer Microenvironment. Cancer J (2017) 23(6):321–5. 10.1097/PPO.0000000000000288 - DOI - PubMed