. 2021 Jan 18:7:624776.
doi: 10.3389/fcvm.2020.624776. eCollection 2020.

Severe T-System Remodeling in Pediatric Viral Myocarditis

Affiliations

Severe T-System Remodeling in Pediatric Viral Myocarditis

Dominik J Fiegle et al. Front Cardiovasc Med. .

Abstract

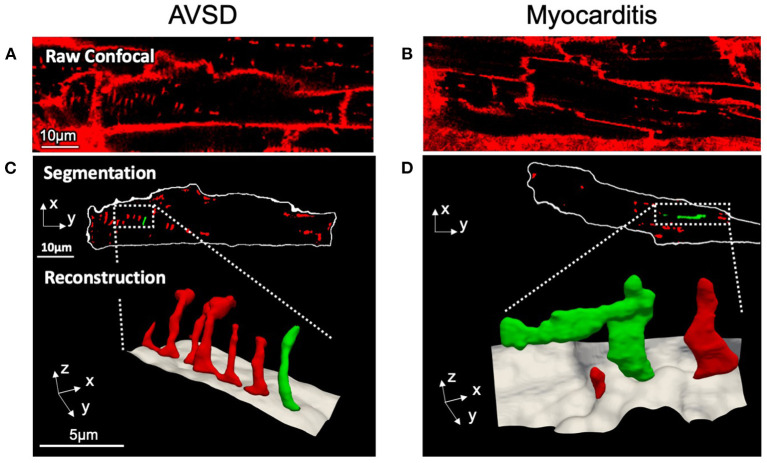
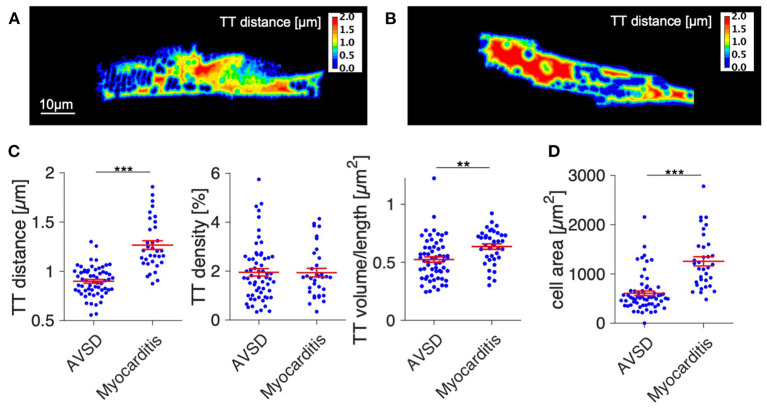
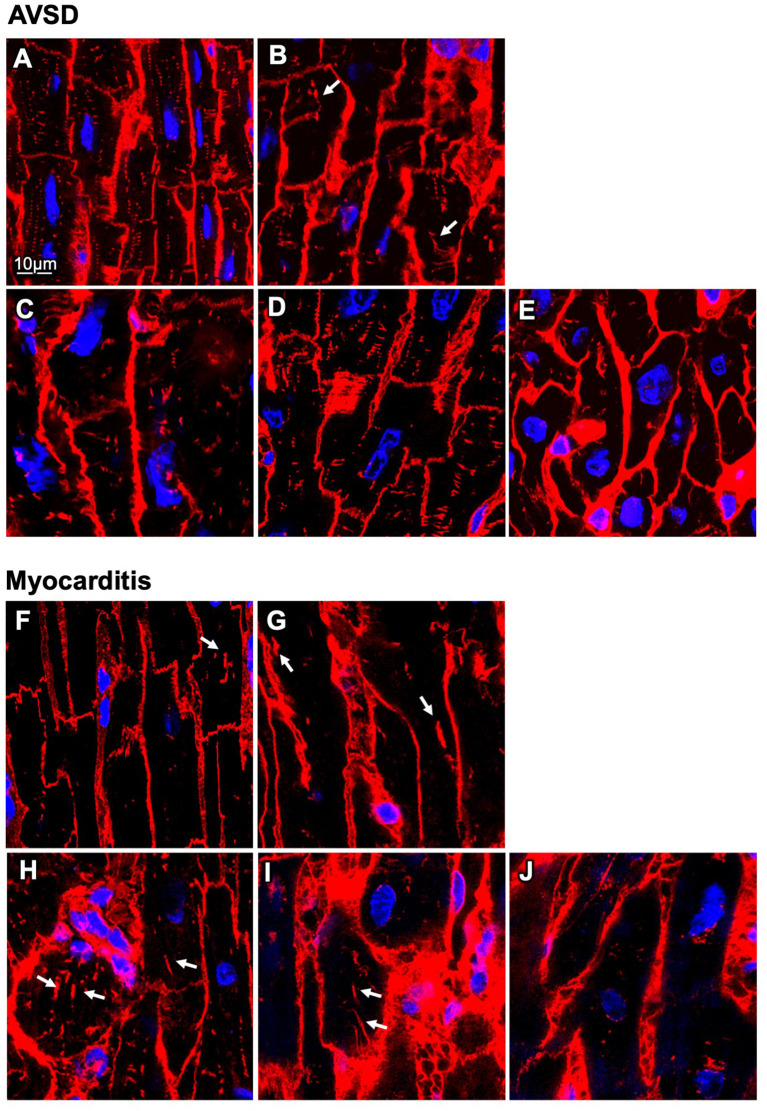
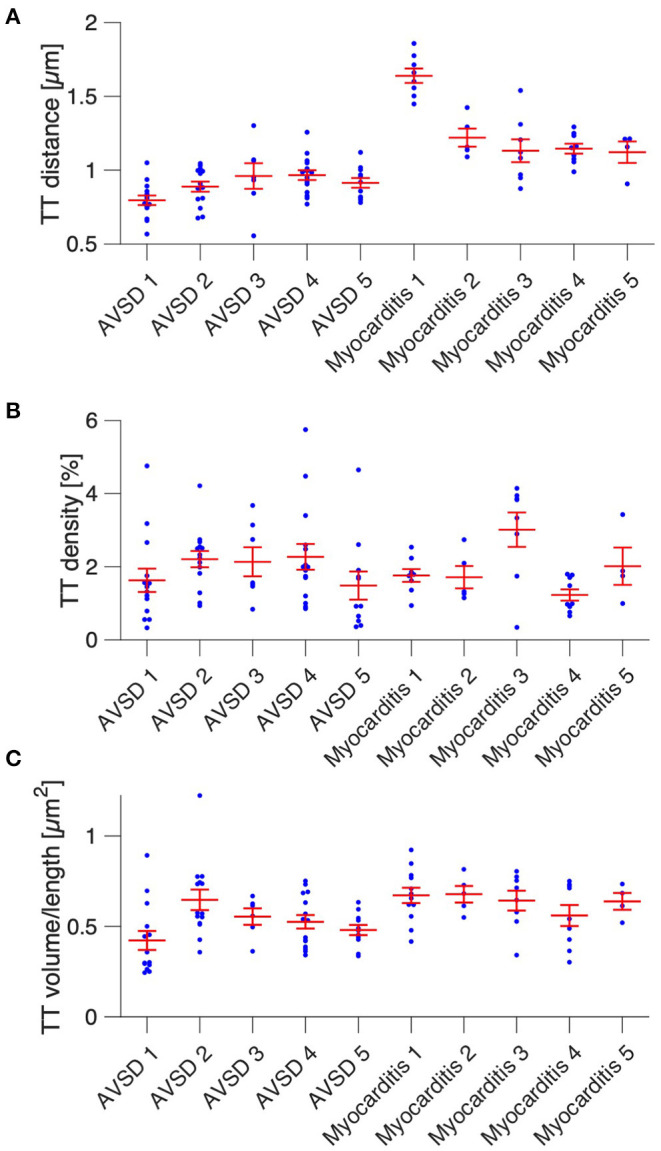
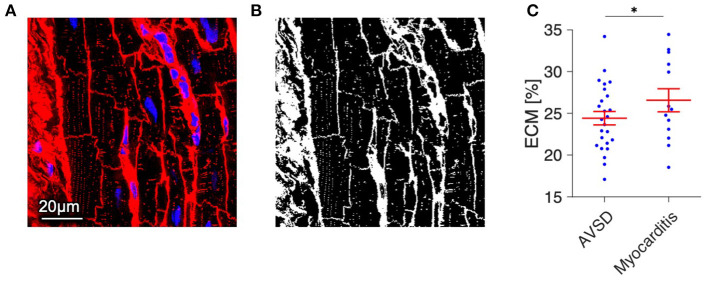
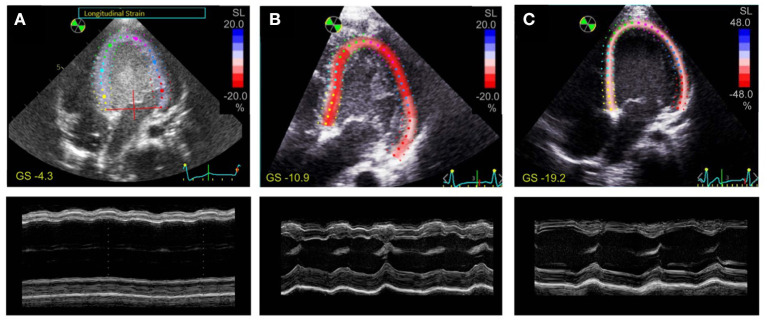
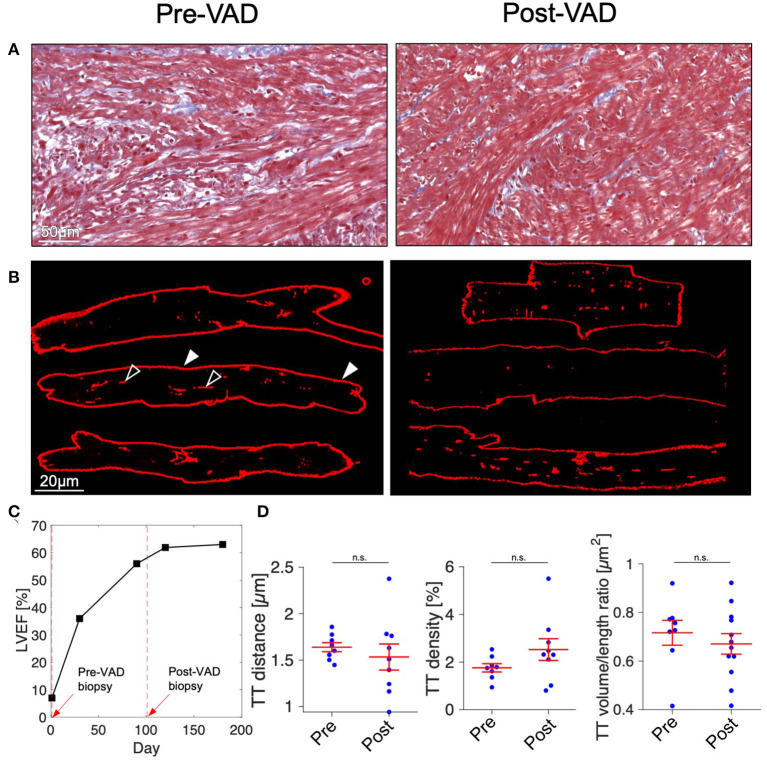
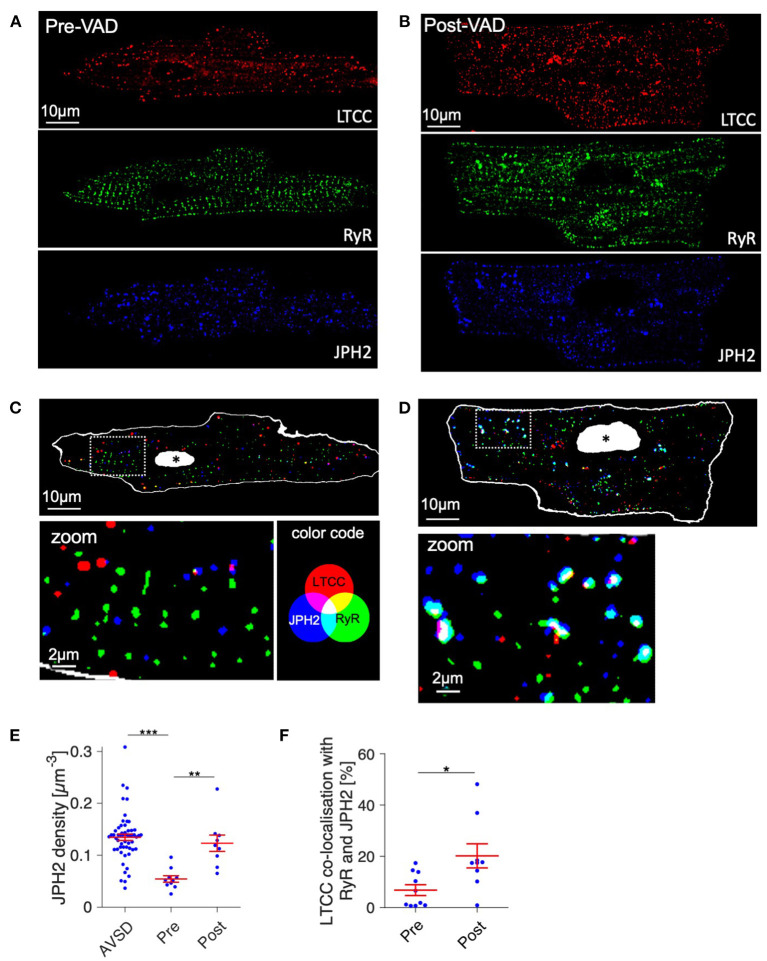
Chronic heart failure (HF) in adults causes remodeling of the cardiomyocyte transverse tubular system (t-system), which contributes to disease progression by impairing excitation-contraction (EC) coupling. However, it is unknown if t-system remodeling occurs in pediatric heart failure. This study investigated the t-system in pediatric viral myocarditis. The t-system and integrity of EC coupling junctions (co-localization of L-type Ca2+ channels with ryanodine receptors and junctophilin-2) were analyzed by 3D confocal microscopy in left-ventricular (LV) samples from 5 children with myocarditis (age 14 ± 3 months), undergoing ventricular assist device (VAD) implantation, and 5 children with atrioventricular septum defect (AVSD, age 17 ± 3 months), undergoing corrective surgery. LV ejection fraction (EF) was 58.4 ± 2.3% in AVSD and 12.2 ± 2.4% in acute myocarditis. Cardiomyocytes from myocarditis samples showed increased t-tubule distance (1.27 ± 0.05 μm, n = 34 cells) and dilation of t-tubules (volume-length ratio: 0.64 ± 0.02 μm2) when compared with AVSD (0.90 ± 0.02 μm, p < 0.001; 0.52 ± 0.02 μm2, n = 61, p < 0.01). Intriguingly, 4 out of 5 myocarditis samples exhibited sheet-like t-tubules (t-sheets), a characteristic feature of adult chronic heart failure. The fraction of extracellular matrix was slightly higher in myocarditis (26.6 ± 1.4%) than in AVSD samples (24.4 ± 0.8%, p < 0.05). In one case of myocarditis, a second biopsy was taken and analyzed at VAD explantation after extensive cardiac recovery (EF from 7 to 56%) and clinical remission. When compared with pre-VAD, t-tubule distance and density were unchanged, as well as volume-length ratio (0.67 ± 0.04 μm2 vs. 0.72 ± 0.05 μm2, p = 0.5), reflecting extant t-sheets. However, junctophilin-2 cluster density was considerably higher (0.12 ± 0.02 μm-3 vs. 0.05 ± 0.01 μm-3, n = 9/10, p < 0.001), approaching values of AVSD (0.13 ± 0.05 μm-3, n = 56), and the measure of intact EC coupling junctions showed a distinct increase (20.2 ± 5.0% vs. 6.8 ± 2.2%, p < 0.001). Severe t-system loss and remodeling to t-sheets can occur in acute HF in young children, resembling the structural changes of chronically failing adult hearts. T-system remodeling might contribute to cardiac dysfunction in viral myocarditis. Although t-system recovery remains elusive, recovery of EC coupling junctions may be possible and deserves further investigation.

Keywords: confocal micoscopy; excitation-contracting coupling; heart failiure; myocarditis; remodeling; ryanodine receptor (RyR); transverse tubular system.


Conflict of interest statement

The authors declare that the research was conducted in the absence of any commercial or financial relationships that could be construed as a potential conflict of interest.

Figures

Figure 1
Figure 1
Confocal microscopic images and 3D t-system reconstruction of LV tissue samples from pediatric patients with AVSD (left) or fulminant myocarditis (right). (A,B) Raw confocal images of myocardial tissue sections stained with WGA. (C,D) The surface membrane (white) and t-system (red, green) were discerned by image segmentation. Reconstructions represent three-dimensional views of the highlighted areas, with surface membranes (gray) and the t-system. Scale bars in (A,C) also apply to (B,D), respectively.
Figure 2
Figure 2
Quantification of t-system remodeling and cell size in AVSD and acute viral myocarditis. (A,B) Distance maps of the cells shown in Figure 1, with color-coded intracellular distance to the nearest t-tubule in μm (TT distance). (A) Example cell from AVSD, (B) Example cell from myocarditis. (C) Quantification of the intracellular t-tubule distance (TT distance), volume density (TT density), and shape (TT volume/length). (D) Cell area. Number of analyzed cells/patients: 61/5 (AVSD), 34/5 (myocarditis). **p < 0.01, ***p < 0.001, linear mixed-effects model with patient group (AVSD or myocarditis) as predicting variable and intercept as random effect by patient (i.e., sample). Scale bar in (A) also applies to (B).
Figure 3
Figure 3
Confocal microscopic images of myocardial samples from AVSD and myocarditis patients. (A–E) Tissues obtained from five pediatric patients with atrioventricular septal defect (AVSD), stained with WGA (red), and DAPI (blue) (F–J) Tissues obtained from five pediatric patients with myocarditis. Enlarged t-system components (t-sheets) are indicated with white arrows. The tissue in (F) was retrieved at time of VAD explantation, (G–J) at time of implantation. Note the low t-system density in (F–J) when compared with (A–E) and that t-sheets appear as longitudinal components in the xy view. Scale bar in (A) also applies to (B–J).
Figure 4
Figure 4
Cardiomyocyte t-system parameters grouped by patient. (A) Intracellular t-tubule (TT) distance of cells from five AVSD and five myocarditis patients (one sample per patient). (B) Cardiomyocyte TT density (TT volume divided by cell volume). (C) Mean cardiomyocyte TT volume-to-length ratio, a measure of TT enlargement. Number of analyzed cells: 13/14/6/15/11 (AVSD 1-5) and 8/5/8/9/4 (Myocarditis 1-5), respectively. One-way ANOVA (patient as categorical variable): p < 0.01 in (A–C).
Figure 5
Figure 5
Quantification of extracellular matrix (ECM) as a measure of fibrosis in myocardial tissue from AVSD and Myocarditis patients. (A) Example of a confocal image from AVSD tissue stained with WGA (red) and DAPI (blue). (B) The resulting binary image after application of a histogram-based intensity-threshold was used to calculate the fraction of ECM. (C) ECM fraction of myocardial samples from 5 AVSD and 5 Myocarditis patients, obtained from 25 and 13 confocal image stacks, respectively. *p < 0.05, linear mixed-effects model with patient group (AVSD or Myocarditis) as predicting variable and intercept as random effect by patient (i.e., sample). Scale bar in (A) also applies to (B).
Figure 6
Figure 6
Speckle tracking and M-mode echocardiography of a 21-month old patient with fulminant viral myocarditis. Apical 4-chamber views with tracing of the endo- and epicardium and longitudinal strain (SL) of the left ventricle (top), and M-mode view (bottom) (A) 1 day before VAD implantation, (B) after 1 month of VAD therapy, (C) after 3 months of VAD therapy. Global strain (GS) is indicated in yellow. Note the different color scaling in (C).
Figure 7
Figure 7
Histology and t-system quantification after functional cardiac recovery. (A) Masson's trichrome stain of myocardial tissue of a 21-month old myocarditis patient before VAD implantation (Pre-VAD) and at time of VAD explantation (Post-VAD) 3 months later. Cardiomyocytes appar red, collagen appears blue. (B) Pre- and Post-VAD confocal microscopic images of isolated and membrane-stained cardiomyocytes. In one example cell, filled arrow heads point to the surface membrane, empty arrow heads point to t-system components. (C) Overview of patient's cardiac function expressed as left-ventricular ejection fraction (LVEF). Dashed red lines and arrows indicate times of VAD implantation and explantation. (D) Cardiomyocyte t-tubule (TT) distance, TT density, and TT volume/length ratio (n = 8/9 cells for Pre- and Post-VAD, respectively). n.s., not significant (p > 0.05), unpaired two-tailed t-test.
Figure 8
Figure 8
Structural integrity of excitation-contraction (EC) coupling junctions before and after VAD therapy of a myocarditis patient. (A,B) Raw confocal images of fixed isolated cardiomyocytes from pre- and post-VAD of the patient presented in Figures 6, 7, co-stained for LTCC (red), RyR (green), and JPH2 (blue) and with DAPI (not shown). (C,D) Overlay of binary images for the EC coupling proteins shown in (A,B), with magnifications of boxed regions. The cell surface, obtained from autofluorescence, is shown white, nuclei are shown white with black asterisk. Co-localizations of LTCC, JPH2, and RyR appear cyan, magenta, yellow, or white (see color legend). (E) Cardiomyocyte JPH2 cluster density (JPH2 density) of AVSD as reference and the Pre- and Post-VAD sample. (F) Fraction of LTCC clusters that were co-localized with both RyR and JPH2, as a measure of intact EC coupling junctions (n = 10/9 cells for Pre/Post-VAD). *p < 0.05, **p < 0.01, ***p < 0.001, unpaired, two-tailed t-test with Holm–Bonferroni multiple-comparison correction.

References

    1. Sun XH, Protasi F, Takahashi M, Takeshima H, Ferguson DG, Franzini-Armstrong C. Molecular architecture of membranes involved in excitation-contraction coupling of cardiac muscle. J Cell Biol. (1995) 129:659–71. 10.1083/jcb.129.3.659 - DOI - PMC - PubMed
    1. Takeshima H, Komazaki S, Nishi M, Iino M, Kangawa K. Junctophilins: a novel family of junctional membrane complex proteins. Mol Cell. (2000) 6:11–22. 10.1016/S1097-2765(05)00005-5 - DOI - PubMed
    1. Munro ML, Jayasinghe ID, Wang Q, Quick A, Wang W, Baddeley D, et al. . Junctophilin-2 in the nanoscale organisation and functional signalling of ryanodine receptor clusters in cardiomyocytes. J Cell Sci. (2016) 129:4388–98. 10.1242/jcs.196873 - DOI - PMC - PubMed
    1. Jones PP, MacQuaide N, Louch WE. Dyadic plasticity in cardiomyocytes. Front Physiol. (2018) 9:1773. 10.3389/fphys.2018.01773 - DOI - PMC - PubMed
    1. Savio-Galimberti E, Frank J, Inoue M, Goldhaber JI, Cannell MB, Bridge JH, et al. . Novel features of the rabbit transverse tubular system revealed by quantitative analysis of three-dimensional reconstructions from confocal images. Biophys J. (2008) 95:2053–62. 10.1529/biophysj.108.130617 - DOI - PMC - PubMed