Gluteal atrophy and fatty infiltration in end-stage osteoarthritis of the hip: a case-control study
- PMID: 33537675
- PMCID: PMC7842157
- DOI: 10.1302/2633-1462.21.BJO-2020-0179.R1
Gluteal atrophy and fatty infiltration in end-stage osteoarthritis of the hip: a case-control study
Abstract
Aims: The gluteus minimus (GMin) and gluteus medius (GMed) have unique structural and functional segments that may be affected to varying degrees, by end-stage osteoarthritis (OA) and normal ageing. We used data from patients with end-stage OA and matched healthy controls to 1) quantify the atrophy of the GMin and GMed in the two groups and 2) describe the distinct patterns of the fatty infiltration in the different segments of the GMin and GMed in the two groups.
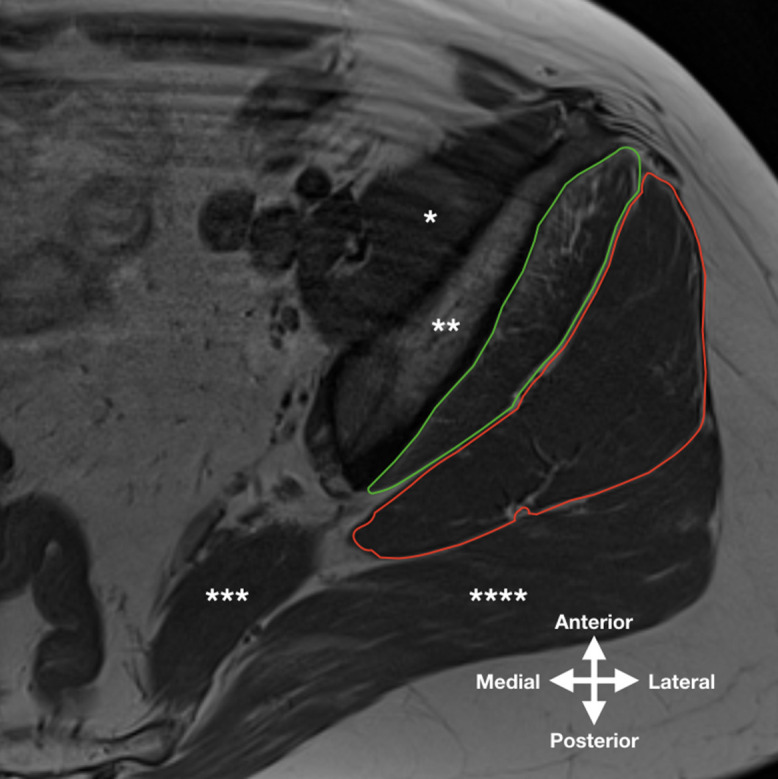
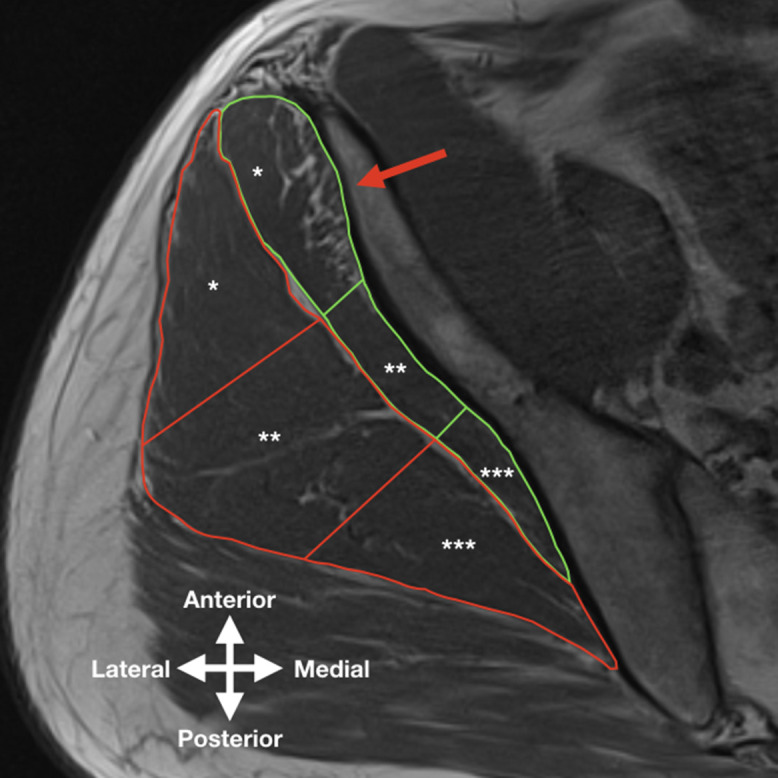
Methods: A total of 39 patients with end-stage OA and 12 age- and sex frequency-matched healthy controls were prospectively enrolled in the study. Fatty infiltration within the different segments of the GMin and the GMed was assessed on MRI according to the semiquantitative classification system of Goutallier and normalized cross-sectional areas were measured.
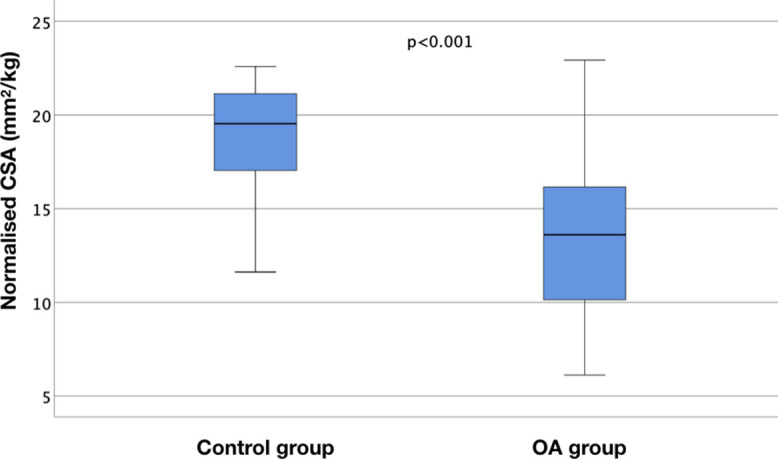
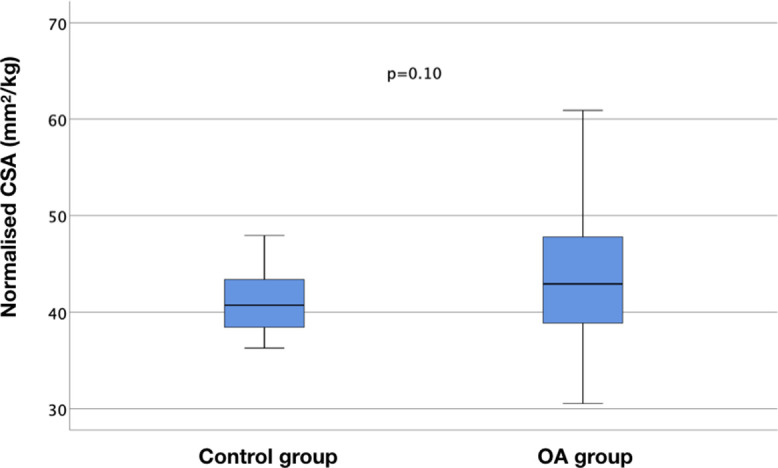
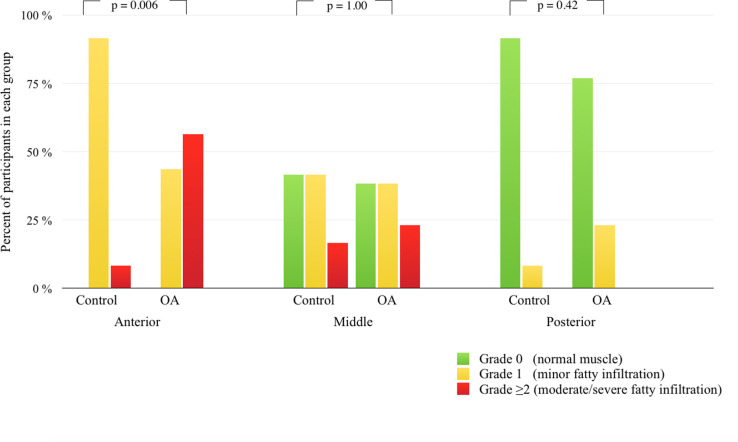
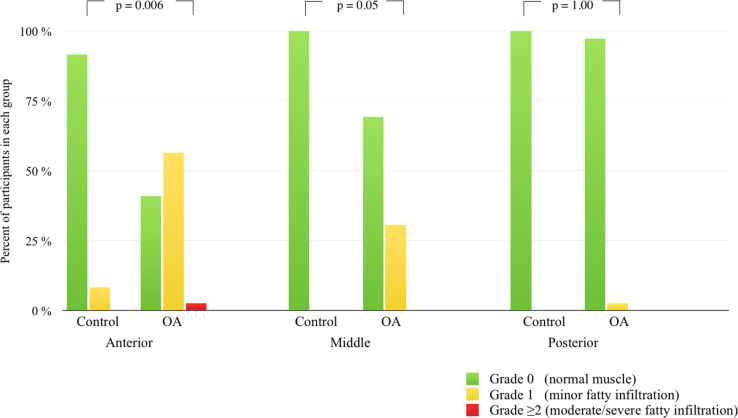
Results: The GMin was smaller in the OA-group (p < 0.001) compared to the control group, but there was no group difference in the size of the GMed (p = 0.101). Higher levels of fatty infiltration were identified in the anterior segment of the GMin (p = 0.006) and the anterior (p = 0.006) and middle (p = 0.047) segments of the GMed in the OA group. All subjects in the control group had fatty infiltration of the anterior segment of the GMin, but all except one had no fatty infiltration in the entire GMed.
Conclusion: End-stage OA was associated with significant atrophy of the GMin and higher levels of fatty infiltration, particularly in the anterior segments of the GMin and GMed. Minor fatty infiltration of the anterior segment of GMin appears to be a normal part of ageing. Our study has demonstrated different patterns of atrophy and fatty infiltration between patients with end-stage OA and healthy matched peers.Cite this article: Bone Jt Open 2021;2(1):40-47.
Keywords: Hip; MRI; Muscle; Muscular atrophy; Osteoarthritis; Skeletal.
© 2021 Author(s) et al.
Conflict of interest statement
ICMJE COI statement: The authors declare no sources of conflict of interest in relation to this work. Each author certifies that he or she has no commercial associations that might pose a conflict of interest in connection with the submitted article.
Figures
Similar articles
-
A SYSTEMATIC REVIEW AND META-ANALYSIS OF COMMON THERAPEUTIC EXERCISES THAT GENERATE HIGHEST MUSCLE ACTIVITY IN THE GLUTEUS MEDIUS AND GLUTEUS MINIMUS SEGMENTS.Int J Sports Phys Ther. 2020 Dec;15(6):856-881. doi: 10.26603/ijspt20200856. Int J Sports Phys Ther. 2020. PMID: 33344003 Free PMC article.
-
Hip abductor muscle volume in hip osteoarthritis and matched controls.Osteoarthritis Cartilage. 2016 Oct;24(10):1727-1735. doi: 10.1016/j.joca.2016.05.002. Epub 2016 May 7. Osteoarthritis Cartilage. 2016. PMID: 27163446
-
Comparison of gluteus medius and minimus activity during gait in people with hip osteoarthritis and matched controls.Scand J Med Sci Sports. 2019 May;29(5):696-705. doi: 10.1111/sms.13379. Epub 2019 Jan 25. Scand J Med Sci Sports. 2019. PMID: 30615237
-
Muscle size and composition in people with articular hip pathology: a systematic review with meta-analysis.Osteoarthritis Cartilage. 2019 Feb;27(2):181-195. doi: 10.1016/j.joca.2018.10.008. Epub 2018 Oct 30. Osteoarthritis Cartilage. 2019. PMID: 30389399
-
Lesions of the abductors in the hip.EFORT Open Rev. 2020 Sep 10;5(8):464-476. doi: 10.1302/2058-5241.5.190094. eCollection 2020 Aug. EFORT Open Rev. 2020. PMID: 32953132 Free PMC article. Review.
Cited by
-
Fatty infiltration of periarticular muscles in patients with osteonecrosis of the femoral head.Int Orthop. 2025 May;49(5):1073-1080. doi: 10.1007/s00264-025-06457-9. Epub 2025 Feb 20. Int Orthop. 2025. PMID: 39976738 Free PMC article.
-
Gluteal muscle fatty infiltration, fall risk, and mobility limitation in older women with urinary incontinence: a pilot study.Skeletal Radiol. 2023 Jan;52(1):47-55. doi: 10.1007/s00256-022-04132-3. Epub 2022 Jul 27. Skeletal Radiol. 2023. PMID: 35896734 Free PMC article.
-
Preoperative Lower-Limb Muscle Predictors for Gait Speed Improvement after Total Hip Arthroplasty for Patients with Osteoarthritis.J Pers Med. 2023 Aug 20;13(8):1279. doi: 10.3390/jpm13081279. J Pers Med. 2023. PMID: 37623529 Free PMC article.
-
Effects of a targeted resistance intervention compared to a sham intervention on gluteal muscle hypertrophy, fatty infiltration and strength in people with hip osteoarthritis: analysis of secondary outcomes from a randomised clinical trial.BMC Musculoskelet Disord. 2022 Oct 29;23(1):944. doi: 10.1186/s12891-022-05907-4. BMC Musculoskelet Disord. 2022. PMID: 36309690 Free PMC article. Clinical Trial.
-
Cross-sectional fat fraction analysis of the gluteus medius and minimus muscle in asymptomatic vs. symptomatic hips using 2-point Dixon MRI.BMC Musculoskelet Disord. 2025 Aug 7;26(1):764. doi: 10.1186/s12891-025-09043-7. BMC Musculoskelet Disord. 2025. PMID: 40775346 Free PMC article.
References
-
- Chi AS, Long SS, Zoga AC, et al. . Prevalence and pattern of gluteus medius and minimus tendon pathology and muscle atrophy in older individuals using MRI. Skeletal Radiol. 2015;44(12):1727–1733. - PubMed
-
- Semciw AI, Green RA, Murley GS, Pizzari T. Gluteus minimus: an intramuscular EMG investigation of anterior and posterior segments during gait. Gait Posture. 2014;39(2):822–826. - PubMed
-
- Semciw AI, Pizzari T, Murley GS, Green RA. Gluteus medius: an intramuscular EMG investigation of anterior, middle and posterior segments during gait. Journal of Electromyography and Kinesiology. 2013;23(4):858–864. - PubMed
LinkOut - more resources
Full Text Sources
Other Literature Sources