Comparative Study
. 2021 Jun 1;143(6):064501.
doi: 10.1115/1.4050033.

Comparison of the Trueness of Fits of the Biphasic Transverse Isotropic and Kelvin Models to the Tensile Behavior of Temporomandibular Joint Disc

Affiliations
Comparative Study

Comparison of the Trueness of Fits of the Biphasic Transverse Isotropic and Kelvin Models to the Tensile Behavior of Temporomandibular Joint Disc

Wuyang Li et al. J Biomech Eng. .

Abstract

This technical brief explores the validity and trueness of fit for using the transverse isotropic biphasic and Kelvin models (first and second order generalized) for characterization of the viscoelastic tensile properties of the temporomandibular joint (TMJ) discs from pigs and goats at a strain rate of 10 mm/min. We performed incremental stress-relaxation tests from 0 to 12% strain, in 4% strain steps on pig TMJ disc samples. In addition, to compare the outcomes of these models between species, we also performed a single-step stress-relaxation test of 10% strain. The transverse isotropic biphasic model yielded reliable fits in reference to the least root mean squared error method only at low strain, while the Kelvin models yielded good fits at both low and high strain, with the second order generalized Kelvin model yielding the best fit. When comparing pig to goat TMJ disc in 10% strain stress-relaxation test, unlike the other two Kelvin models, the transverse isotropic model did not fit well for this larger step. In conclusion, the second order Kelvin model showed the best fits to the experimental data of both species. The transverse isotropic biphasic model did not fit well with the experimental data, although better at low strain, suggesting that the assumption of water flow only applies while uncrimping the collagen fibers. Thus, it is likely that the permeability from the biphasic model is not truly representative, and other biphasic models, such as the poroviscoelastic model, would likely yield more meaningful outputs and should be explored in future works.


Figures

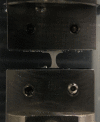
Dog-bone-shape strip placed between customized clamps
Fig. 1
Dog-bone-shape strip placed between customized clamps
An example of the transverse isotropic biphasic model fit for 0–4% strain step in a load intensity-time (σ–t) curve. Thin line: optimized fitting curve. Thick line: experimental data.
Fig. 2
An example of the transverse isotropic biphasic model fit for 0–4% strain step in a load intensity-time (σt) curve. Thin line: optimized fitting curve. Thick line: experimental data.
Plots of E1 (a), E3 (b), and k (c) outputted from the transverse isotropic biphasic model fit relative to strain (ε). (a) and (b) showed positive linear regression, while (c) showed negative power regression as shown by the dotted lines.
Fig. 3
Plots of E1 (a), E3 (b), and k (c) outputted from the transverse isotropic biphasic model fit relative to strain (ε). (a) and (b) showed positive linear regression, while (c) showed negative power regression as shown by the dotted lines.
Examples of the first (a) and second (b) order Kelvin model fit for 0–4% strain step in a load intensity-time (σ–t) curve using the same set of data as for the transverse isotropic biphasic model fit (Fig. 2). Thin line: optimized fitting curve. Thick line: experimental data.
Fig. 4
Examples of the first (a) and second (b) order Kelvin model fit for 0–4% strain step in a load intensity-time (σt) curve using the same set of data as for the transverse isotropic biphasic model fit (Fig. 2). Thin line: optimized fitting curve. Thick line: experimental data.
Plots of Ei, Er outputted from the first (a–b) and second (c–d) order Kelvin model fit relative to strain (ε). All parameters showed positive linear regression as shown by the dotted lines.
Fig. 5
Plots of Ei, Er outputted from the first (ab) and second (cd) order Kelvin model fit relative to strain (ε). All parameters showed positive linear regression as shown by the dotted lines.

References

    1. Kang, H. , Bao, G. J. , and Qi, S. N. , 2006, “ Biomechanical Responses of Human Temporomandibular Joint Disc Under Tension and Compression,” Int. J. Oral. Maxillofac. Surg., 35(9), pp. 817–821.10.1016/j.ijom.2006.03.005 - DOI - PubMed
    1. Ortun-Terrazas, J. , Cegonino, J. , and Perez Del Palomar, A. , 2020, “ Computational Characterization of the Porous-Fibrous Behavior of the Soft Tissues in the Temporomandibular Joint,” J. Biomed. Mater. Res. B, 108(5), pp. 2204–2217.10.1002/jbm.b.34558 - DOI - PMC - PubMed
    1. Arzi, B. , Murphy, M. K. , Leale, D. M. , Vapniarsky-Arzi, N. , and Verstraete, F. J. , 2015, “ The Temporomandibular Joint of California Sea Lions (Zalophus Californianus): Part 1—Characterisation in Health and Disease,” Arch. Oral. Biol., 60(1), pp. 208–215.10.1016/j.archoralbio.2014.09.004 - DOI - PubMed
    1. Detamore, M. S. , and Athanasiou, K. A. , 2003, “ Tensile Properties of the Porcine Temporomandibular Joint Disc,” ASME J. Biomech. Eng., 125(4), pp. 558–565.10.1115/1.1589778 - DOI - PubMed
    1. Kalpakci, K. N. , Willard, V. P. , Wong, M. E. , and Athanasiou, K. A. , 2011, “ An Interspecies Comparison of the Temporomandibular Joint Disc,” J. Dent. Res., 90(2), pp. 193–198.10.1177/0022034510381501 - DOI - PMC - PubMed

Publication types

LinkOut - more resources