

Temporin G, an amphibian antimicrobial peptide against influenza and parainfluenza respiratory viruses: Insights into biological activity and mechanism of action
- PMID: 33538061
- PMCID: PMC12315477
- DOI: 10.1096/fj.202001885RR
Temporin G, an amphibian antimicrobial peptide against influenza and parainfluenza respiratory viruses: Insights into biological activity and mechanism of action
Abstract
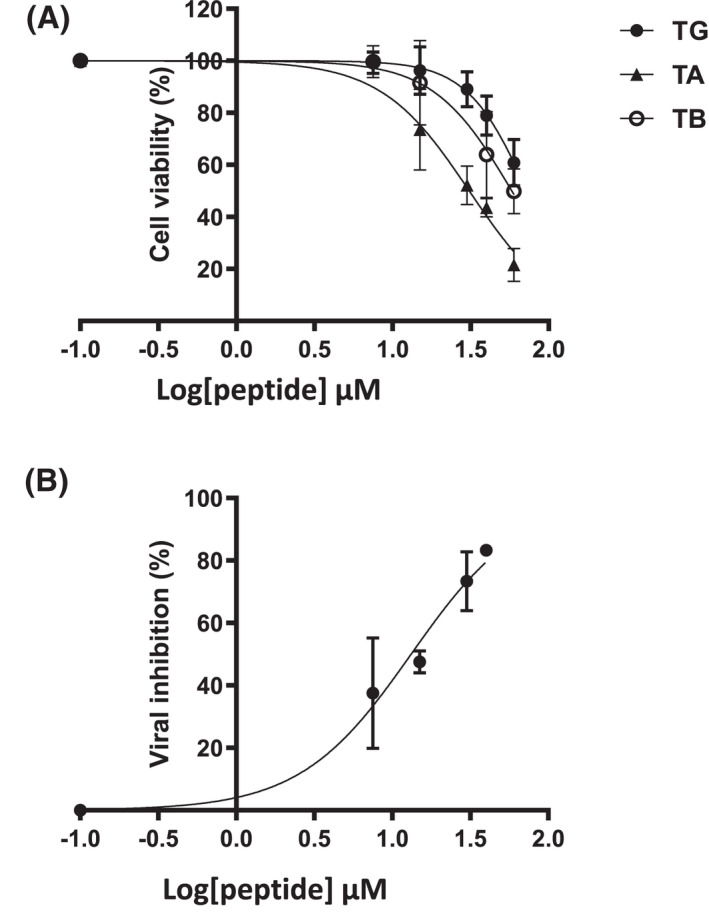
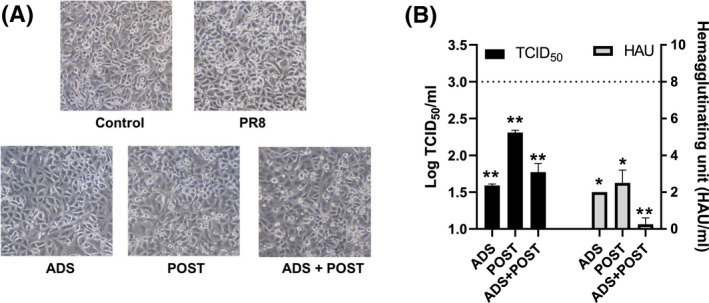
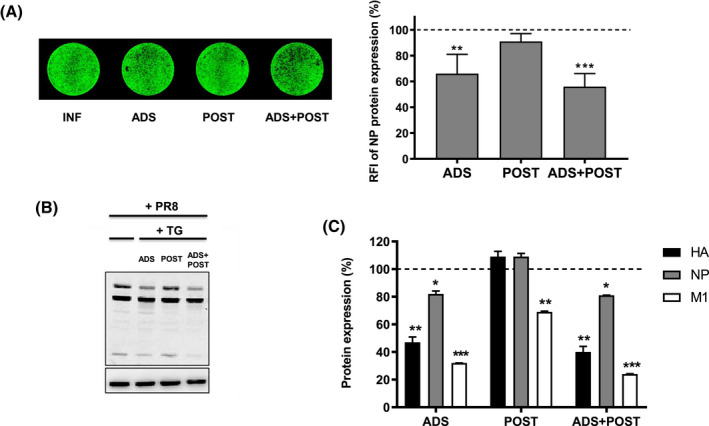
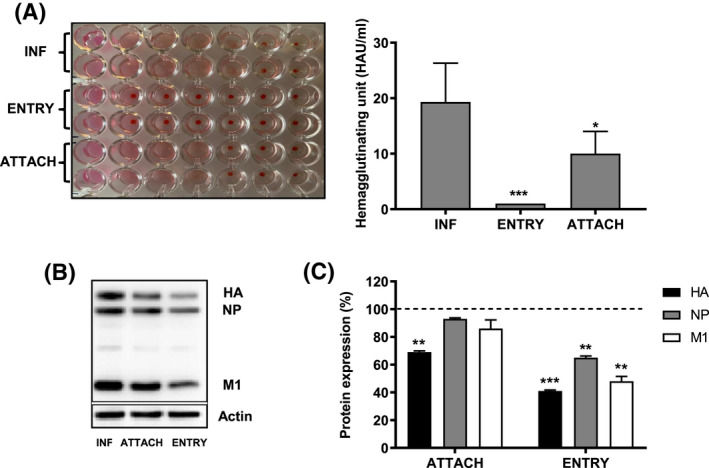
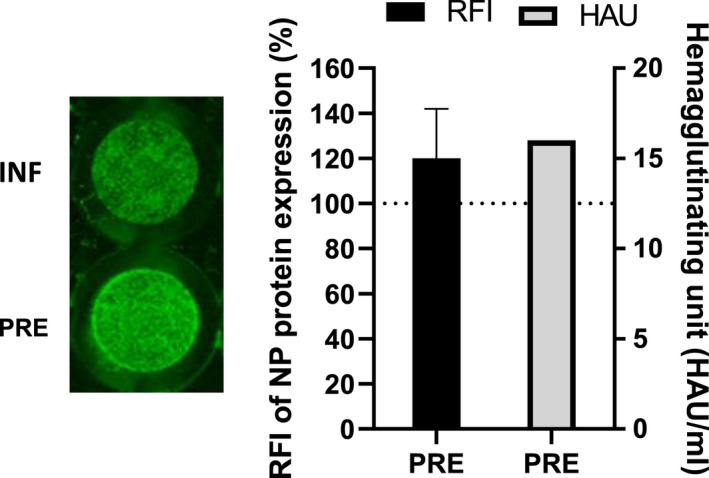
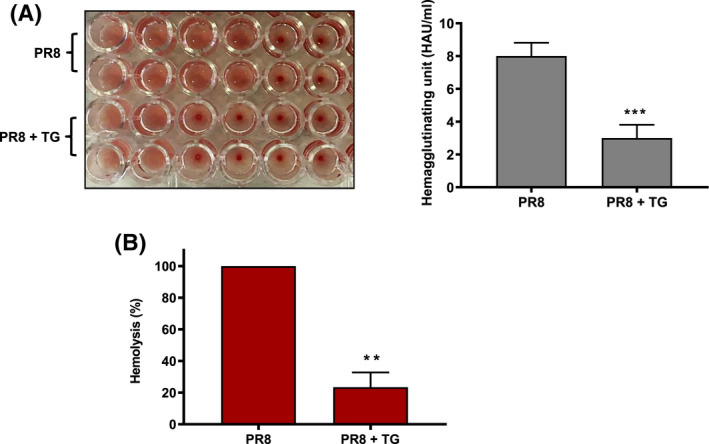
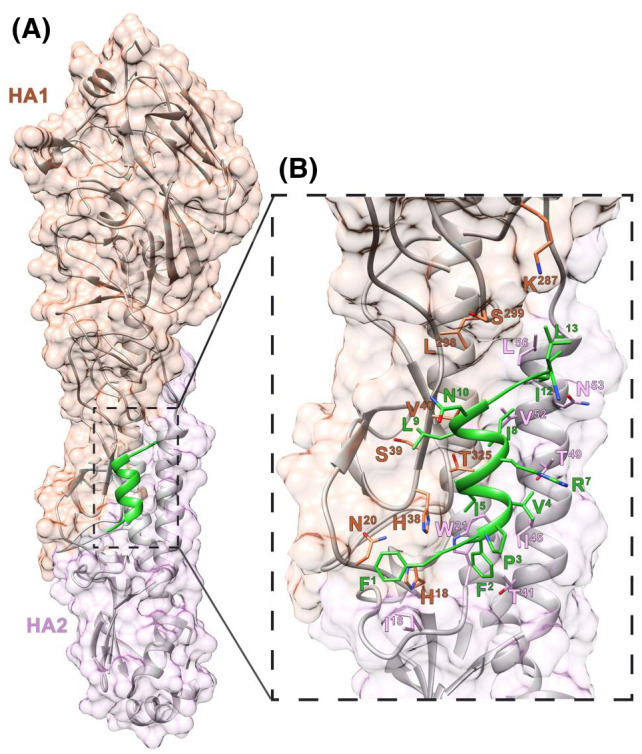
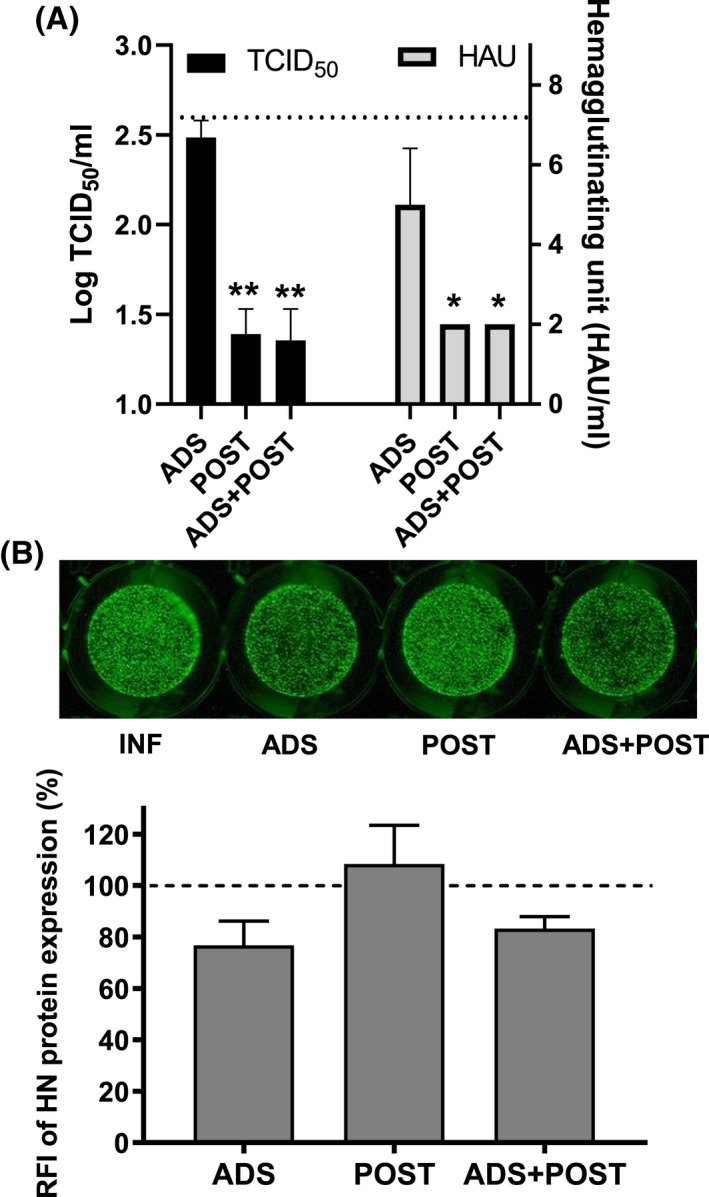
Treatment of respiratory viral infections remains a global health concern, mainly due to the inefficacy of available drugs. Therefore, the discovery of novel antiviral compounds is needed; in this context, antimicrobial peptides (AMPs) like temporins hold great promise. Here, we discovered that the harmless temporin G (TG) significantly inhibited the early life-cycle phases of influenza virus. The in vitro hemagglutinating test revealed the existence of TG interaction with the viral hemagglutinin (HA) protein. Furthermore, the hemolysis inhibition assay and the molecular docking studies confirmed a TG/HA complex formation at the level of the conserved hydrophobic stem groove of HA. Remarkably, these findings highlight the ability of TG to block the conformational rearrangements of HA2 subunit, which are essential for the viral envelope fusion with intracellular endocytic vesicles, thereby neutralizing the virus entry into the host cell. In comparison, in the case of parainfluenza virus, which penetrates host cells upon a membrane-fusion process, addition of TG to infected cells provoked ~1.2 log reduction of viral titer released in the supernatant. Nevertheless, at the same condition, an immunofluorescent assay showed that the expression of viral hemagglutinin/neuraminidase protein was not significantly reduced. This suggested a peptide-mediated block of some late steps of viral replication and therefore the impairment of the extracellular release of viral particles. Overall, our results are the first demonstration of the ability of an AMP to interfere with the replication of respiratory viruses with a different mechanism of cell entry and will open a new avenue for the development of novel therapeutic approaches against a large variety of respiratory viruses, including the recent SARS-CoV2.
Keywords: antimicrobial peptides; antiviral agents; influenza; parainfluenza; viral infection.
© 2021 Federation of American Societies for Experimental Biology.
Conflict of interest statement
The authors have stated explicitly that there are no conflicts of interest in connection with this article.
Figures
Similar articles
-
In vitro antiviral activities of thymol and Limonin against influenza a viruses and SARS-CoV-2.Sci Rep. 2025 Jul 2;15(1):22587. doi: 10.1038/s41598-025-06967-x. Sci Rep. 2025. PMID: 40596436 Free PMC article.
-
A small molecule compound targeting hemagglutinin inhibits influenza A virus and exhibits broad-spectrum antiviral activity.Acta Pharmacol Sin. 2024 Nov;45(11):2380-2393. doi: 10.1038/s41401-024-01331-7. Epub 2024 Jul 10. Acta Pharmacol Sin. 2024. PMID: 38987389
-
A branched peptide targets virus and host to block influenza virus and rhinovirus entry.Antimicrob Agents Chemother. 2025 Aug 6;69(8):e0002425. doi: 10.1128/aac.00024-25. Epub 2025 Jun 25. Antimicrob Agents Chemother. 2025. PMID: 40560073 Free PMC article.
-
Physical interventions to interrupt or reduce the spread of respiratory viruses.Cochrane Database Syst Rev. 2023 Jan 30;1(1):CD006207. doi: 10.1002/14651858.CD006207.pub6. Cochrane Database Syst Rev. 2023. PMID: 36715243 Free PMC article.
-
Systemic pharmacological treatments for chronic plaque psoriasis: a network meta-analysis.Cochrane Database Syst Rev. 2021 Apr 19;4(4):CD011535. doi: 10.1002/14651858.CD011535.pub4. Cochrane Database Syst Rev. 2021. Update in: Cochrane Database Syst Rev. 2022 May 23;5:CD011535. doi: 10.1002/14651858.CD011535.pub5. PMID: 33871055 Free PMC article. Updated.
Cited by
-
Broad-Spectrum Antiviral Activity of the Amphibian Antimicrobial Peptide Temporin L and Its Analogs.Int J Mol Sci. 2022 Feb 13;23(4):2060. doi: 10.3390/ijms23042060. Int J Mol Sci. 2022. PMID: 35216177 Free PMC article.
-
Aminomalononitrile inspired prebiotic chemistry as a novel multicomponent tool for the synthesis of imidazole and purine derivatives with anti-influenza A virus activity.RSC Adv. 2021 Sep 8;11(48):30020-30029. doi: 10.1039/d1ra05240c. eCollection 2021 Sep 6. RSC Adv. 2021. PMID: 35480240 Free PMC article.
-
The Inhibition of DNA Viruses by the Amphibian Antimicrobial Peptide Temporin G: A Virological Study Addressing HSV-1 and JPCyV.Int J Mol Sci. 2022 Jun 28;23(13):7194. doi: 10.3390/ijms23137194. Int J Mol Sci. 2022. PMID: 35806198 Free PMC article.
-
Brevinin-2GHk, a Peptide Derived from the Skin of Fejervarya limnocharis, Inhibits Zika Virus Infection by Disrupting Viral Integrity.Viruses. 2021 Nov 28;13(12):2382. doi: 10.3390/v13122382. Viruses. 2021. PMID: 34960651 Free PMC article.
-
A Review on cLF36, a Novel Recombinant Antimicrobial Peptide-Derived Camel Lactoferrin.Probiotics Antimicrob Proteins. 2024 Oct;16(5):1886-1905. doi: 10.1007/s12602-024-10285-5. Epub 2024 May 9. Probiotics Antimicrob Proteins. 2024. PMID: 38722550 Review.
References
-
- WHO . Influenza (seasonal). https://www.who.int/news‐room/fact‐sheets/detail/influenza‐(seasonal)
Publication types
MeSH terms
Substances
LinkOut - more resources
Full Text Sources
Other Literature Sources
Research Materials
Miscellaneous
