. 2021 Apr 5;220(4):e201911114.
doi: 10.1083/jcb.201911114.

Completion of neuronal remodeling prompts myelination along developing motor axon branches

Affiliations

Completion of neuronal remodeling prompts myelination along developing motor axon branches

Mengzhe Wang et al. J Cell Biol. .

Abstract

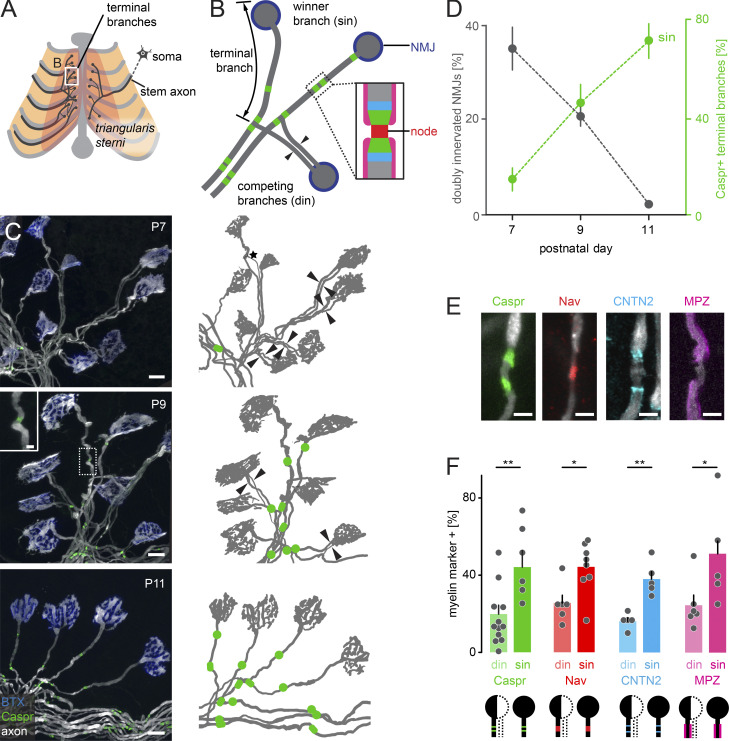
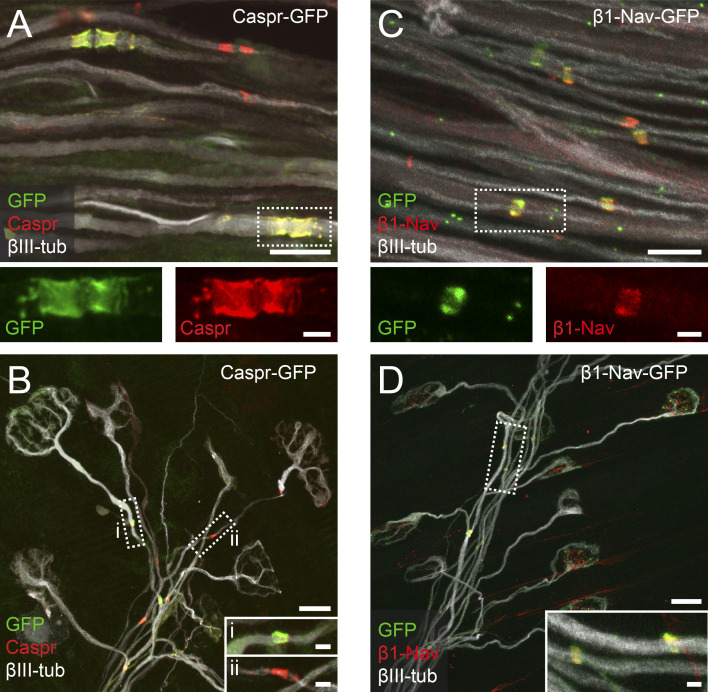
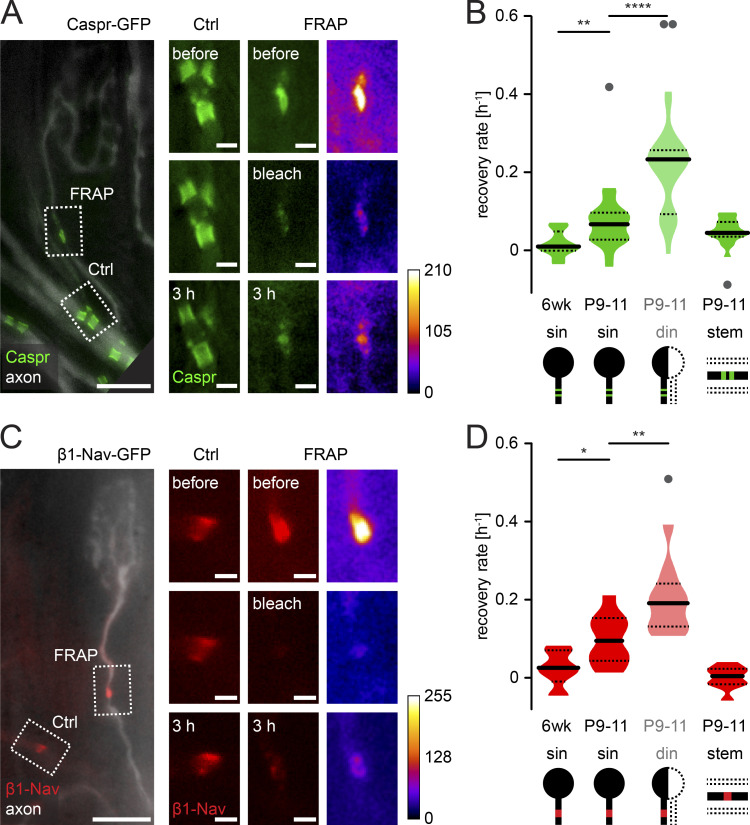
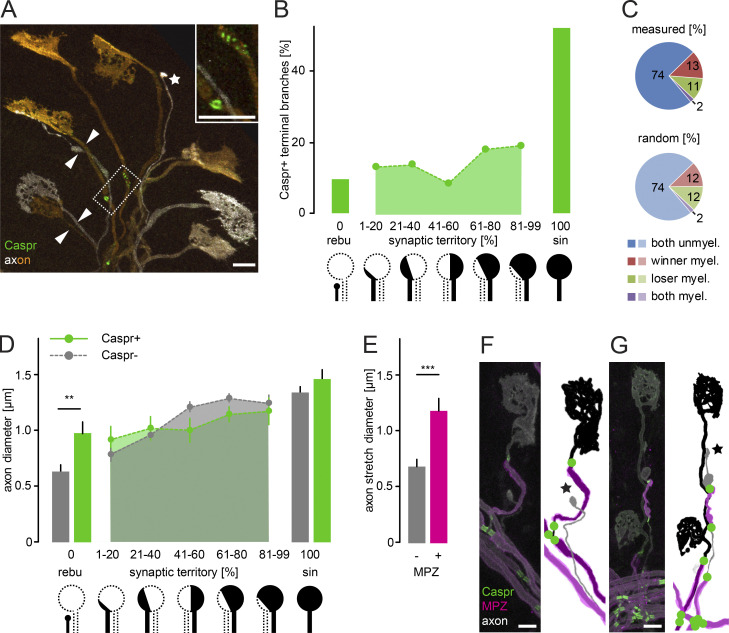
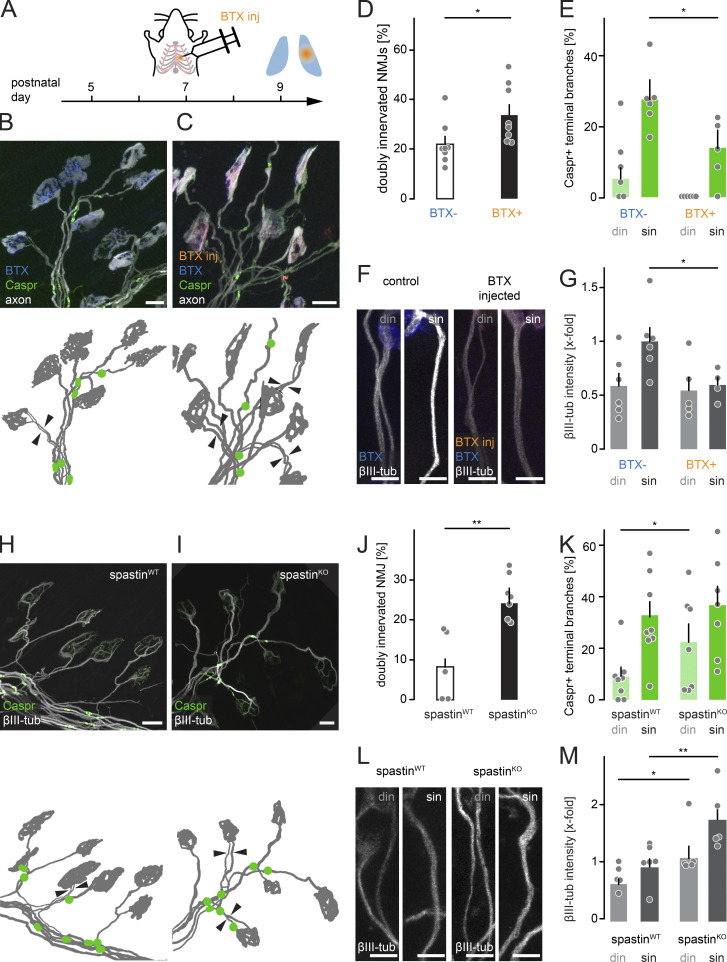
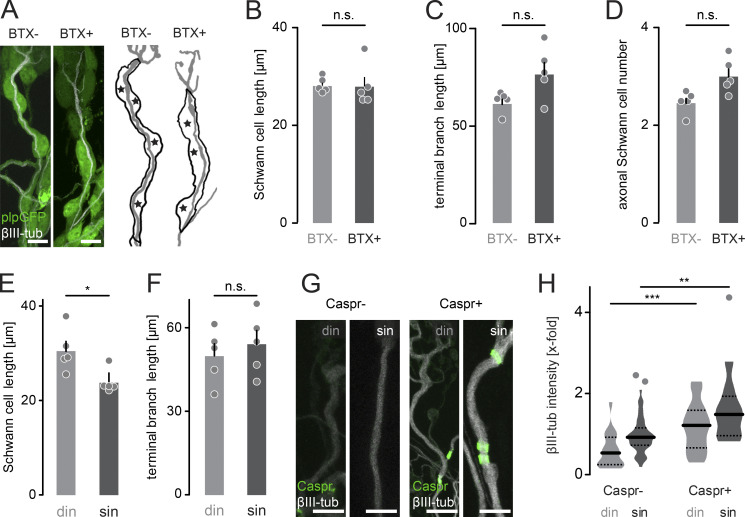
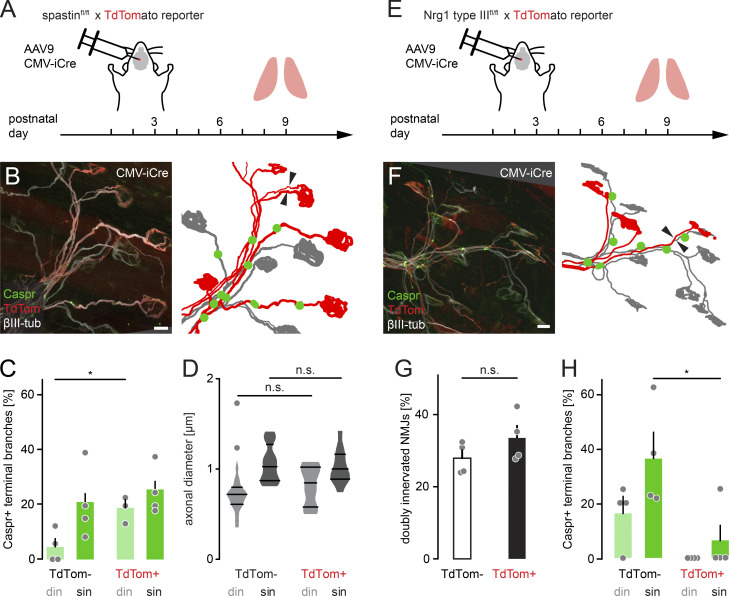
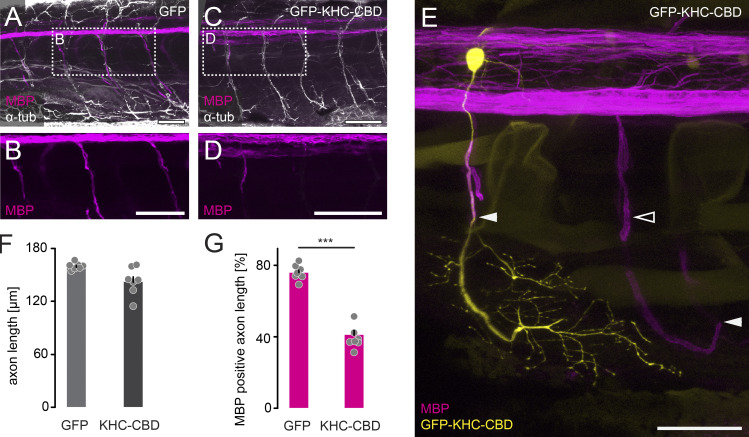
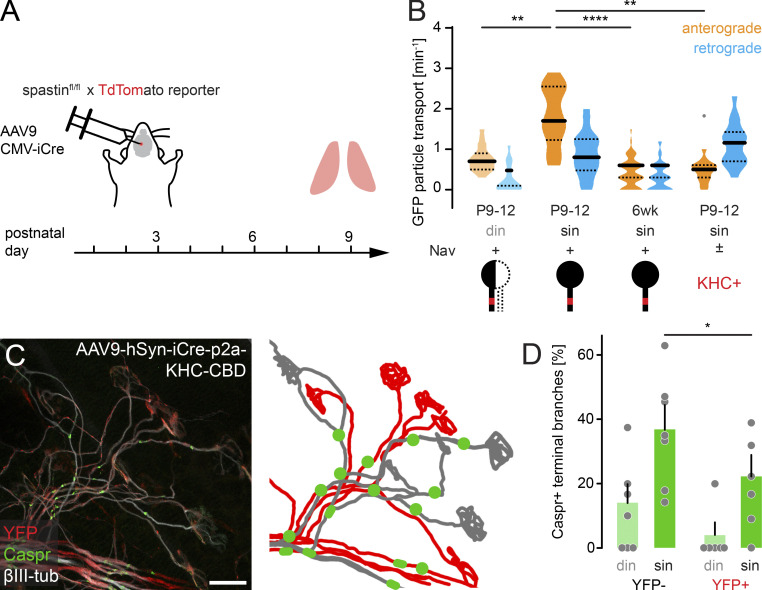
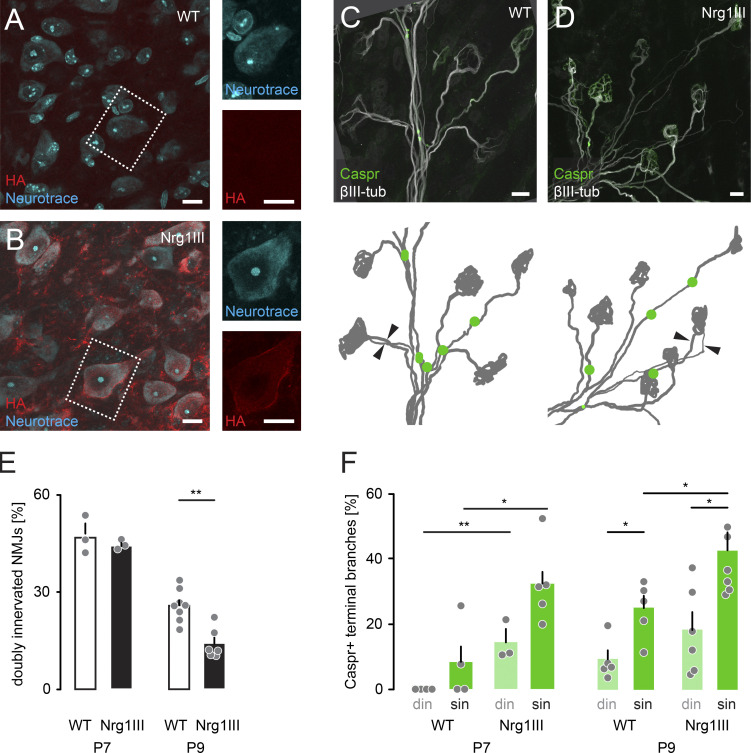
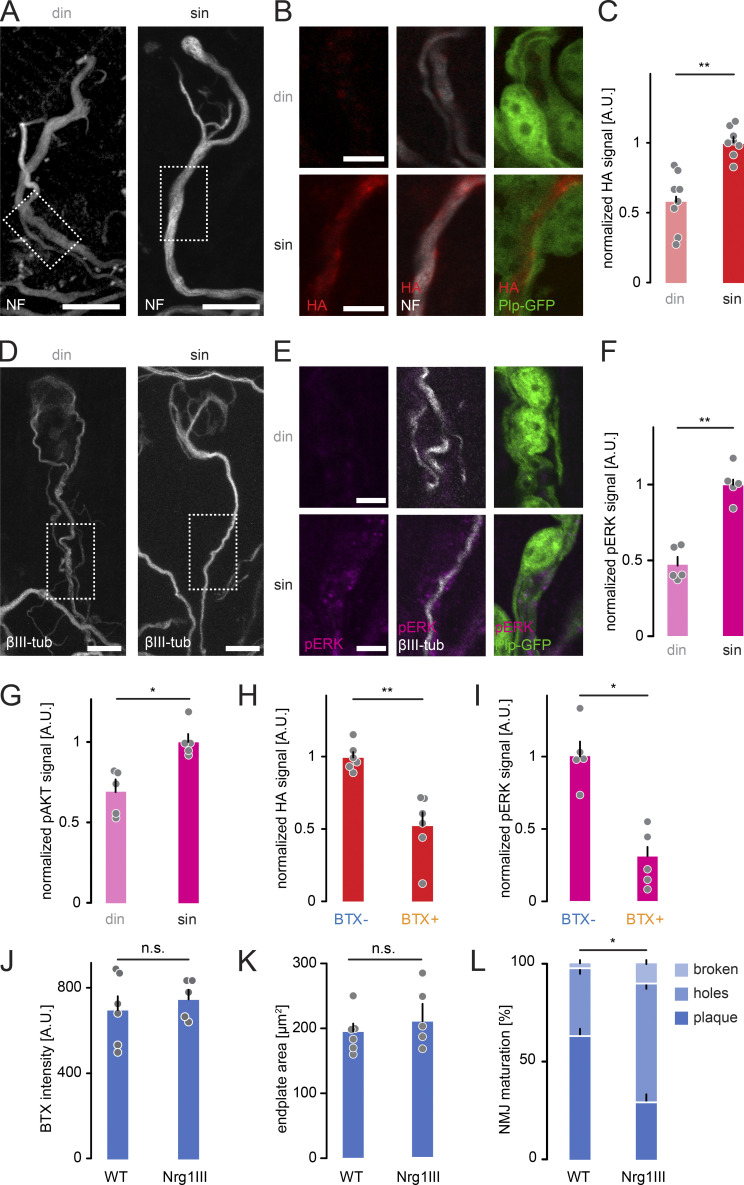
Neuronal remodeling and myelination are two fundamental processes during neurodevelopment. How they influence each other remains largely unknown, even though their coordinated execution is critical for circuit function and often disrupted in neuropsychiatric disorders. It is unclear whether myelination stabilizes axon branches during remodeling or whether ongoing remodeling delays myelination. By modulating synaptic transmission, cytoskeletal dynamics, and axonal transport in mouse motor axons, we show that local axon remodeling delays myelination onset and node formation. Conversely, glial differentiation does not determine the outcome of axon remodeling. Delayed myelination is not due to a limited supply of structural components of the axon-glial unit but rather is triggered by increased transport of signaling factors that initiate myelination, such as neuregulin. Further, transport of promyelinating signals is regulated via local cytoskeletal maturation related to activity-dependent competition. Our study reveals an axon branch-specific fine-tuning mechanism that locally coordinates axon remodeling and myelination.


Figures

Figure 1.
Figure 1.
Myelination coincides with axon remodeling during the second postnatal week. (A) Schematic of thoracic nerve-muscle explant indicating anatomy of motor axons (dark gray), including the stem axon in the intercostal nerve, soma (motor neuron cell body in spinal cord), triangularis sterni muscle (pink), and sternum and ribs (light gray). The boxed area of terminal branches is schematized in more detail in B. (B) Schematic of terminal branches of motor neurons (dark gray), postsynaptic AChRs (NMJ; blue). Arrowheads point to two competing branches leading to the same NMJ; sin, winner branch. Regions of nodes of Ranvier include paranodes (green), node (red), and juxtaparanodes (cyan). SCs myelinate axons in internodal regions (magenta). (C) P7, P9, and P11 triangularis sterni muscles of Thy1-YFP16 mice (axon, white) immunostained for Caspr (green) and postsynaptic AChRs (BTX, blue). Inset shows an emerging paranodal Caspr cluster at P9. Corresponding schematics to the right show axons (gray) and Caspr-positive paranodes (green). Arrowheads point to two axons leading to the same NMJ. (D) Quantification of the percentage of doubly innervated NMJs at P7, P9, and P11 (n ≥ 5 mice, ≥100 NMJs per animal, gray) and the percentage of Caspr-positive terminal branches among singly innervated NMJs (n ≥ 5 mice, ≥100 NMJs per animal, gray) and the percentage of Caspr-positive terminal branches among singly innervated NMJs (n ≥ 7 mice, ≥30 branches per animal, green). (E) Nodes of Ranvier and myelin components show immunostaining for Caspr (green, paranode), Nav (red, nodal region), CNTN2 (cyan, juxtaparanode), and MPZ (magenta, myelin) in single terminal axon branches of Thy1-XFP mice (axons, white). (F) Quantification of the percentage of myelin initiation on winner (singly innervating [sin]) or competing (doubly innervating [din]) terminal axon branches for Caspr (green), Nav (red), CNTN2 (cyan), or MPZ (magenta; n ≥ 5 mice per group, ≥50 branches). Data represent mean ± SEM (D) or mean + SEM (F). *, P < 0.05; **, P < 0.01; Mann–Whitney test. Scale bars represent 10 µm (C, overview) and 2 µm (C, inset, and E).
Figure S1.
Figure S1.
Characterization of Thy1-Caspr-GFP and Thy1-β1-Nav-GFP mice. (A) Confocal image of P9 Thy1-Caspr-GFP (native GFP, green) intercostal axons (βIII-tubulin, white) immunostained for Caspr (red). Dashed boxes enlarged below show single channels. The percentage of GFP-positive paranodes nodes was stable across development, suggesting consistent labeling of a neuronal subset (P9–P11: 65 ± 8% of all paranodal structures; 6 wk: 73 ± 9%; P = 0.7, Mann–Whitney test; n = 4 mice per age group, ≥44 nodes per animal). (B) Triangularis sterni muscle of a P9 Thy1-Caspr-GFP mouse immunostained for Caspr (red) and axons (βIII-tubulin, white). Dashed boxes enlarged below show Caspr/GFP double-positive (i) and Caspr-only–positive paranodes (ii). Expression of the Caspr-GFP transgene did not detectably influence the degree of double innervation (WT, 9 ± 1% vs. Caspr-GFP, 12 ± 2%; P = 0.4, Mann–Whitney test; n = 3 mice per genotype, ≥136 axons per animal) or myelination on terminal axon branches at P9 (winner branches: WT, 32 ± 2% vs. Caspr-GFP, 35 ± 8%; competing branches: WT, 12 ± 6% vs. Caspr-GFP, 7 ± 7%; P > 0.99, Mann–Whitney test; n = 3 mice per genotype, ≥31 axons per animal). (C) Image of P9 Thy1-β1-Nav-GFP (native GFP, green) intercostal axons (βIII-tubulin, white) immunostained for Nav (red). Dashed boxes enlarged below show single channels. All nodes identified by immunostaining were also GFP positive, indicating transgene expression in all motor neurons (100 ± 0%; n = 3 mice, ≥40 axons per animal). (D) Triangularis sterni muscle of a P9 Thy1-β1-Nav-GFP mouse immunostained for Nav (red) along terminal axon branches (βIII-tubulin, white). Insets show enlarged Nav/GFP double-positive nodes. Expression of the β1-Nav-GFP transgene did not detectably influence the degree of double innervation (WT, 11 ± 1% vs. β1-Nav-GFP, 14 ± 2%; n = 3 mice per genotype, ≥102 axons; P = 0.7, Mann–Whitney test; axons per animal) or myelination on terminal axon branches at P9 (winner branches: WT, 38 ± 8% vs. β1-Nav-GFP, 30 ± 4%; competing branches: WT, 19 ± 3% vs. β1-Nav-GFP, 11 ± 6%; P > 0.4, Mann–Whitney test; n = 3 mice per genotype, ≥31 axons per animal). din, competing axons; sin, winner axons. Scale bars represent 10 µm (A–D, overview) and 2 µm (insets).
Figure 2.
Figure 2.
Nodes on competing branches are immature compared with those on winner branches. (A) Live image of motor axons in P11 Thy1-Caspr-GFP (green) × Thy1-OFP3 (axon, white) nerve-muscle explant; dashed boxes indicate location of control (Ctrl) and photobleached (FRAP) nodes. Images on the right are taken before, directly after photobleaching, and 3 h later. Fire lookup table on the right. (B) Quantification of Caspr-GFP recovery rate comparing winner branches (sin) of different developmental ages (6 wk vs. P9–P11) and different competition status at the same developmental age (P9–P11 sin, din, stem; n ≥ 13 axons, ≥10 mice per group). (C) Live image of axon branches in P11 Thy1-β1-Nav-GFP (red) × Thy1-OFP3 (axon, white) nerve-muscle explant; dashed boxes and images on right as in A. (D) Quantification of β1-Nav-GFP recovery rate as in B (n ≥ 9 axons, ≥5 mice per group). din, doubly innervating competing branch; sin, singly innervating winner branch. Data represent mean + SEM. *, P < 0.05; **, P < 0.01; ****, P < 0.0001; Mann–Whitney test; outliers identified with Tukey’s test. Scale bars, 10 µm (A and C, overview) and 2 µm (insets).
Figure 3.
Figure 3.
Myelination of competing branches neither biases competition nor reflects axon diameter. (A) Image of a fixed triangularis sterni muscle of a ChAT-IRES-Cre × Thy1-Brainbow-1.1 mouse. Motor units labeled with distinct fluorescence (axon, orange and white) and immunostained for Caspr (green); arrowheads point to competing branches, and asterisk marks a pruning axon. Inset shows enlarged dashed box with emerging dotty and more mature paranodal structures. (B) Quantification of Caspr immunostaining versus synaptic territory of competing branches (n ≥ 78 axons per group from a total of 69 mice). (C) Graph of measured myelination patterns on paired competing branches versus the calculated distribution assuming random myelin initiation. Winner is an axon branch ≤50% territory, while loser is ≥50% territory. (D) Quantification of an axon’s diameter versus its synaptic territory in axon branches either with (green) or without Caspr immunostaining (gray; n v 10 axons, v7 mice per group). (E) Quantification of the diameter of stretches on retreating axons with (magenta) or without MPZ-immunostaining (gray; n v 8 axons, ≥4 mice per group). (F and G) Images of Thy1-XFP terminal branches (axons, white) stained for Caspr (green) and MPZ (magenta). Schematics to the right depict a myelinated winning branch (black) versus a pruning axon (gray; star) without nodes (F) and a rare example of a myelinated retreating branch (gray; star) and its winning MPZ- and Caspr-negative competitor (black; G). rebu, retraction bulbs; sin, winner axons; (un)myel., (un)myelinated. Data represent mean ± SEM. **, P < 0.01; ***, P < 0.001, Mann–Whitney test. Scale bars, 10 µm (A, F, and G).
Figure 4.
Figure 4.
Neurotransmission and spastin differentially affect myelination and microtubular mass. (A) Schematic of experimental design. Thy1-YFP16 mice were unilaterally injected with BTX (“BTX inj”, orange) into the thoracic wall at P7, resulting in local blockade of AChRs. Fixed ipsi- and contralateral muscles are post hoc stained at P9 with BTX (blue) and immunostained for Caspr (green). (B and C) Contralateral control muscle (B) and ipsilateral BTX-injected muscle (C) showing axons (Thy1-YFP16, white), Caspr immunostaining (green), post hoc stained BTX (blue), and injected BTX (orange). Schematics below depict motor neurons (gray) and Caspr paranodes (green); arrowheads point to two competing axons leading to the same NMJ. (D) Quantification of doubly innervated NMJs at P9 following BTX injection (n = 8 mice, ≥50 axons per animal). (E) Quantification of Caspr-positive competing (din) and winner (sin) axon branches from BTX-injected muscles versus controls (n ≥ 5 mice, ≥32 axons per side of animal). (F) Images of competing (din) and winner (sin) terminal branches following BTX injection (orange) and post hoc staining at P9 with BTX (blue) and βIII-tubulin (white). (G) Quantification of βIII-tubulin intensity (x-fold normalized to Thy1-YFP16; n ≥ 5 mice, n ≥ 20 axons per side of animal). (H and I) P9 triangularis sterni muscle of littermate WT (H) and spastin KO (I) mice. Axons immunostained for Caspr (green) and βIII-tubulin (white). Corresponding schematics below show axons (gray) and Caspr-positive paranodes (green). Arrowheads point to two axons innervating the same NMJ. (J) Quantification of doubly innervated NMJs in P9 spastin KO animals compared with WT littermates (n ≥ 5 mice, n ≥ 70 axons per animal). (K) Quantification of Caspr-positive terminal branches in P9 spastin KO compared with WT littermates (n ≥ 7 mice, n ≥ 33 axons per animal). (L) Images of competing (din) and winner (sin) terminal branches in spastin WT and KO littermates, immunostained for βIII-tubulin (white). (M) Quantification of βIII-tubulin intensity (x-fold normalized to Thy1-YFP16) in spastin KO versus WT littermates (n ≥ 5 mice, n ≥ 13 axons per animal). din, competing axons; sin, winner axons. Data represent mean + SEM. Mann–Whitney test. *, P < 0.05; **, P < 0.01. Scale bars represent 10 µm (B, C, H, and I) and 5 µm (F and L).
Figure S2.
Figure S2.
Innervation and myelination status correlate with axonal tubulin content and SC length. (A) Images of SCs on singly innervating terminal branches in a Plp-GFP (green) mouse following BTX injection on P7 versus contralateral control side and post hoc staining at P9 with βIII-tubulin (white). Schematics to the right depict measured terminal axon length (gray) and SC outline with cell nuclei marked with asterisks. (B–D) Quantification of SC length (B), terminal branch length (C), and SC number (D) along singly innervating branches, showing no significant difference after BTX treatment in P9 Plp-GFP mice injected with BTX versus control (≥10 axons per animal in n = 5 mice). (E and F) Quantification of axonal SC length (E; din, 30 ± 2 µm; sin, 24 ± 1 µm) and terminal branch length (F; din, 50 ± 4 µm; sin, 54 ± 5 µm; ≥16 axons per animal in n = 5 mice). (G) Images of competing (din) and winner (sin) terminal branches in P9 Thy1-YFP16 mice, without or with emerging Caspr paranodes (green) and stained βIII-tubulin (white). (H) Quantification of βIII-tubulin intensity (x-fold normalized to Thy1-YFP16; Caspr negative, n ≥ 18 axons per group in n = 3 mice). din, competing axons; sin, winner axons. Data represent mean + SEM. *, P < 0.05; **, P < 0.01; ***, P < 0.001; ns., not significant; Mann–Whitney test. Outlier determined by Tukey test. Scale bar, 10 µm (A and G).
Figure S3.
Figure S3.
AAV9-mediated spastin deletion promotes myelination on competing branches. (A) Schematic of experimental design. AAV9-CMV-iCre was injected at P2 into the third ventricle of spastinfl/fl × TdTomato reporter mice. Muscles were analyzed at P9. (B) Image of P9 muscle immunostained for Caspr (green) and βIII-tubulin (white). iCre-mediated deletion resulted in TdTomato-positive axons (red), presumed to lack spastin. Schematic on the right depicts TdTomato-positive (red) and negative motor units (gray) and Caspr paranodes (green). Arrowheads point to competing axons leading to the same NMJ. (C) Quantification of Caspr immunostaining on TdTomato-negative and positive terminal branches at P9 (n ≥ 3 mice per group, n ≥ 15 axons per mouse). (D) Quantification of axon diameter of TdTomato-negative and positive terminal branches at P9 (n ≥ 10 axons per group, n = 5 mice). (E) Schematic of experimental design. AAV9-CMV-iCre was injected at P2 into the third ventricle of Nrg1 type IIIfl/fl × TdTomato reporter mice. Muscles were analyzed at P9. (F) Image of P9 muscle immunostained for Caspr (green) and βIII-tubulin (white). iCre-mediated deletion resulted in TdTomato-positive axons (red), presumed to lack Nrg1. Schematic on the right depicts TdTomato-positive (red) and negative motor units (gray) and Caspr paranodes (green). Arrowheads point to two axons leading to the same NMJ. (G) Quantification of doubly innervated NMJs on TdTomato-negative and positive terminal branches at P9 (n = 4 mice per group, ≥97 axons per animal). (H) Quantification of Caspr immunostaining on TdTomato-negative and positive terminal branches at P9 (n = 4 mice per group, ≥29 axons per animal). din, competing axons; sin, winner axons. Data represent mean + SEM. *, P < 0.05; n.s., not significant; Mann–Whitney test. Outlier determined by Tukey test. Scale bar, 10 µm (B and F).
Figure S4.
Figure S4.
Microtubule-dependent axonal transport affects myelination onset. (A–D) Whole-mount immunohistochemical staining against α-tub (white) to label axons in Tg(mbp:RFP) (magenta) transgenic zebrafish larvae injected with cntn1b:GFP as control (A and B) and cntn1b:GFP-KHC-CBD (C and D). Dashed boxes in A and C are enlarged in B and D showing mbp:RFP only. (E) Example of an individual cntn1b:GFP-KHC-CBD–labeled motor neuron (yellow) and its myelination (magenta). Solid arrowheads point to ends of myelin sheaths; empty arrowhead points to extend of myelination along KHC-CBD–expressing axons compared with control axons in the adjacent somite (unlabeled). (F) Length of spinal motor axons, measured between the branching-off point at the spinal cord to the axon tip (n = 7 zebrafish per group, n ≥ 29 axons per animal). (G) Progress of myelination expressed as percentage of mbp:RFP-positive axon length (n = 7 zebrafish per group, n ≥ 29 axons per animal). Data represent mean + SEM. ***, P < 0.001, Mann–Whitney test. Scale bar, 50 µm (A–E).
Figure 5.
Figure 5.
Axonal transport limits myelination onset in terminal motor axon branches. (A) Schematic of experimental design. AAV9-hSyn-iCre-p2a-KHC-CBD was injected at P2 into the third ventricle of YFP reporter mice. Muscles were analyzed at P9. (B) Quantification of axonal GFP particle transport in β1-Nav-GFP animals (n ≥ 5 mice per group, n ≥ 16 axons). (C) Image of AAV9-hSyn-iCre-p2a-KHC-CBD-injected P9 triangularis sterni muscle of a YFP reporter mouse immunostained for Caspr (green) and βIII-tubulin (white). KHC-CBD is overexpressed in iCre-induced recombined YFP reporter–positive axons (red). Schematic on the right depicts YFP-positive (red) and YFP-negative motor units (gray) and Caspr paranodes (green). (D) Quantification of Caspr immunostaining on YFP-negative and YFP-positive terminal axon branches at P9 (n ≥ 5 mice per group, n ≥ 39 axons per mouse). din, competing axons; sin, winner axons. Data represent mean + SEM. *, P < 0.05; **, P < 0.01; ****, P < 0.0001; Mann–Whitney test. Outlier determined by Tukey test. Scale bar, 20 µm (C).
Figure 6.
Figure 6.
Nrg1 type III transgenic mice show premature myelination initiation. (A and B) P9 spinal cord of WT control (A) and Thy1-Nrg1 type III-HA (B) littermates. Sections stained for HA-tag (red) and neurotrace (cyan). Dashed boxes enlarged on the right show magnified single channels of neurotrace (cyan) and HA staining (red). (C and D) Confocal images of P9 triangularis sterni muscles from WT (C) and Thy1-Nrg1 type III-HA littermates (D) immunostained for βIII-tubulin (white) and Caspr (green). Schematics below show motor neurons (gray) and Caspr paranodes (green). Arrowheads point to two axons leading to the same NMJ. (E and F) Quantification of the percentage of doubly innervated NMJs (E) and Caspr-positive terminal branches (F) in P7 and P9 WT versus transgenic Thy1-Nrg1 type III littermates (E, n ≥ 3 mice per genotype, ≥99 axons per animal; F, n ≥ 3 mice per genotype, ≥40 axons per animal). din, competing axons; sin, winner axons. Data represent mean + SEM. *, P < 0.05; **, P < 0.01; Mann–Whitney test. Scale bars, 10 µm (A–D).
Figure 7.
Figure 7.
Nrg1 type III is more concentrated on singly innervating terminal branches. (A and B) Plp-GFP × Thy1-Nrg1 type III-HA mouse immunostained for neurofilament (NF; white) in P9 triangularis sterni muscle. A projected overview of competing (din) versus winner branches (sin); dashed boxes enlarged in B show magnified single optical sections of HA staining (red) with GFP-labeled SCs (green). (C) Quantification of HA staining on doubly versus singly innervating branches in Thy1-Nrg1 type III animals (n = 8 mice per genotype, ≥13 axons per animal). (D and E) Plp-GFP × Thy1-Nrg1 type III-HA mice immunostained for βIII-tubulin (white) in P9 triangularis sterni muscle. A projected overview (D) of competing (din) versus winner branches (sin); dashed boxes enlarged in E show magnified single optical sections of pERK staining (magenta) with GFP-labeled SCs (green). (F) Quantification of pERK staining around doubly versus singly innervating branches in Thy1-Nrg1 type III animals (n = 5 mice per genotype, ≥20 axons per animal). (G) Quantification of pAKT immunostaining around doubly versus singly innervating branches in Thy1-Nrg1 type III animals, normalized to singly innervating branches (≥20 axons per group in n = 5 mice). (H) Quantification of HA signal in singly innervating axons in BTX-injected triangularis sterni muscle versus uninjected control side (≥13 axons per group in n = 6 mice). (I) Quantification of pERK signal in SCs surrounding singly innervating axons in BTX-injected triangularis sterni muscle versus uninjected control side (≥36 axons per group in n = 5 mice). (J) BTX intensity measured in WT and Thy1-Nrg1 type III transgenic animals (WT, 698 ± 67 arbitrary units [A.U.], Thy1-Nrg1 type III, 747 ± 43 A.U.; n ≥ 16 NMJ per animal, n ≥ 5 mice per group). (K) Area of BTX-stained endplate measured in WT and Thy1-Nrg1 type III transgenic animals (WT, 195 ± 13 μm2; Thy1-Nrg1 type III, 203 ± 22 μm2; n ≥ 16 NMJ per animal, n ≥ 5 mice per group). (L) Quantification of the proportions of NMJ morphology, categorized into “broken,” “holes,” and “plaque” (n ≥ 5 mice per group, ≥14 NMJ per animal). din, competing axons; sin, winner axons. Data represent mean + SEM. *, P < 0.05; **, P < 0.01; Mann–Whitney test. Scale bars represent 10 µm (A and D) and 5 µm (B and E).

Comment in

  • Lose it to use it.
    Haddix SG, Rasband MN. Haddix SG, et al. J Cell Biol. 2021 Apr 5;220(4):e202102030. doi: 10.1083/jcb.202102030. J Cell Biol. 2021. PMID: 33734302 Free PMC article.

References

    1. Akaaboune, M., Culican S.M., Turney S.G., and Lichtman J.W.. 1999. Rapid and reversible effects of activity on acetylcholine receptor density at the neuromuscular junction in vivo. Science. 286:503–507. 10.1126/science.286.5439.503 - DOI - PubMed
    1. Auer, F., Vagionitis S., and Czopka T.. 2018. Evidence for myelin sheath remodeling in the CNS revealed by in vivo imaging. Curr. Biol. 28:549–559.e3. 10.1016/j.cub.2018.01.017 - DOI - PubMed
    1. Bacmeister, C.M., Barr H.J., McClain C.R., Thornton M.A., Nettles D., Welle C.G., and Hughes E.G.. 2020. Motor learning promotes remyelination via new and surviving oligodendrocytes. Nat. Neurosci. 23:819–831. 10.1038/s41593-020-0637-3 - DOI - PMC - PubMed
    1. Barres, B.A. 2008. The mystery and magic of glia: a perspective on their roles in health and disease. Neuron. 60:430–440. 10.1016/j.neuron.2008.10.013 - DOI - PubMed
    1. Barry, J., Gu Y., Jukkola P., O’Neill B., Gu H., Mohler P.J., Rajamani K.T., and Gu C.. 2014. Ankyrin-G directly binds to kinesin-1 to transport voltage-gated Na+ channels into axons. Dev. Cell. 28:117–131. 10.1016/j.devcel.2013.11.023 - DOI - PMC - PubMed

Publication types