. 2021 Feb 3;13(5):7035-7051.
doi: 10.18632/aging.202558. Epub 2021 Feb 3.

ENAM gene associated with T classification and inhibits proliferation in renal clear cell carcinoma

Affiliations

ENAM gene associated with T classification and inhibits proliferation in renal clear cell carcinoma

Xiaohan Ren et al. Aging (Albany NY). .

Abstract

The potential involvement of T classification-related genes in renal clear cell carcinoma (ccRCC) must be further explored. Public data were obtained from The Cancer Genome Atlas (TCGA) database. An overall survival (OS) predictive model was developed and validated (TCGA train, 5 years, AUC = 0.73, 3 years, AUC = 0.73, 1 year, AUC = 0.76; TCGA test, 5 years, AUC = 0.74, 3 years, AUC = 0.65, 1 year, AUC = 0.73; TCGA all, 5 years, AUC = 0.72, 3 years, AUC = 0.71, 1 year, AUC = 0.75). Finally, ENAM was selected for further analysis. In vitro experiment indicated that ENMA is downregulated in ccRCC, and its knockdown could promote proliferation in two cancer cell lines (OSRC-2 and SW839). Immune infiltration analysis revealed that ENAM could remarkably increase the content of cytotoxic cells, NK CD56 cells, NK cells and CD8+ T cells in the tumor immune microenvironment, which may be one reason for its tumor-inhibiting effect. In summary, ENAM may suppress cell proliferation in ccRCC and can be used as a potential reference value for the relief and immunotherapy of ccRCC.

Keywords: ENAM; T classification; renal cell carcinoma.


Conflict of interest statement

CONFLICTS OF INTEREST: The authors declare that they have no conflicts of interest.

Figures

Figure 1
Figure 1
Identification of DEGs between high and low T classification, PPI network and enrichment analysis. (A) The volcano plot of TCGA; (B) PPI network of all DEGs; (C) Top 20 nodes in PPI network; (D) GO enrichment analysis of all DEGs; (E) KEGG enrichment analysis of all DEGs. Abbreviations: TCGA, The Cancer Genome Atlas; GEO, Gene Expression Omnibus; DEGs, Differentially expressed genes; PPI, protein-protein interaction; GO, Gene oncology; KEGG, Kyoto Encyclopedia of Genes and Genomes.
Figure 2
Figure 2
Identification of modules associated with the T classification in the TCGA-KIRC dataset. (A) Module-trait relationships. Each row corresponds to a color module and column corresponds to a clinical trait. Each cell contains the corresponding correlation and P-value; (B) The scale independence and mean connectivity; (C) The purple module genes and their GO analysis in ClueGO; (D) The yellow module genes and their GO analysis in ClueGO; (E) The venn plot of yellow module genes, purple module genes and DEGs.
Figure 3
Figure 3
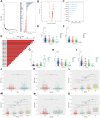
Construction of the prognosis model based on the T classification related genes. (A) Error rate for the data as a function of the classification tree and out-of-bag importance values all the predictors; (B) Volcano plot displayed the genes of the univariate Cox regression analysis; (C) Random survival forest analysis screened 10 genes; (D) After Kaplan–Meier analysis of 2 –1 = 1,023 combinations, the top 20 signatures were sorted according to the p value of KM. And the signature included five genes that were screened out, for it had a relative big −log10 p value and a small number of genes; (E) The association between WDR72 expression with T classification; (F) The association between ENAM expression with T classification; (G) The association between GFPT2 expression with T classification; (H) The association between SOWAHB expression with T classification; (I) The association between C1orf210 expression with T classification; (J) The correlation between risk scores and age; (K) The correlation between risk scores and gender; (L) The correlation between risk scores and grade; (M) The correlation between risk scores and stage; (N) The correlation between risk scores and Mstage; (O) The correlation between risk scores and Tstage.
Figure 4
Figure 4
The evaluation of the model and the nomogram plot. (A) The risk plot of OS predictive model in TCGA-KIRC; (B) The ROC curve and Kaplan-Meier survival curves of TCGA-train group; (C) The ROC curve and Kaplan-Meier survival curves of TCGA-test group; (D) The ROC curve and Kaplan-Meier survival curves of TCGA group; (E) The nomogram plot; (F) The calibrations of 1, 3, 5 years; (G) The ROC curves of nomogram plot; (H) The GSEA analysis of high risk patients; (I) The venn plot of model genes and top 20 nodes in PPI; (J) The ROC curves of ENAM with best cutoff. Abbreviations: PPI: Protein-protein interaction.
Figure 5
Figure 5
Enrichment analysis and immune infiltration of ENAM. (A) GSEA analysis of ENAM; (B) GSVA analysis of ENAM; (C) The association between KIF20A and 24 immune cells calculated by ssGSEA.
Figure 6
Figure 6
ENAM is down-regulated in ccRCC. (A) Expression of ENAM was down-regulated in 72 paired tumor compared with paratumor samples in TCGA; (B) Expression of ENAM was frequently down-regulated in 50 ccRCC tumor tissue; (C) ENAM protein expression in HK-2, OSRC-2, SW839, Caki-1 and A498 cell lines; (D) qPCR of indicated cells transfected with ENAM-vector and ENAM; (E) Western blotting of indicated cells transfected with ENAM-vector and ENAM. Abbreviations: NS: P>0.05; *: P<0.05; **: P<0.01; ***: P<0.001.
Figure 7
Figure 7
ENAM regulates the proliferation of renal cancer cells. (A, B) Upregulation of ENAM significantly increased the expression of Bax and Cas3, yet decreased the expression of Bcl-2; (C) Upregulation of ENAM reduced the mean colony number in the colony formation assay; (D) MTT assays revealed that upregulation of ENAM significantly reduced the cell viability. Abbreviations: NS: P>0.05; *: P<0.05; **: P<0.01; ***: P<0.001.

References

    1. Bray F, Ferlay J, Soerjomataram I, Siegel RL, Torre LA, Jemal A. Global cancer statistics 2018: GLOBOCAN estimates of incidence and mortality worldwide for 36 cancers in 185 countries. CA Cancer J Clin. 2018; 68:394–424. 10.3322/caac.214920 - DOI - PubMed
    1. Lopez-Beltran A, Scarpelli M, Montironi R, Kirkali Z. 2004 WHO classification of the renal tumors of the adults. Eur Urol. 2006; 49:798–805. 10.1016/j.eururo.2005.11.035 - DOI - PubMed
    1. Moch H, Cubilla AL, Humphrey PA, Reuter VE, Ulbright TM. The 2016 WHO classification of tumours of the urinary system and male genital organs-part A: renal, penile, and testicular tumours. Eur Urol. 2016; 70:93–105. 10.1016/j.eururo.2016.02.029 - DOI - PubMed
    1. Gremel G, Djureinovic D, Niinivirta M, Laird A, Ljungqvist O, Johannesson H, Bergman J, Edqvist PH, Navani S, Khan N, Patil T, Sivertsson Å, Uhlén M, et al.. A systematic search strategy identifies cubilin as independent prognostic marker for renal cell carcinoma. BMC Cancer. 2017; 17:9. 10.1186/s12885-016-3030-6 - DOI - PMC - PubMed
    1. Stower H. Tracing clear cell renal carcinoma evolution. Nat Med. 2018; 24:702. 10.1038/s41591-018-0074-y - DOI - PubMed

Publication types

MeSH terms