. 2021 Feb 4;16(2):e0245976.
doi: 10.1371/journal.pone.0245976. eCollection 2021.

SLAM-based augmented reality for the assessment of short-term spatial memory. A comparative study of visual versus tactile stimuli

Affiliations

SLAM-based augmented reality for the assessment of short-term spatial memory. A comparative study of visual versus tactile stimuli

Francisco Munoz-Montoya et al. PLoS One. .

Abstract

The assessment of human spatial short-term memory has mainly been performed using visual stimuli and less frequently using auditory stimuli. This paper presents a framework for the development of SLAM-based Augmented Reality applications for the assessment of spatial memory. An AR mobile application was developed for this type of assessment involving visual and tactile stimuli by using our framework. The task to be carried out with the AR application is divided into two phases: 1) a learning phase, in which participants physically walk around a room and have to remember the location of simple geometrical shapes; and 2) an evaluation phase, in which the participants are asked to recall the location of the shapes. A study for comparing the performance outcomes using visual and tactile stimuli was carried out. Fifty-three participants performed the task using the two conditions (Tactile vs Visual), but with more than two months of difference (within-subject design). The number of shapes placed correctly was similar for both conditions. However, the group that used the tactile stimulus spent significantly more time completing the task and required significantly more attempts. The performance outcomes were independent of gender. Some significant correlations among variables related to the performance outcomes and other tests were found. The following significant correlations among variables related to the performance outcomes using visual stimuli and the participants' subjective variables were also found: 1) the greater the number of correctly placed shapes, the greater the perceived competence; 2) the more attempts required, the less the perceived competence. We also found that perceived enjoyment was higher when a higher sense of presence was induced. Our results suggest that tactile stimuli are valid stimuli to exploit for the assessment of the ability to memorize spatial-tactile associations, but that the ability to memorize spatial-visual associations is dominant. Our results also show that gender does not affect these types of memory tasks.


Conflict of interest statement

The authors have declared that no competing interests exist.

Figures

Fig 1
Fig 1. Configuration phase.
(A) and (B) room scanning phase. (C) Shape configuration phase (an example of the supervisor placing a pyramid in the real scanned room).
Fig 2
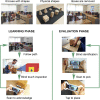
Fig 2. The steps followed by the users in the visual condition.
The study with the visual condition is performed in two phases: learning and evaluation. During the learning phase, the subject has to follow a predefined path, searching for the eight virtual shapes placed on the desks in the room. When a shape is found, the subject acknowledges it by tapping the screen. In the evaluation phase, subjects are requested to place each of the eight virtual shapes in its original location. Subjects have three attempts to place each shape.
Fig 3
Fig 3. Materials used in the tactile condition.
(A) Physical geometrical shapes used in our study. (B) Box used in the learning and evaluation phases of the tactile condition. (C) An example of the AR application for scanning the barcode. (D) An example of a participant placing a virtual box in the evaluation phase using the AR application.
Fig 4
Fig 4. The steps followed by the users in the tactile condition.
The study with the tactile condition is performed in two phases: learning and evaluation. During the learning phase, the subject has to follow a predefined path with eight physical boxes. Each box has a different geometrical shape inside. For each box, the subject has to inspect the shape inside by touch through two holes in the sides of the box. Then, the AR application is used to scan the barcode and to store a timestamp of the moment that the shape was examined. In the evaluation phase, the boxes are removed from their initial position and shown to the subject one by one. After inspecting its shape, the subject has to place a virtual box with the AR application in the position where the shape was located during the learning phase. The subjects have three attempts to place the virtual box correctly.
Fig 5
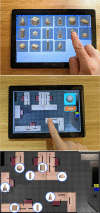
Fig 5. Other applications and a schematic top view of the room used.
(A) Shape-recognition application for selecting geometrical shapes. (B) Map-pointing application used in the visual condition to place the geometrical shapes. (C) Schematic top view of the room and the location of the eight virtual geometrical shapes.
Fig 6
Fig 6. Architecture of our SLAM-based AR framework.
Fig 7
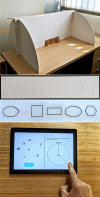
Fig 7. Tests used as inclusion criteria.
(A) Structure to prevent the participant from seeing the items used in the battery of haptic tests. (B) An example of one item included in the shape discrimination test (printed using ABS white material). (C) An example of one shape discrimination item included in the swell paper test. (D) An example of a user interacting with the PTSOT application.
Fig 8
Fig 8. Box plots for the performance outcome variables and for the tactile and visual conditions.
(A) Total number of shapes placed correctly (LocShapes variable). (B) Total number of attempts required to correctly place the shapes (AttemptS variable). (C) Total time in seconds required to complete the learning phase (TTimeL variable). (D) Total time in seconds required to complete the evaluation phase (TTimeE variable).
Fig 9
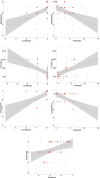
Fig 9. Scatter plots for significant correlations for the visual condition (n = 47).
(A) Scatter plot for the total number of shapes placed correctly (LocShapes variable) and the score obtained in the map-pointing task (MapShapes variable). (B) Scatter plot for the total number of attempts to place the shapes correctly (AttemptS variable) and the score obtained in the map-pointing task (MapShapes variable). (C) Scatter plot for the total number of shapes placed correctly (LocShapes variable) and the time spent in the evaluation phase (TTimeE). (D) Scatter plot for the total number of attempts to place the shapes correctly (AttemptS variable) and the time spent in the evaluation phase (TTimeE). (E) Scatter plot for the total number of shapes placed correctly (LocShapes variable) and the perceived competence variable. (F) Scatter plot for the total number of attempts to place the shapes correctly (AttemptS variable) and the perceived competence variable. (G) Scatter plot for the presence and enjoyment variables. Three sizes of circles appear in the plots that represent a low number of occurrences, an intermediate number of occurrences, and a high number of occurrences. The dashed red lines are best fitting linear regression lines. In panels C, D and G close values were grouped for clearer visualization. The grey area represents a 95% confidence level interval for predictions from a linear model.

Similar articles

Cited by

References

    1. Baddeley A. Working memory. Science (80-). 1992;255: 556–559. 10.1126/science.1736359 - DOI - PubMed
    1. Pearson J, Kosslyn SM. The heterogeneity of mental representation: Ending the imagery debate. Proc Natl Acad Sci. 2015;112: 10089–10092. 10.1073/pnas.1504933112 - DOI - PMC - PubMed
    1. Setti W, Cuturi LF, Cocchi E, Gori M. A novel paradigm to study spatial memory skills in blind individuals through the auditory modality. Sci Rep. 2018;8: 13393 10.1038/s41598-018-31588-y - DOI - PMC - PubMed
    1. Bizley JK, King AJ. Visual-auditory spatial processing in auditory cortical neurons. Brain Res. 2008;1242: 24–36. 10.1016/j.brainres.2008.02.087 - DOI - PMC - PubMed
    1. Yamamoto N, Shelton AL. Orientation dependence of spatial memory acquired from auditory experience. Psychon Bull Rev. 2009;16: 301–305. 10.3758/PBR.16.2.301 - DOI - PubMed

Publication types