. 2021 Feb 4;16(2):e0246569.
doi: 10.1371/journal.pone.0246569. eCollection 2021.

The feeding microstructure of male and female mice

Affiliations

The feeding microstructure of male and female mice

Yakshkumar Dilipbhai Rathod et al. PLoS One. .

Abstract

The feeding pattern and control of energy intake in mice housed in groups are poorly understood. Here, we determined and quantified the normal feeding microstructure of social male and female mice of the C57BL/6J genetic background fed a chow diet. Mice at 10w, 20w and 30w of age showed the expected increase in lean and fat mass, being the latter more pronounced and variable in males than in females. Under ad libitum conditions, 20w and 30w old females housed in groups showed significantly increased daily energy intake when adjusted to body weight relative to age-matched males. This was the combined result of small increases in energy intake during the nocturnal and diurnal photoperiods of the day without major changes in the circadian pattern of energy intake or spontaneous ambulatory activity. The analysis of the feeding microstructure suggests sex- and age-related contributions of meal size, meal frequency and intermeal interval to the control of energy intake under stable energy balance, but not under negative energy balance imposed by prolonged fasting. During the night, 10-20w old females ate less frequently bigger meals and spent more time eating them resulting in reduced net energy intake relative to age-matched males. In addition, male and female mice at all ages tested significantly shortened the intermeal interval during the first hours of re-feeding in response to fasting without affecting meal size. Further, 20-30w old males lengthened their intermeal interval as re-feeding time increased to reach fed-levels faster than age-matched females. Collectively, our results suggest that the physiological mechanisms controlling meal size (satiation) and the non-eating time spent between meals (satiety) during stable or negative energy balance are regulated in a sex- and age-dependent manner in social mice.


Conflict of interest statement

The authors have declared that no competing interests exist.

Figures

Fig 1
Fig 1. Body mass accrual and body composition of normal mice housed in groups.
A. Weekly body mass in grams (g) of mice fed ad libitum a chow diet from weaning (post-natal day 19–20) to 35 weeks of age. Body mass is significantly higher in males than females from week 5 (n = 10, dm = 4.14 ± 0.89g, *p<0.001) and thereafter. B. Absolute lean mass of male and female mice at 10w, 20w and 30w of age (*p<0.01 sex; p<0.001 10w age; F(2,84) = 0.79, p = 0.45). C. Absolute fat mass of 10w, 20w and 30w old male and female mice (*p<0.001 sex; p<0.001 vs. 10w old, F(2,77) = 8.73, p<0.001). D. Lean mass of male and female mice at 10w, 20w and 30w of age relative to their mean body mass (*p<0.05 sex; p<0.05 vs. 10w old, F(2,84) = 4.73, p<0.05). E. Fat mass relative to mean body mass of 10w, 20w and 30w old male and female mice (*p<0.05 sex; p<0.05 vs. 10w old, F(4,137) = 9.25, p<0.001). F. Absolute fat mass (C) to absolute lean mass (B) ratio of male and female mice (*p<0.01 sex; p<0.05 vs. 10w old mice, F(2,83) = 4.38, p<0.05).
Fig 2
Fig 2. Daily energy intake and ambulatory activity of normal mice housed in groups.
A. Daily energy intake of 10w, 20w and 30w old males and females. Intake was continuously computed during 14 days in mice fed ad libitum of a chow diet (3.0 kCal/g). Results are expressed as the mean ± SEM after adjusting to the mean BW recorded during the same period of time (n = 10, *p<0.05 sex; p<0.05 vs. 10w old mice, F(14,183) = 1.79, p<0.05). B. Mean adjusted nocturnal and diurnal energy intake of group-housed mice at 10w, 20w and 30w of age (n = 10, *p<0.05 sex, F(14,183) = 1.79, p<0.05). C. Circadian variation and cosinor analysis of adjusted energy intake in males and females of the indicated ages continuously computed in bins of 60min during 14 days of ad libitum feeding. Data for cosinor analysis is shown in Table 1. D. Circadian variation and cosinor analysis of net random ambulatory activity of mice of the indicated sexes and ages. Data represents the mean ± SEM of daily activity recorded throughout the course of 14 days of ad libitum feeding.
Fig 3
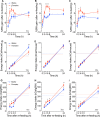
Fig 3. Body mass and energy intake responses of group-housed mice to fasting.
A-C. Shown are BW accrual relative to baseline i.e., BW before fasting (dashed lines), recorded at the indicated times after allowing re-feeding of 16hs fasted males and female mice at 10w (A), 20w (B) and 30w (C) of age. Results are expressed as the mean ± SEM (n = 10, *p<0.05 sex; p<0.01 vs. baseline, F(42,366) = 4.54, p<0.001). D-F. Net energy intake of 16hs fasted mice of both sexes at 10w (D), 20w (E) and 30w (F) of age recorded at the indicated time-points after allowing re-feeding. Results represent mean values ± SEM relative to the net daily energy intake obtained during the fed condition (baseline, dashed lines). G-I. Energy intake adjusted to BW at the indicated time-points after allowing re-feeding of 16hs fated mice of both sexes at 10w (G), 20w (H) and 30w (I) of age. Results are presented as mean values ± SEM. Dashed lines represents daily adjusted energy intake in the fed state [n = 10, *p<0.01 sex; p<0.01 vs. baseline intake, F(28,305) = 3.02, p<0.001].
Fig 4
Fig 4. Feed and metabolic efficiency of group-housed mice in responses to fasting.
A-C. Feed efficiency (FE), calculated as the ratio between the changes in body weight (ΔBW) and the net energy intake (ΔkCal) recorded at the indicated times after allowing re-feeding in 16hs fasted male and female mice at 10w (A), 20w (B) and 30w (C) of age. D-F. Metabolic efficiency (ME) calculated as the inverse of FE at the indicated times after allowing re-feeding of 16hs fasted male and female mice of 10w (D), 20w (E) and 30w (F) of age. Results represent the mean ± SEM (n = 10, *p<0.05 males vs. females).
Fig 5
Fig 5. The feeding microstructure of group-housed mice and its definitions.
A. Schematization of the feeding microstructure of mice. Represented are feeding bouts (FBs, filled squares) clustered in meals separated from each other by a non-eating intermeal interval (IMI) of equal or longer duration than a minimum IMI threshold (IMIt). B. Determination of the minimum rate of meal size (MS) change (Cal/sec) as a function of increasing intermeal intervals (IMI, sec) in 20w old male mice housed in groups (n = 10) and fed ad libitum undisturbed for 7 consecutive days. Data are expressed as the mean ± SEM. The minimum value is indicated as a red dot (IMIt = 300sec). C-F. Validation of the IMIt to indicate changes in meal frequency (C-D) and meal size (E-F) in male (C, E) and female (D, F) mice fed undisturbed a chow diet for 7 days. Shown are data corresponding to the nocturnal photoperiod of the day. The number of meals and meal size were determined as a function of increasing IMI (min) to visualize if the IMIt (5min) distinguishes changes in their rate of change. As shown, IMIt ≥5mins serve as a threshold to mathematically define a meal in 10w, 20w and 30w old male and female mice housed in groups.
Fig 6
Fig 6. The feeding microstructure of social mice feed ad libitum.
A-F. Shown are the meal size [A, kCal, (n = 10, *p<0.05 sex; p<0.05 age; °p<0.05 phase, F(14,183) = 2.01, p<0.05)], number of meals [B, counts per mouse, (n = 10, *p<0.05 sex, F(14,183) = 7.16, p<0.001)], intermeal interval [C, minutes, (n = 10, *p<0.05 sex; p<0.05 age, F(14,183) = 5.81, p<0.001)], meal duration [D, seconds, (n = 10, *p<0.05 sex; p<0.05 age; °p<0.05 phase, F(14,183) = 2.60, p<0.01)], feeding rate [E, calories per second, (n = 10, *p<0.05 sex; p<0.05 age; °p<0.05 phase, F(14,183) = 1.13, p = 0.33)] and the net energy intake calculated as the product of mean meal size and frequency [F, kCal, (n = 10, *p<0.05 sex; p<0.05 age, F(14,183) = 11.99, p<0.001)] of group-housed male and female mice at 10w, 20w and 30w of age fed ad libitum a chow diet. Data was recorded during 14 consecutive days and separated according to the two photoperiods of the day.
Fig 7
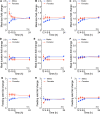
Fig 7. Meal size, meal duration and feeding rate changes in responses to fasting and re-feeding in social mice.
A-C. Meal size (kCal) recorded at the indicated times after allowing re-feeding of 16hs fasted male and female mice at 10w (A), 20w (B) and 30w (C) of age [n = 10, *p<0.05 sex; p<0.05 vs. baseline, F(28,305) = 1.64, p<0.05]. D-F. Meal duration or mean time spent in each single meal recorded at the indicated times after allowing re-feeding of 16hs fasted mice of both sexes at 10w (D), 20w (E) and 30w (F) weeks of age. G-I. Mean feeding rate calculated as the ratio between meal size (A-C) and meal duration (D-F) [n = 10, *p<0.05 sex, F(28,305) = 1.01, p = 0.46]. The results are expressed as mean values ± SEM relative to baseline (dashed lines) i.e., the mean daily meal size, duration or rate during the fed state.
Fig 8
Fig 8. Meal frequency and intermeal interval changes in responses to fasting and re-feeding in social mice.
A-C. Meal frequency (counts/mouse) recorded at the indicated time-points during re-feeding in 16hs fasted male and female mice of 10w (A), 20w (B) and 30w (C) of age [n = 10, *p<0.05 sex; p<0.05 vs. baseline, F(35,366) = 2.57, p<0.001]. D-F. The mean intermeal interval (min) calculated as the time difference between the moment a meal is initiated and the time at which the previous meal has ended was recorded at the indicated time-points during re-feeding of 16hs fasted male and female mice of the indicated ages [10w (A), 20w (B) and 30w (C), n = 10, *p<0.05 sex; p<0.05 vs. baseline, F(28,305) = 1.329, p = 0.128]. Results represent mean values ± SEM relative to baseline (dashed lines) i.e., mean daily number of meals per mouse and IMI during the fed state.

References

    1. Swinburn B, Sacks G, Ravussin E. Increased food energy supply is more than sufficient to explain the US epidemic of obesity. Am J Clin Nutr. 2009;90(6):1453–6. 10.3945/ajcn.2009.28595 - DOI - PubMed
    1. Ma Y, Bertone ER, Stanek EJ 3rd, Reed GW, Hebert JR, et al. Association between eating patterns and obesity in a free-living US adult population. Am J Epidemiol. 2003;158(1):85–92. 10.1093/aje/kwg117 - DOI - PubMed
    1. Jenkins DJ, Wolever TM, Vuksan V, Brighenti F, Cunnane SC, et al. Nibbling versus gorging: metabolic advantages of increased meal frequency. N Engl J Med. 1989;321(14):929–34. 10.1056/NEJM198910053211403 - DOI - PubMed
    1. Espinosa-Carrasco J, Burokas A, Fructuoso M, Erb I, Martin-Garcia E, et al. Time-course and dynamics of obesity-related behavioral changes induced by energy-dense foods in mice. Addict Biol. 2018;23(2):531–43. 10.1111/adb.12595 - DOI - PubMed
    1. Livingstone MB, Pourshahidi LK. Portion size and obesity. Adv Nutr. 2014;5(6):829–34. 10.3945/an.114.007104 - DOI - PMC - PubMed

Publication types