. 2021 Jul 1;23(7):1183-1196.
doi: 10.1093/neuonc/noab016.

OLIG2 maintenance is not essential for diffuse intrinsic pontine glioma cell line growth but regulates tumor phenotypes

Affiliations

OLIG2 maintenance is not essential for diffuse intrinsic pontine glioma cell line growth but regulates tumor phenotypes

Yunfei Liao et al. Neuro Oncol. .

Abstract

Background: Diffuse intrinsic pontine glioma (DIPG) is a pediatric lethal high-grade brainstem glioma with no effective therapies. OLIG2 (oligodendrocyte transcription factor 2) was reported to be critical for the growth of a DIPG cell line CCHMC-DIPG-1. Surprisingly, we found that the CCHMC-DIPG-1 cells express little OLIG2 and exhibit a mesenchymal phenotype, which raised a question regarding the role of OLIG2 in the growth of DIPG cells.

Methods: We evaluated the function of OLIG2 in different DIPG cell lines through molecular and genetic approaches and performed transcriptomic and genomic landscape profiling including whole-genome bisulfite sequencing, RNA-seq, ATAC-seq, and ChIP-seq. shRNA-mediated knockdown and CRISPR-Cas9-mediated knockout approaches were utilized to assess OLIG2 functions in DIPG cell growth.

Results: We found that DIPG cells are phenotypically heterogeneous and exhibit the characteristics of distinct malignant gliomas including proneural, classical, and mesenchymal subtypes. OLIG2 knockdown did not impact the growth of CCHMC-DIPG-1 cells, wherein OLIG2 is epigenetically silenced. Moreover, OLIG2 deletion did not substantially impair OLIG2-expressing proneural-like DIPG growth but led to an upregulation of HIPPO-YAP1 and epidermal growth factor receptor (EGFR) signaling and a tumor phenotype shift. Targeting HIPPO-YAP1 and EGFR signaling in OLIG2-deficient DIPG cells inhibited tumor cell growth.

Conclusions: Our data indicate that OLIG2 is dispensable for DIPG growth but regulates the phenotypic switch of DIPG tumor cells. OLIG2 downregulation leads to deregulation of adaptive YAP1 and EGFR signaling. Targeting YAP1 and EGFR pathways inhibits the growth of OLIG2-deficient DIPG cells, pointing to a therapeutic potential by targeting adaptive signaling to treat DIPG tumors with nominal OLIG2 expression.

Keywords: OLIG2; YAP1 and EGFR signaling; diffuse intrinsic pontine glioma (DIPG); distinct DIPG tumor phenotypes; genomic landscapes.


Figures

Fig. 1
Fig. 1
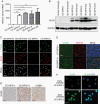
OLIG2 expression low in CC-DIPG-1 cells in vitro and in vivo. (A) qRT-PCR analysis of OLIG2 in CC-DIPG-1, DIPG-2, DIPG-IV, DIPG-VI, and DIPG-XIII cells cultured in serum-free DIPG stem cell medium. Data are presented as means ± SEM; n = 3 experiments; ***P < .001; one-way ANOVA with multiple comparisons test. (B) Western blot of OLIG2 expression in CC-DIPG-1, DIPG-2, DIPG-IV, and DIPG-XIII cells. (C) Confocal immunofluorescence microscopy images SU-DIPG-XIII, SU-DIPG-IV, CC-DIPG-1, and CC-DIPG-2 cells stained for OLIG2 (green) and SOX2 (red). (D) Immunohistochemistry analyses of xenografts of CC-DIPG-1, SU-DIPG-VI, and mGBM for expression of OLIG2. (E) Confocal immunofluorescence images of xenografts of CC-DIPG-1 and SU-DIPG-VI stained for OLIG2 (green) and NESTIN (red). (F) Confocal immunofluorescence microscopy images of CC-DIPG-1 cells and CC-DIPG-2 cells at low passage stained for OLIG2 (green). Scale bars in C-E, 50 µm; F, 25 µm. Abbreviations: DIPG, diffuse intrinsic pontine glioma; mGBM, multifocal glioblastoma; OLIG2, oligodendrocyte transcription factor 2; qRT-PCR, quantitative RT-PCR.
Fig. 2
Fig. 2
OLIG2 is epigenetically silenced in CC-DIPG-1 cells. (A) CpG methylation clustering analysis of SU-DIPG-IV, SU-DIPG-XIII, CC-DIPG-1, and CC-DIPG-2 cells. (B) Diagram showing CpG methylation signals at OLIG2, SOX2, and control gene (RPS11 and GAPDH) loci in DIPG cell lines. (C) Heatmap of signal intensities of ATAC-seq peaks in CC-DIPG-1 and CC-DIPG-2. (D) Venn diagraph of signal intensities of ATAC-seq peaks from CC-DIPG-1 and CC-DIPG-2 cells. (E) Chromatin accessibility and H3K27ac ChIP-seq profiles at OLIG2 and SOX2 loci in CC-DIPG-1 and CC-DIPG-2 cells. Abbreviations: DIPG, diffuse intrinsic pontine glioma; OLIG2, oligodendrocyte transcription factor 2.
Fig. 3
Fig. 3
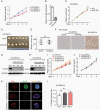
OLIG2 is not required for tumorigenesis and proliferation of DIPG cells. (A) The growth of DIPG cell lines tested by WST-1 assay. (B) qRT-PCR validation of shOLIG2-mediated OLIG2 depletion. (C) Cell growth of CC-DIPG-1 cells treated with lenti-shCtrl or shOLIG2 tested by WST-1 assay. (D) Photomicrographs of tumors formed in flanks of NSG mice implanted with CC-DIPG-1 cells transfected with lenti-shCtrl or lenti-shOLIG2. N = 6 animals/group. (E) Weights of tumors formed in flanks of NSG mice injected with CC-DIPG cells that had been transfected with lenti-shCtrl or lenti-shOLIG2. (F) Tumors stained for OLIG2 from mice injected with CC-DIPG-1 cells that had been transfected with control or lenti-shOLIG2 and from mice injected with DIPG-VI cells. (G, H) Representative western blots for OLIG2 in wild-type and OLIG2-KO SU-DIPG-IV (G) and CC-DIPG-2 (H) cells. (I, J) Cell growth of wild-type and OLIG2-KO SU-DIPG-IV (I) and CC-DIPG-2 (J) cells determined by WST-1 assay. (K, L) BrdU (K) staining and quantification (L) of wild-type and OLIG2-KO SU-DIPG-IV cell neurospheres after 2 h of BrdU labeling. Scale bars in F, 100 µm; K, 50 µm. Abbreviations: DIPG, diffuse intrinsic pontine glioma; mGBM, multifocal glioblastoma; NSG, NOD scid gamma; OLIG2, oligodendrocyte transcription factor 2; qRT-PCR, quantitative RT-PCR.
Fig. 4
Fig. 4
CC-DIPG-1 cells have high levels of EGFR and YAP1 expression. (A) Heatmap of the gene expression in DIPG cell lines and human neural stem cells (NSC). (B) Spearman correlation coefficients of gene expression patterns of DIPG cell lines with those of different GBM subtypes based on the signature genes for GBM classification in TCGA. (C) Heatmap of expression levels of the signature genes in proneural (PN) and mesenchymal (MES) GBMs that are substantially differentiated in two groups of DIPG cells. (D) Bar diagram showing signaling pathways enriched in CC-DIPG-1 cells compared with DIPG-2. (E, F) GSEA plots of (E) EGFR signaling and (F) YAP signaling signatures in CC-DIPG-1 and CC-DIPG-2 cells. (G) Chromatin accessibility and H3K27ac ChIP-seq profiles at EGFR and YAP1 loci in CC-DIPG-1 and CC-DIPG-2 cells. (H) Western blot showing EGFR and YAP1 expression in indicated DIPG cells. (I) Confocal immunofluorescence microscopy images showing expression of EGFR (green) and YAP1 (red) in CC-DIPG-1, CC-DIPG-2, and SU-DIPG-IV cells. Scale bars, 10 µm. Abbreviations: DIPG, diffuse intrinsic pontine glioma; EGFR, epidermal growth factor receptor; GBM, glioblastoma.
Fig. 5
Fig. 5
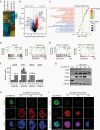
Deletion of OLIG2 causes a DIPG cell phenotype shift. (A) Heatmap of the genes differentially expressed in wild-type and OLIG2-KO SU-DIPG-IV and SU-DIPG-XIII cells. (B) Volcano plot of transcriptome profiles of wild-type and OLIG2-KO DIPG cells. Red and blue dots represent genes significantly upregulated or downregulated, respectively, in OLIG2-KO DIPGs compared to wild-type cells (fold change >2, P < .05). (C) KEGG analysis of the upregulated and downregulated genes in OLIG2-KO compared with wild-type SU-DIPG-IV and SU-DIPG-XIII cells. (D, E) GSEA enrichment plots showing the comparison of gene expression profiles in wild-type proneural-like DIPG cells and OLIG2-KO. NES, normalized enrichment score; P value, represents the statistical significance of the enrichment score. (F) qRT-PCR analysis for the indicated genes in wild-type SU-DIPG-IV cells and three OLIG2-KO subclones. Data are presented as means ± SEM; n = 3 independent experiments; *P < .05, **P < .01, ***P < .001; one-way ANOVA with multiple comparisons test. (G) Representative western blots show expression of SOX2, EGFR, YAP1, and OLIG2 in wild-type and OLIG2-KO SU-DIPG-IV cells. GAPDH was detected as a loading control. (H-I) Confocal immunofluorescence microscopy images showing expression of (H) OLIG2 and YAP1 and (I) EGFR in wild-type DIPG-IV and OLIG2-KO subclones. Scale bars in H and I, 100 µm. Abbreviations: DIPG, diffuse intrinsic pontine glioma; GSEA, gene set enrichment analysis; OLIG2, oligodendrocyte transcription factor 2; qRT-PCR, quantitative RT-PCR.
Fig. 6
Fig. 6
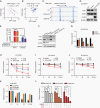
Targeting OLIG2/SOX2 and YAP1/EGFR signaling inhibits the growth of DIPG cells. (A, B) The correlations of OLIG2 expression with (A) YAP1 and (B) EGFR expression in DIPG tumor tissues. r, correlation score; P value, statistical significance of the correlation score. (C) H3K27ac signal over the YAP1 locus in control, OLIG2-overexpressing, or SOX2-overexpressing differentiated GBM cells. (D) Representative western blots for EGFR, YAP1, and OLIG2 in control and CC-DIPG-1 cells that over-express OLIG2. GAPDH was detected as a loading control. (E) qRT-PCR analysis of YAP1 in wild-type SU-DIPG-IV cells and OLIG2-KO subclones with and without shSOX2 expression. Data are presented as means ± SEM; n = 3 independent experiments; *P < .05, **P < .01; ***P < .001; one-way ANOVA with multiple comparisons test. (F) Representative western blots show for SOX2, YAP1, and OLIG2 in wild-type SU-DIPG-IV and OLIG2-KO subclones with and without shSOX2 expression. GAPDH was detected as a loading control. (G) Proliferation of wild-type DIPG-IV cells and OLIG2-KO subclones with and without shSOX2 expression determined using the WST-1 assay. Data are presented as means ± SEM; n = 3 independent experiments; *P < .05, **P < .01; ***P < .001; two-tailed Student’s t-test. (H) Cell growth of CC-DIPG-1, CC-DIPG-2, and SU-DIPG-IV cells treated with gefitinib (GFB) or verteporfin (VPN) or the combination (VPN + GFB) at the indicated times after treatment initiation. Data are presented as means ± SEM; n = 3 independent experiments; *P < .05, **P < .01, ***P < .001; one-way ANOVA with multiple comparisons test. (I) Cell growth of CC-DIPG-1, CC-DIPG-2, and SU-DIPG-IV cells after treatment with the combination of gefitinib and verteporfin. Data are presented as means ± SEM; n = 3 independent experiments; *P < .05, one-way ANOVA with multiple comparisons test. (J) Cell growth of DIPG-IV and its OLIG2-KO subclones treated with gefitinib and verteporfin or the combination for 72 h. Data are presented as means ± SEM; n = 3 independent experiments; **P < .01, ***P < .001; one-way ANOVA with multiple comparisons test. Abbreviations: DIPG, diffuse intrinsic pontine glioma; EGFR, epidermal growth factor receptor; qRT-PCR, quantitative RT-PCR.

References

    1. Donaldson SS, Laningham F, Fisher PG. Advances toward an understanding of brainstem gliomas. J Clin Oncol. 2006;24(8):1266–1272. - PubMed
    1. Hargrave D, Bartels U, Bouffet E. Diffuse brainstem glioma in children: critical review of clinical trials. Lancet Oncol. 2006;7(3):241–248. - PubMed
    1. Tate MC, Lindquist RA, Nguyen T, et al. . Postnatal growth of the human pons: a morphometric and immunohistochemical analysis. J Comp Neurol. 2015;523(3):449–462. - PMC - PubMed
    1. Johung TB, Monje M. Diffuse intrinsic pontine glioma: new pathophysiological insights and emerging therapeutic targets. Curr Neuropharmacol. 2017;15(1):88–97. - PMC - PubMed
    1. Monje M, Mitra SS, Freret ME, et al. . Hedgehog-responsive candidate cell of origin for diffuse intrinsic pontine glioma. Proc Natl Acad Sci U S A. 2011;108(11):4453–4458. - PMC - PubMed

Publication types

Substances