. 2021 Mar 18;81(6):1276-1291.e9.
doi: 10.1016/j.molcel.2021.01.015. Epub 2021 Feb 3.

PRMT6 methylation of RCC1 regulates mitosis, tumorigenicity, and radiation response of glioblastoma stem cells

Affiliations

PRMT6 methylation of RCC1 regulates mitosis, tumorigenicity, and radiation response of glioblastoma stem cells

Tianzhi Huang et al. Mol Cell. .

Abstract

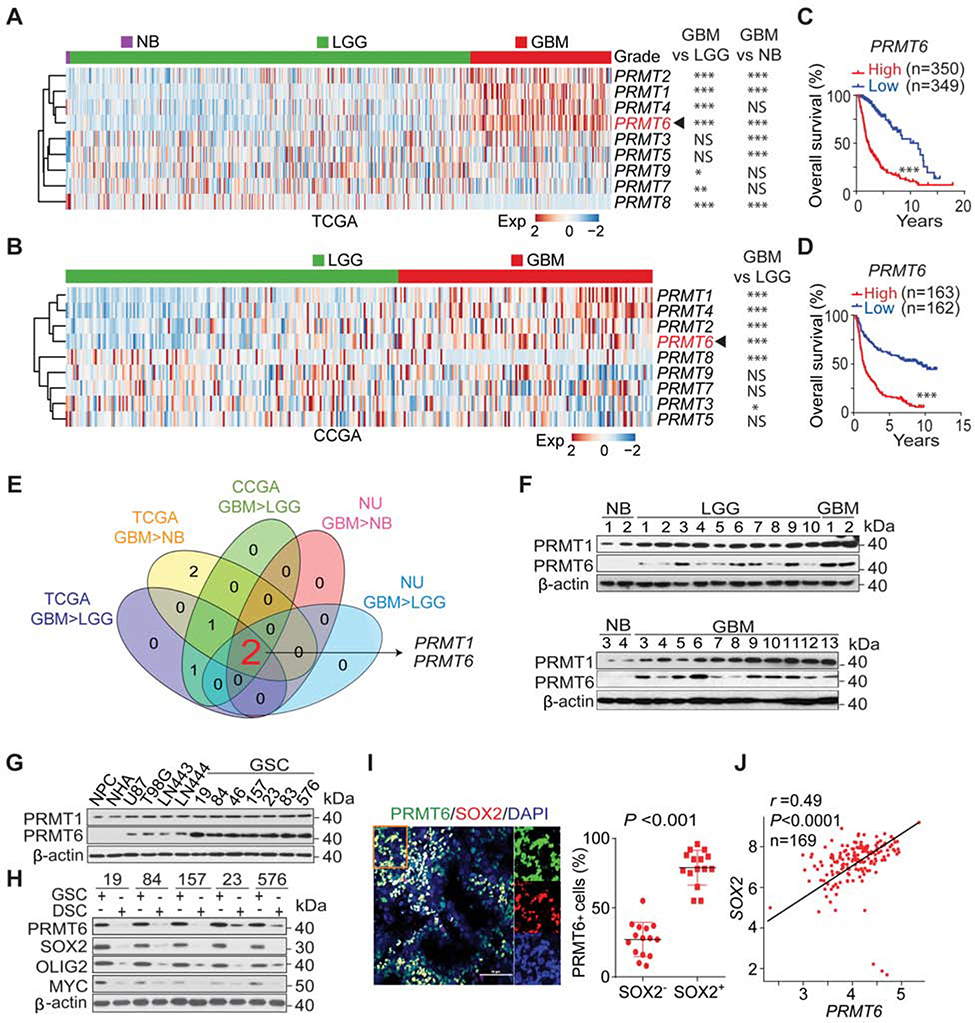
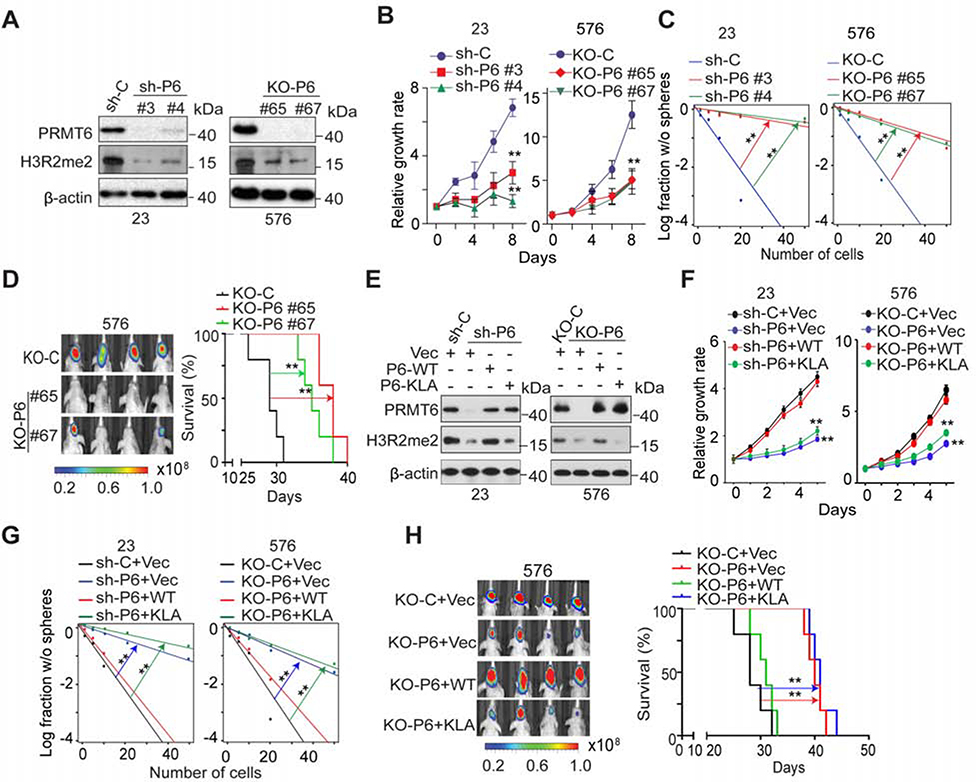
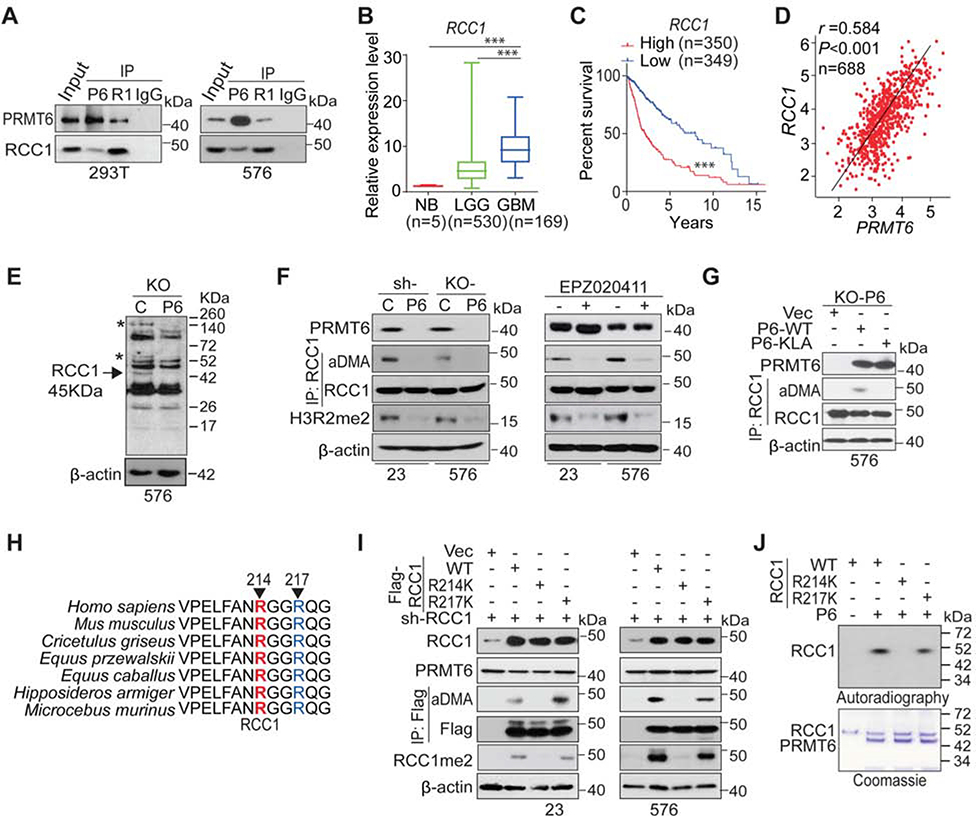
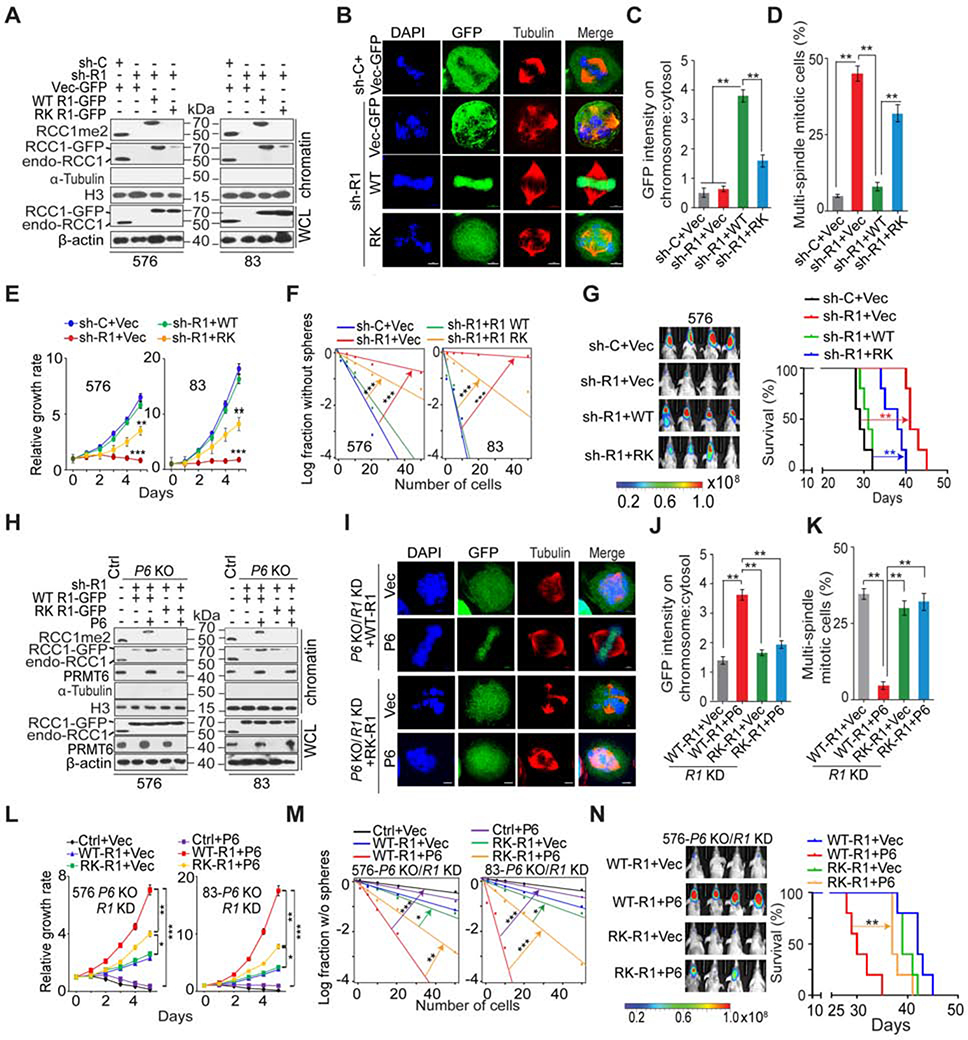
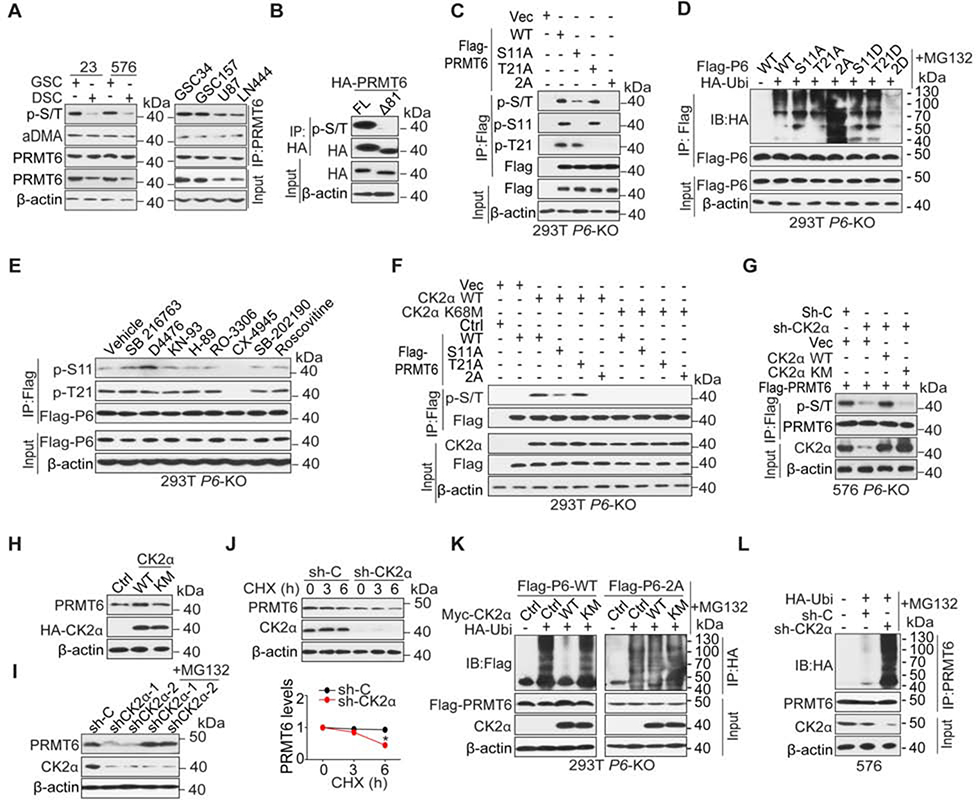
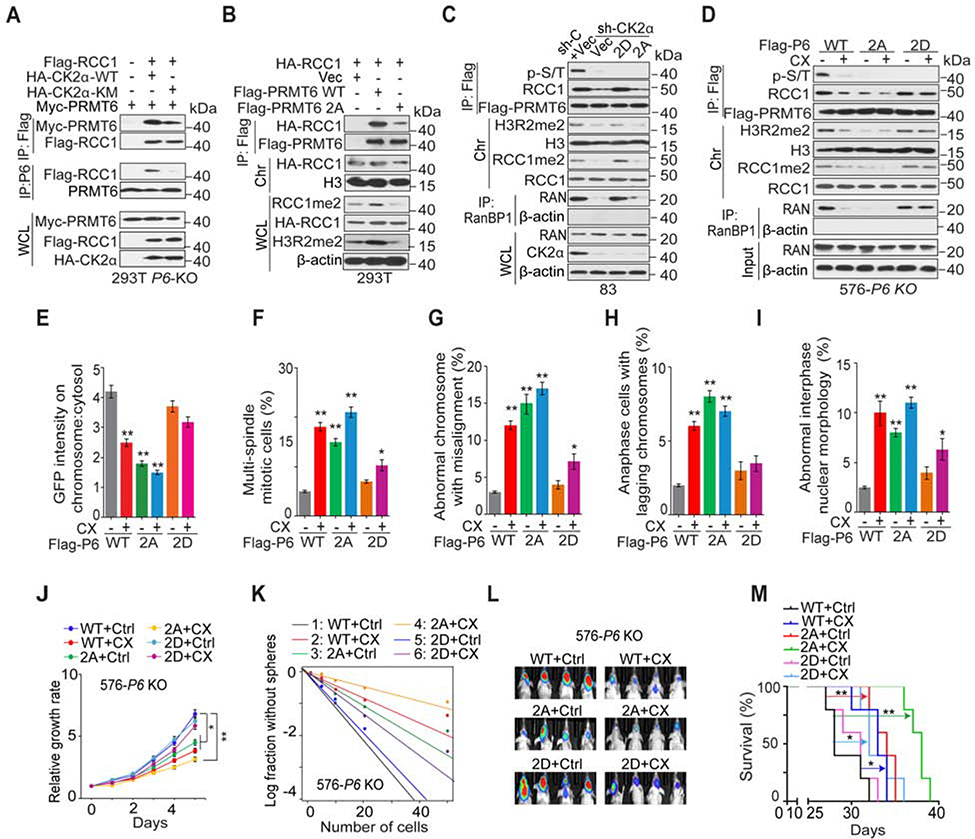
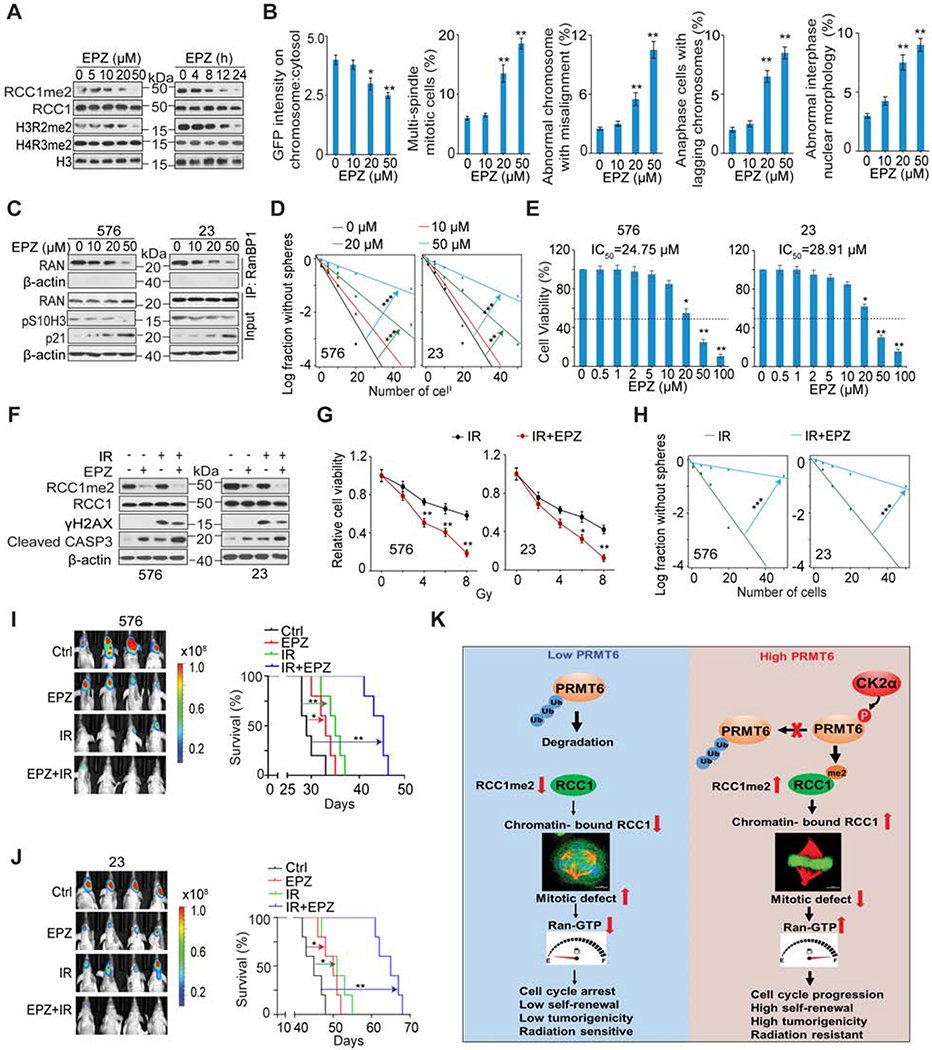
Aberrant cell proliferation is a hallmark of cancer, including glioblastoma (GBM). Here we report that protein arginine methyltransferase (PRMT) 6 activity is required for the proliferation, stem-like properties, and tumorigenicity of glioblastoma stem cells (GSCs), a subpopulation in GBM critical for malignancy. We identified a casein kinase 2 (CK2)-PRMT6-regulator of chromatin condensation 1 (RCC1) signaling axis whose activity is an important contributor to the stem-like properties and tumor biology of GSCs. CK2 phosphorylates and stabilizes PRMT6 through deubiquitylation, which promotes PRMT6 methylation of RCC1, which in turn is required for RCC1 association with chromatin and activation of RAN. Disruption of this pathway results in defects in mitosis. EPZ020411, a specific small-molecule inhibitor for PRMT6, suppresses RCC1 arginine methylation and improves the cytotoxic activity of radiotherapy against GSC brain tumor xenografts. This study identifies a CK2α-PRMT6-RCC1 signaling axis that can be therapeutically targeted in the treatment of GBM.

Keywords: CK2; GBM; GSC; PRMT; RCC1; arginine methylation; mitosis; phosphorylation; therapy response; tumorigenicity.


Conflict of interest statement

Declaration of interests The authors, and their immediate family members, are not members of the Molecular Cell advisory board. The authors declare no further competing interests.

Figures

Figure 1.
Figure 1.. PRMT6 Expression Is Elevated in GSCs and Is a Negative Prognostic Factor for GBM Patients.
(A and B), Heatmap and statistical analysis of TCGA (A) and CCGA (B) datasets for expression of PRMT genes in normal brain (NB, A), LGG, and GBM. (C and D), Kaplan-Meier analysis for PRMT6 expression in the TCGA (C) and CCGA (D) datasets. (E) Venn diagram of PRMT genes. (F) IB for PRMT1 and PRMT6 in NB, LGG and GBM of NU glioma cohort. (G) IB for PRMT1 and PRMT6 in NPCs, NHA, glioma cells, and GSCs. (H) IB for PRMT6, SOX2, OLIG2, and MYC in GSCs and corresponding differentiated glioma cells (DSCs). (I) IF of PRMT6 (green) and SOX2 (red), and DAPI (blue for nuclei). Left: images of GBM (n = 5). Right: % of PRMT6+ cells among SOX2+ vs SOX2 cells. Scale bar, 50 μm. Lines, ±SEM. (H) Pearson correlation between PRMT6 and SOX2 expression in the TCGA GBM dataset. Scale in both axis: log2 (TPM). *, p < 0.05; **, p < 0.01; ***, p < 0.001; NS, no significance. Data are representative of two independent experiments with similar results. See also Figure S1 and Table S1 to S4.
Figure 2.
Figure 2.. PRMT6 Expression Influences Growth, Self-Renewal, and Tumorigenicity of GSCs.
(A) IB for PRMT6 and H3R2me2 in GSC23 and 576 with indicated modifications. (B and C), Effects of PRMT6 KD or KO on cell proliferation (B), sphere-forming frequency (C) of GSC23 and 576. (D) BLI of GBM brain xenografts derived from the luciferase-labeled GSC576 with indicated modifications (left). Kaplan-Meier analysis of mice received indicated GSC576 (n=5/group, right). (E) IB for PRMT6 and H3R2me2 in GSC23/PRMT6 KD and 576/PRMT6 KO cells with indicated modifications. PRMT6-KLA, a catalytically inactive PRMT6. (F and G) Cell proliferation (F) and sphere-forming frequency (G) of GSC23/PRMT6 KD and 576/PRMT6 KO cells with indicated modifications. (H) BLI of GBM brain xenografts of GSC576/PRMT6 KO with indicated modifications (left). Kaplan-Meier analysis of mice received indicated GSC576 cells (n = 5, right). Colored scale bars in (D) and (H) represent photons/s/cm2/steradian. Data in (B, F) are means ± SEM, n=4. **p < 0.01. **p <0.01. Data are representative of two to three independent experiments with similar results. See also Figure S2.
Figure 3.
Figure 3.. PRMT6 Methylates RCC1 at R214 through Direct Interactions.
(A) IP-IB and IB of PRMT6 and RCC1 in 293T cells and GSC576. (B) Box plots of the TCGA for RCC1 gene between NB, LGG, and GBM with indicated median. (C) Kaplan-Meier analyses of the TCGA LGG+GBM dataset for RCC1 expression. (D) Pearson correlation between PRMT6 and RCC1 expression in the TCGA LGG+GBM dataset. Scale in both axis: log2 (TPM). (E) IB of GSC576/PRMT6 KO cells using an anti-aDMA antibody. PRMT6 KO-affected aDMA proteins are indicated with two asterisks and one arrow with a molecular weight (~45 KDa) similar to RCC1. (F) IP-IB and IB of indicated proteins in GSC23/PRMT6 KD and 576/PRMT6 KO cells, or GSCs with EPZ020411 treatments. (G) IP-IB and IB of indicated proteins in GSC576/PRMT6 KO with indicated modifications. (H) AA sequences around R214 residue in RCC1 are conserved across different species. Arrows, serine residues that are conserved across species. (I) IP-IB and IB of indicated proteins in GSC23 and 576 with indicated modifications. (J) In vitro methylation assays of PRMT6. ***p < 0.001. Data are representative of two to three independent experiments with similar results. See also Figure S3.
Figure 4.
Figure 4.. R214 Methylation of RCC1 is Required for Its Chromatin Association, Mitotic Process, and GSC Tumorigenicity.
(A and H) IB for whole cell lysates (WCL) and chromatin fractions (Chr) of GSC576 and 83 with indicated modifications. β-actin and histone H3 were loading controls for WCL and Chr, respectively. (B and I) IF for GSC576 with indicated modifications. GFP, green; tubulin, red; DAPI, blue. (C and J) Ratios of chromosomal:cytosolic GFP in GSC576 with indicated modifications. Ratios of relative fluorescence intensity at chromosome versus centrosome in 50 mitotic cells for each condition were measured. (D and K) The frequency of supernumerary spindles in GSC576 with indicated modifications. 50 mitotic cells for each condition were measured. (E, F, L, M) Cell proliferation (E and L) or sphere-forming frequency (F and M) of GSC576 and 83 with indicated modifications. (G and N) Left: BLI of GBM brain xenografts of GSC576 with indicated modifications. Right, Kaplan-Meier analysis of animals (n=5/group). Colored scale bars represent photons/s/cm2/steradian. Scale bars in (B, I), 5 μm. Data in bar or line graphs are means ± SEM. *, p < 0.05; **, p < 0.01; ***, p < 0.001. Data are representative of two to three independent experiments with similar results. See also Figure S4.
Figure 5.
Figure 5.. CK2α Stabilizes PRMT6 Protein through Phosphorylation of PRMT6.
(A) IP-IB and IB using indicated antibodies in GSCs, their corresponding differentiated glioma cells (DSCs), and glioma cell lines. (B) IP-IB and IB using indicated antibodies in GSC576 cells expressing a full-length (FL) or N-terminal deletion mutant (Δ81) of HA-PRMT6. (C-F) IP-IB and IB for indicated proteins in 293T/PRMT6 KO cells with indicated modifications or treatments. (G) IP-IB and IB for p-S/T of PRMT6 in GSC576/PRMT6 KO cells that were transduced with indicated plasmids. sh-CK2α targets 3’UTR of CSNK2A1 mRNA, and GSC576 cells were collected after treatment with MG132 for 6 h. (H) IB for PRMT6 in 293T cells that were transduced with indicated plasmids. (I) IB for PRMT6 and CK2α in GSC576 cells with indicated modifications. (J) IB for PRMT6 and CK2α in GSC23/CK2α KD or sh-C cells that were treated with 50 μg/ml cycloheximide (CHX) for the indicated times. Band intensities of PRMT6 proteins were quantified and the results were expressed as PRMT6 levels relative to untreated cells. Error bars, ± SEM, n=3. Two-tailed Student’s t-test. *, p < 0.05; (K and L) IP-IB and IB for ubiquitination of PRMT6 in 293T P6-KO (K) and GSC576 (L) cells with indicated modifications and treatments. Data are representative of two to three independent experiments with similar results. See also Figure S5.
Figure 6.
Figure 6.. CK2α Phosphorylation of PRMT6 Regulates RCC1 Association with Chromatin, Mitosis, and GSC tumorigenicity
(A) IP-IB and IB for indicated proteins in 293T/PRMT6 KO cells with indicated modifications. (B) IP-IB and IB for indicated proteins in 293T cells with indicated modifications. (C) IP-IB and IB for indicated proteins in GSC83/CK2α KD cells that expressed indicated plasmids. (D) IP-IB and IB for indicated proteins in GSC576/PRMT6 KO cells with indicated modifications and treatments. (E) Chromosomal:cytosolic RCC1-GFP in GSC576/PRMT6 KO cells with indicated modifications and treatments. n=50 mitotic cells for each condition. (F-I) Frequencies of indicated mitotic and interphase defects were determined in GSC576/PRMT6 KO cells with indicated modifications and treatments. n=100 cells for each condition. (J and K) Cell proliferation (J) or sphere-forming frequency (K) of GSC576/PRMT6 KO cells with indicated modifications and treatments. (L) BLI of GBM brain xenografts of GSC576/PRMT6 KO cells with indicated modifications (n=5/group). (M) Kaplan-Meier analyses of animals as indicated in (L, n=5/group). Colored scale bars, photons/s/cm2/steradian. Data in bar or line graphs are means ± SEM. *, p < 0.05; **, p < 0.01; Data are representative of two to three independent experiments with similar results. See also Figure S6.
Figure 7.
Figure 7.. EPZ020411 (EPZ) Inhibition of PRMT6 Attenuates the Tumor-Initiating Ability of GSCs and Sensitizes GSC Tumor Xenografts to Ionizing Radiation (IR).
(A) IB for indicated proteins in GSC576 cells that were treated with the indicated concentrations of EPZ for 12 h (left) or with 20 μM EPZ for the indicated times (right). (B) Chromosomal:cytosolic RCC-GFP and frequencies of indicated defects in mitotic and interphase in GSC83 cells with the indicated concentrations of EPZ for 12 h. n=50 mitotic cells for each condition. (C) IP-IB and IB for indicated proteins in GSC576 and 23 were treated with the indicated concentrations of EPZ for 12 hr. (D) Sphere-forming frequency for GSC576 and 23 with the indicated concentrations of EPZ for 12 h. (E) Cell viability for GSC576 (left) and 23 (right) cells treated with indicated concentration of EPZ for 5 days. (F) IB for indicated proteins in GSC576 and 23 treated with DMSO, 20 μM EPZ, IR (5 Gy), or EPZ + IR in 2 days post IR. γH2AX was detected at one hour after IR. (G and H) Cell viability (G) and sphere-forming frequency (H) for GSC576 and 23 cells at day 5 after indicated treatments. (I and J) Representative BLI images and Kaplan Meier analysis of GBM brain xenografts of GSC576 (I) and 23 (J) with indicated treatments (n=5/group). Colored scale bars represent photons/s/cm2/steradian. (K) Illustration of the CK2α-PRMT6-RCC1 axis in the regulation of cell mitosis and tumorigenicity of GBM. Data in bar or line graphs are means ± SEM, *, p < 0.05; **, p < 0.01; ***, p < 0.01; Data are representative of two to three independent experiments with similar results. See also Figures S7 and S8.

Comment in

References

    1. Almeida-Rios D, Graca I, Vieira FQ, Ramalho-Carvalho J, Pereira-Silva E, Martins AT, Oliveira J, Goncalves CS, Costa BM, Henrique R, et al. (2016). Histone methyltransferase PRMT6 plays an oncogenic role of in prostate cancer. Oncotarget 7, 53018–53028. - PMC - PubMed
    1. Avasarala S, Wu PY, Khan SQ, Yanlin S, Van Scoyk M, Bao J, Di Lorenzo A, David O, Bedford MT, Gupta V, et al. (2020). PRMT6 Promotes Lung Tumor Progression via the Alternate Activation of Tumor-Associated Macrophages. Mol Cancer Res 18, 166–178. - PMC - PubMed
    1. Azuma Y, Renault L, Garcia-Ranea JA, Valencia A, Nishimoto T, and Wittinghofer A (1999). Model of the ran-RCC1 interaction using biochemical and docking experiments. J Mol Biol 289, 1119–1130. - PubMed
    1. Bao J, Di Lorenzo A, Lin K, Lu Y, Zhong Y, Sebastian MM, Muller WJ, Yang Y, and Bedford MT (2019). Mouse Models of Overexpression Reveal Distinct Oncogenic Roles for Different Type I Protein Arginine Methyltransferases. Cancer Res 79, 21–32. - PMC - PubMed
    1. Bedford MT, and Clarke SG (2009). Protein arginine methylation in mammals: who, what, and why. Mol Cell 33, 1–13. - PMC - PubMed

Publication types

MeSH terms