

The impact of non-pharmaceutical interventions on SARS-CoV-2 transmission across 130 countries and territories
- PMID: 33541353
- PMCID: PMC7861967
- DOI: 10.1186/s12916-020-01872-8
The impact of non-pharmaceutical interventions on SARS-CoV-2 transmission across 130 countries and territories
Abstract
Background: Non-pharmaceutical interventions (NPIs) are used to reduce transmission of SARS coronavirus 2 (SARS-CoV-2) that causes coronavirus disease 2019 (COVID-19). However, empirical evidence of the effectiveness of specific NPIs has been inconsistent. We assessed the effectiveness of NPIs around internal containment and closure, international travel restrictions, economic measures, and health system actions on SARS-CoV-2 transmission in 130 countries and territories.
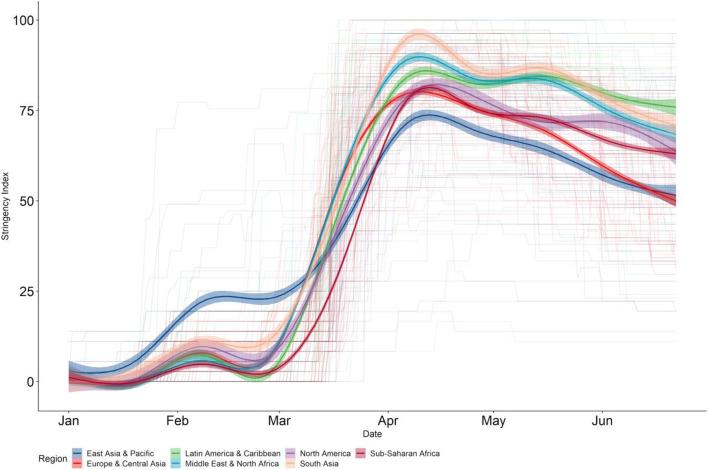
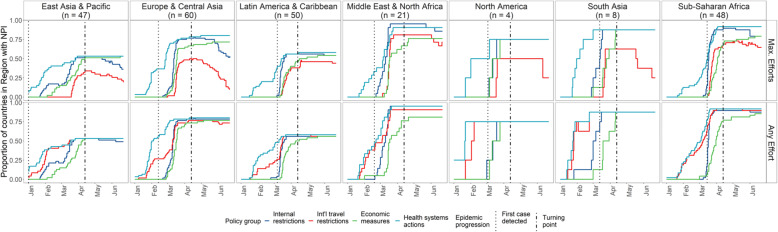
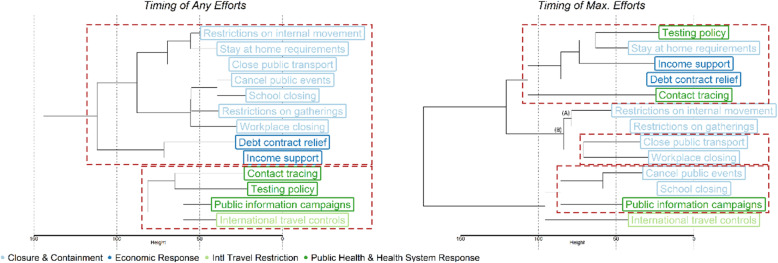
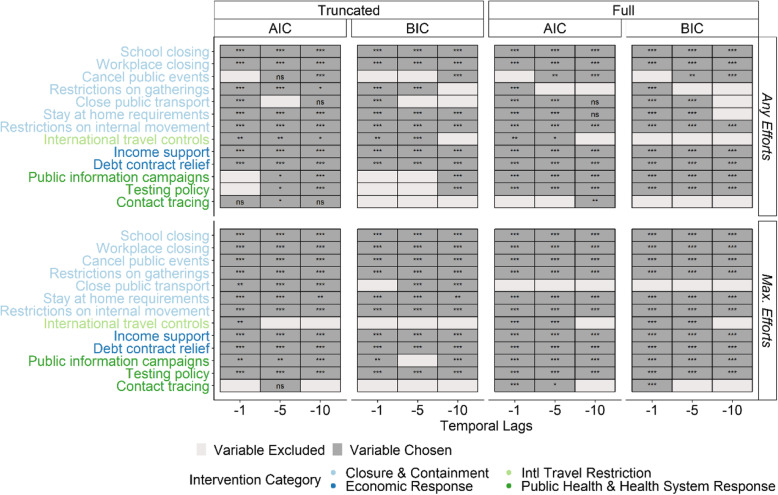
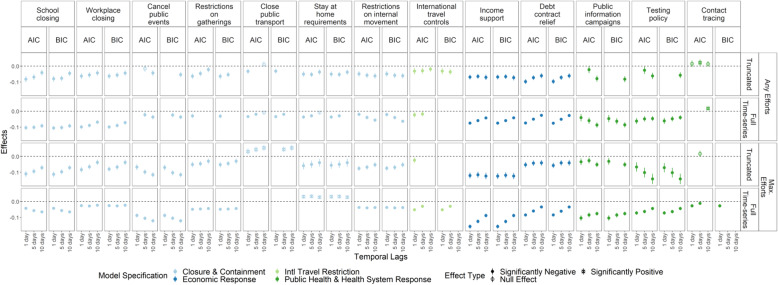
Methods: We used panel (longitudinal) regression to estimate the effectiveness of 13 categories of NPIs in reducing SARS-CoV-2 transmission using data from January to June 2020. First, we examined the temporal association between NPIs using hierarchical cluster analyses. We then regressed the time-varying reproduction number (Rt) of COVID-19 against different NPIs. We examined different model specifications to account for the temporal lag between NPIs and changes in Rt, levels of NPI intensity, time-varying changes in NPI effect, and variable selection criteria. Results were interpreted taking into account both the range of model specifications and temporal clustering of NPIs.
Results: There was strong evidence for an association between two NPIs (school closure, internal movement restrictions) and reduced Rt. Another three NPIs (workplace closure, income support, and debt/contract relief) had strong evidence of effectiveness when ignoring their level of intensity, while two NPIs (public events cancellation, restriction on gatherings) had strong evidence of their effectiveness only when evaluating their implementation at maximum capacity (e.g. restrictions on 1000+ people gathering were not effective, restrictions on < 10 people gathering were). Evidence about the effectiveness of the remaining NPIs (stay-at-home requirements, public information campaigns, public transport closure, international travel controls, testing, contact tracing) was inconsistent and inconclusive. We found temporal clustering between many of the NPIs. Effect sizes varied depending on whether or not we included data after peak NPI intensity.
Conclusion: Understanding the impact that specific NPIs have had on SARS-CoV-2 transmission is complicated by temporal clustering, time-dependent variation in effects, and differences in NPI intensity. However, the effectiveness of school closure and internal movement restrictions appears robust across different model specifications, with some evidence that other NPIs may also be effective under particular conditions. This provides empirical evidence for the potential effectiveness of many, although not all, actions policy-makers are taking to respond to the COVID-19 pandemic.
Keywords: COVID-19; Health impact assessment; Longitudinal analysis; Non-pharmaceutical interventions; Pandemic; Policy evaluation; Public health intervention; Quantitative; SARS-CoV-2.
Conflict of interest statement
Prof. Mark Jit is a member of the editorial board at BMC Medicine.
Figures
References
-
- Hale T, Angrist N, Kira B, Petherick A, Phillips T, Webster S. Variation in government responses to COVID-19. BSG-WP-2020/032. Version 5.0. 2020. Available from: https://www.bsg.ox.ac.uk/sites/default/files/2020-05/BSG-WP-2020-032-v5..... [cited 2020 May 11].
-
- Barrot J-N, Grassi B, Sauvagnat J. Sectoral effects of social distancing. Rochester, NY: Social Science Research Network; 2020. Report No.: ID 3569446. Available from: https://papers.ssrn.com/abstract=3569446. [cited 2020 Jun 7].
-
- Quilty BJ, Diamond C, Liu Y, Gibbs H, Russell TW, Jarvis CI, et al. The effect of inter-city travel restrictions on geographical spread of COVID-19: evidence from Wuhan, China. medRxiv. 2020;21:2020.04.16.20067504. https://bmcmedicine.biomedcentral.com/articles/10.1186/s12916-020-01712-9. - DOI
Publication types
MeSH terms
Grants and funding
LinkOut - more resources
Full Text Sources
Other Literature Sources
Medical
Miscellaneous
