

Investigation of carbon and energy metabolic mechanism of mixotrophy in Chromochloris zofingiensis
- PMID: 33541405
- PMCID: PMC7863362
- DOI: 10.1186/s13068-021-01890-5
Investigation of carbon and energy metabolic mechanism of mixotrophy in Chromochloris zofingiensis
Abstract
Background: Mixotrophy can confer a higher growth rate than the sum of photoautotrophy and heterotrophy in many microalgal species. Thus, it has been applied to biodiesel production and wastewater utilization. However, its carbon and energy metabolic mechanism is currently poorly understood.
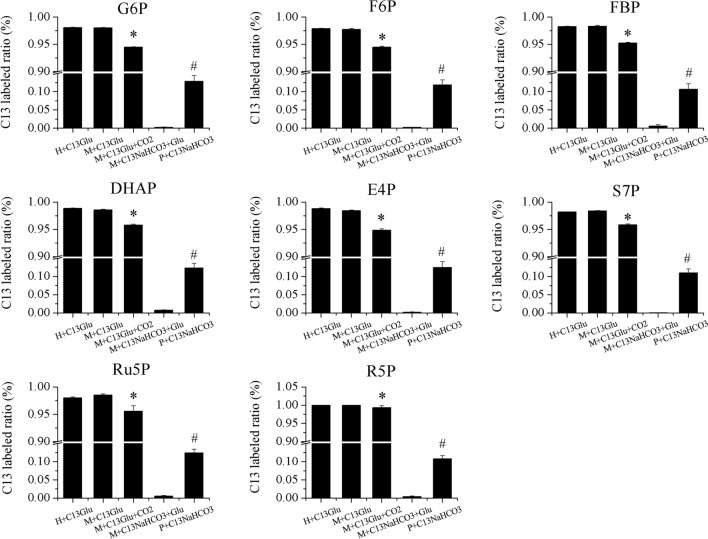
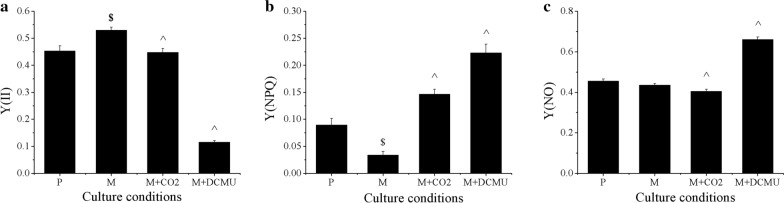
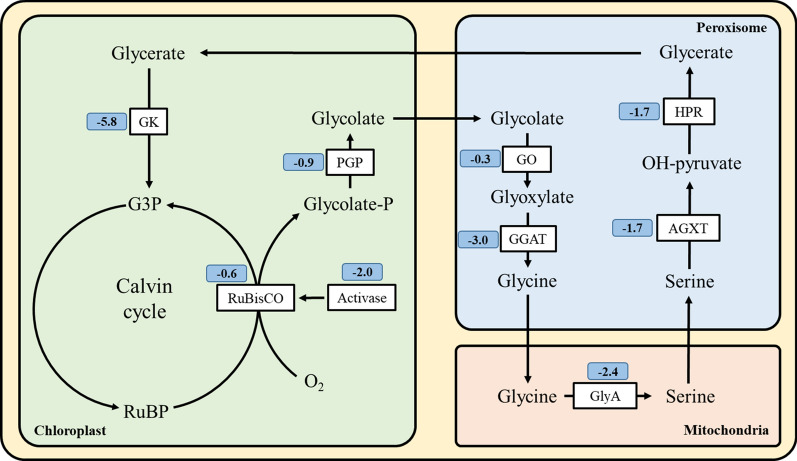
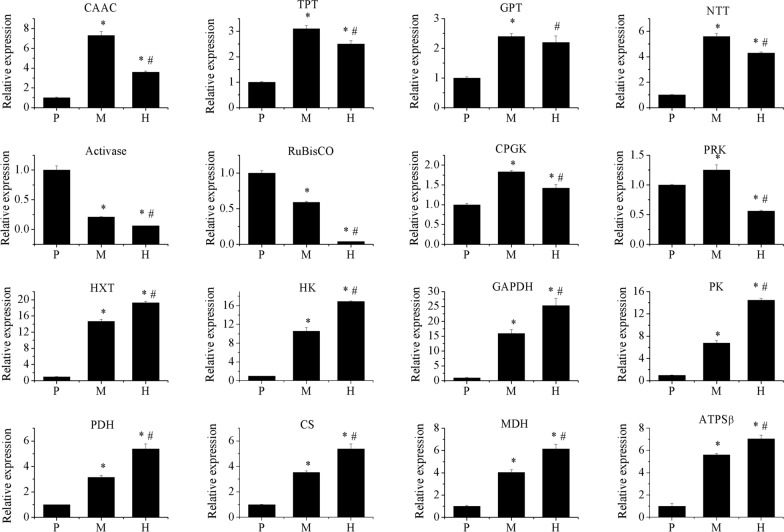
Results: To elucidate underlying carbon and energy metabolic mechanism of mixotrophy, Chromochloris zofingiensis was employed in the present study. Photosynthesis and glucose metabolism were found to operate in a dynamic balance during mixotrophic cultivation, the enhancement of one led to the lowering of the other. Furthermore, compared with photoautotrophy, non-photochemical quenching and photorespiration, considered by many as energy dissipation processes, were significantly reduced under mixotrophy. Comparative transcriptome analysis suggested that the intermediates of glycolysis could directly enter the chloroplast and replace RuBisCO-fixed CO2 to provide carbon sources for chloroplast organic carbon metabolism under mixotrophy. Therefore, the photosynthesis rate-limiting enzyme, RuBisCO, was skipped, allowing for more efficient utilization of photoreaction-derived energy. Besides, compared with heterotrophy, photoreaction-derived ATP reduced the need for TCA-derived ATP, so the glucose decomposition was reduced, which led to higher biomass yield on glucose. Based on these results, a mixotrophic metabolic mechanism was identified.
Conclusions: Our results demonstrate that the intermediates of glycolysis could directly enter the chloroplast and replace RuBisCO-fixed CO2 to provide carbon for photosynthesis in mixotrophy. Therefore, the photosynthesis rate-limiting enzyme, RuBisCO, was skipped in mixotrophy, which could reduce energy waste of photosynthesis while promote cell growth. This finding provides a foundation for future studies on mixotrophic biomass production and photosynthetic metabolism.
Keywords: Chromochloris zofingiensis; Mixotrophy; Non-photochemical quenching; Photorespiration; Photosynthesis; RuBisCO.
Conflict of interest statement
The authors declare that they have no competing interests.
Figures


Similar articles
-
Mixotrophic growth of the extremophile Galdieria sulphuraria reveals the flexibility of its carbon assimilation metabolism.New Phytol. 2021 Jul;231(1):326-338. doi: 10.1111/nph.17359. Epub 2021 May 1. New Phytol. 2021. PMID: 33764540 Free PMC article.
-
Physiological and Ecological Aspects of Chlorella sorokiniana (Trebouxiophyceae) Under Photoautotrophic and Mixotrophic Conditions.Microb Ecol. 2018 Oct;76(3):791-800. doi: 10.1007/s00248-018-1170-8. Epub 2018 Mar 8. Microb Ecol. 2018. PMID: 29520451
-
Mixotrophy, a more promising culture mode: Multi-faceted elaboration of carbon and energy metabolism mechanisms to optimize microalgae culture.Bioresour Technol. 2023 Oct;386:129512. doi: 10.1016/j.biortech.2023.129512. Epub 2023 Jul 20. Bioresour Technol. 2023. PMID: 37481043 Review.
-
Do mixotrophs grow as photoheterotrophs? Photophysiological acclimation of the chrysophyte Ochromonas danica after feeding.New Phytol. 2014 Dec;204(4):882-9. doi: 10.1111/nph.12975. Epub 2014 Aug 19. New Phytol. 2014. PMID: 25138174
-
Acetogenic mixotrophy: novel options for yield improvement in biofuels and biochemicals production.Curr Opin Biotechnol. 2015 Jun;33:60-72. doi: 10.1016/j.copbio.2014.11.014. Epub 2014 Dec 10. Curr Opin Biotechnol. 2015. PMID: 25498292 Review.
Cited by
-
Growth of microalgae and cyanobacteria consortium in a photobioreactor treating liquid anaerobic digestate from vegetable waste.Sci Rep. 2023 Dec 19;13(1):22651. doi: 10.1038/s41598-023-50173-6. Sci Rep. 2023. PMID: 38114556 Free PMC article.
-
Transcriptomic and metabolomic analyses revealed regulation mechanism of mixotrophic Cylindrotheca sp. glycerol utilization and biomass promotion.Biotechnol Biofuels Bioprod. 2023 May 19;16(1):84. doi: 10.1186/s13068-023-02338-8. Biotechnol Biofuels Bioprod. 2023. PMID: 37208696 Free PMC article.
-
Analysis of Photosynthetic Characteristics and Screening High Light-Efficiency Germplasm in Sugarcane.Plants (Basel). 2024 Feb 22;13(5):587. doi: 10.3390/plants13050587. Plants (Basel). 2024. PMID: 38475434 Free PMC article.
-
Relatively high light inhibits reserves degradation in the Coptis chinensis rhizome during the leaf expansion by changing the source-sink relationship.Front Plant Sci. 2023 Sep 1;14:1225895. doi: 10.3389/fpls.2023.1225895. eCollection 2023. Front Plant Sci. 2023. PMID: 37719221 Free PMC article.
-
Progress towards a targeted biorefinery of Chromochloris zofingiensis: a review.Biomass Convers Biorefin. 2024;14(7):8127-8152. doi: 10.1007/s13399-022-02955-7. Epub 2022 Jun 27. Biomass Convers Biorefin. 2024. PMID: 38510795 Free PMC article. Review.
References
-
- Maity JP, Bundschuh J, Chen C-Y, Bhattacharya P. Microalgae for third generation biofuel production, mitigation of greenhouse gas emissions and wastewater treatment: present and future perspectives—a mini review. Energy. 2014;78:104–113. doi: 10.1016/j.energy.2014.04.003. - DOI
-
- Wang H, Zhou W, Shao H, Liu T. A comparative analysis of biomass and lipid content in five Tribonema sp. strains at autotrophic, heterotrophic and mixotrophic cultivation. Algal Res. 2017;24:284–289. doi: 10.1016/j.algal.2017.04.020. - DOI
Grants and funding
LinkOut - more resources
Full Text Sources
Other Literature Sources
