. 2021 Jun;11(6):1468-1489.
doi: 10.1158/2159-8290.CD-20-0839. Epub 2021 Feb 4.

Clinical and Biological Subtypes of B-cell Lymphoma Revealed by Microenvironmental Signatures

Affiliations

Clinical and Biological Subtypes of B-cell Lymphoma Revealed by Microenvironmental Signatures

Nikita Kotlov et al. Cancer Discov. 2021 Jun.

Abstract

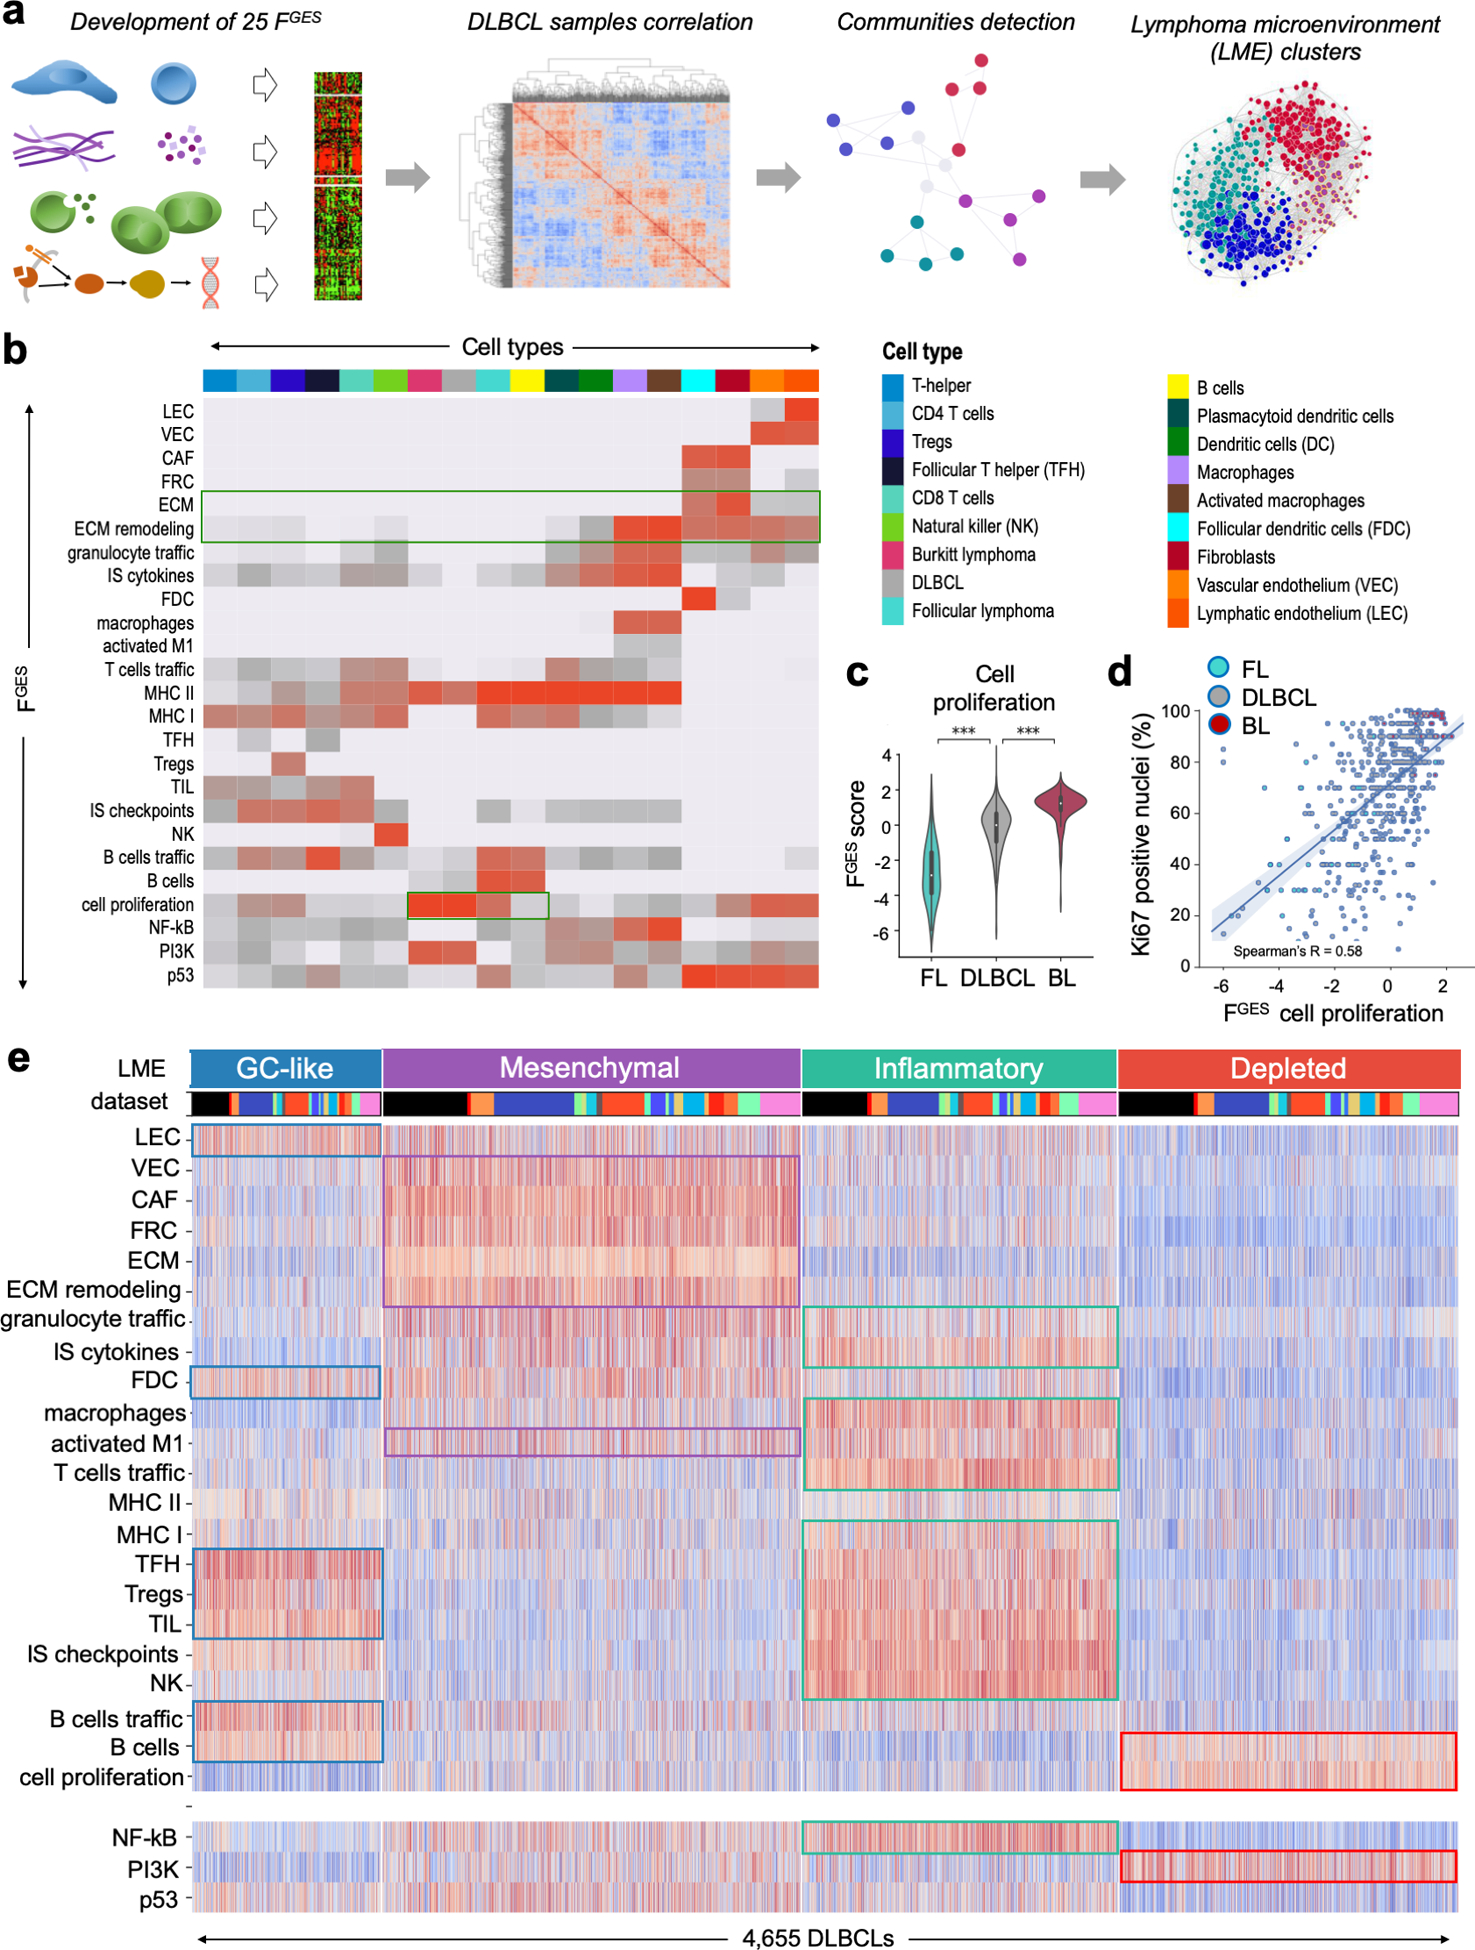
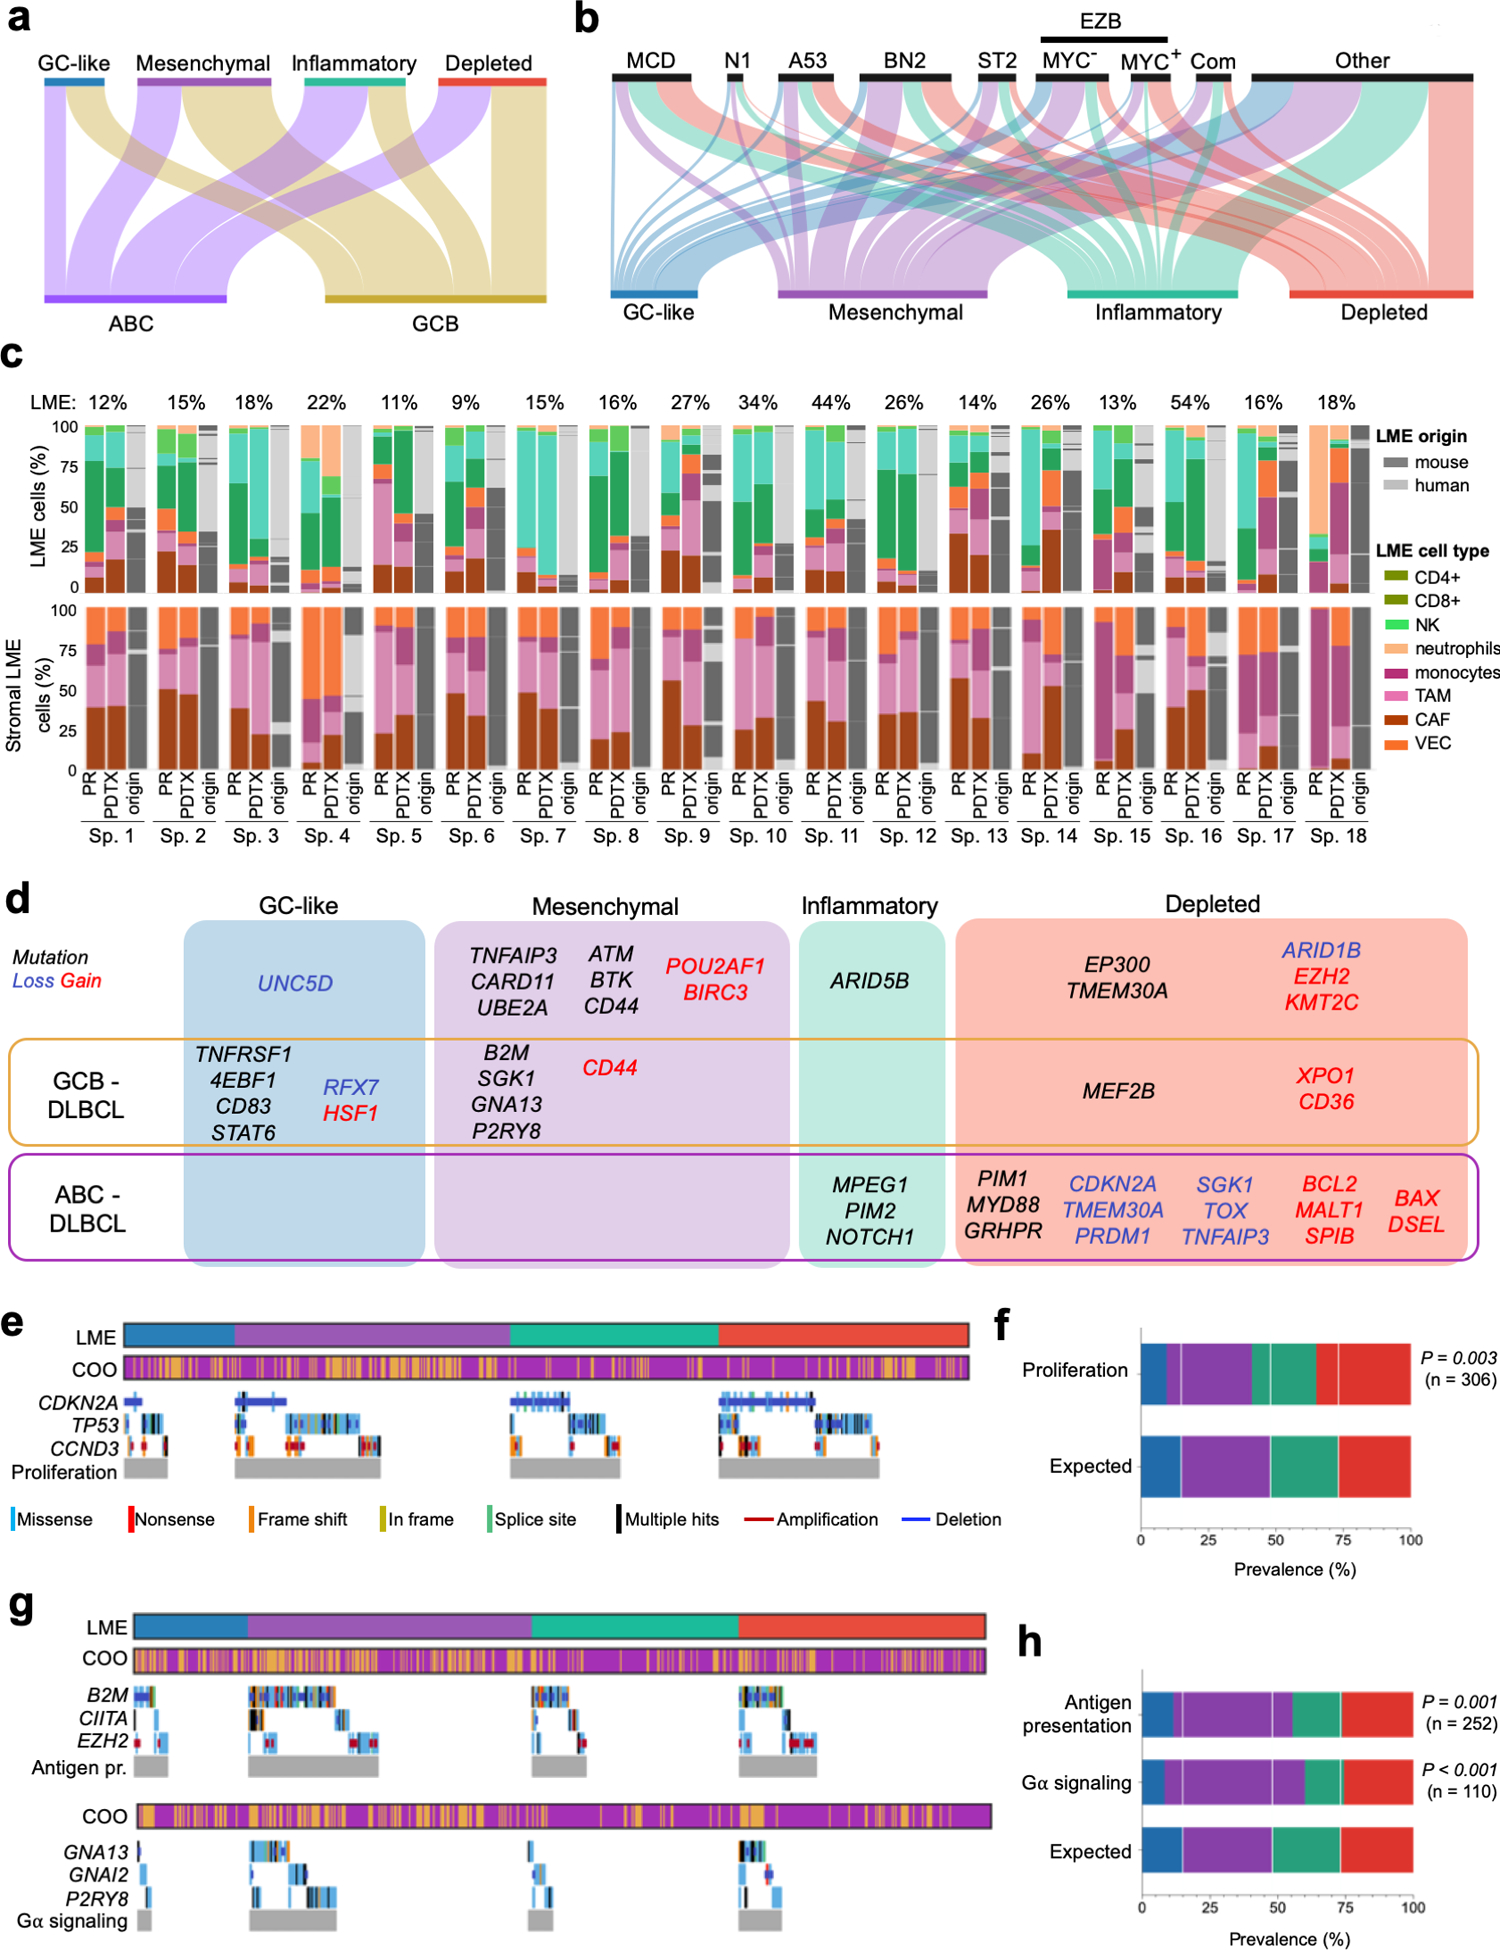
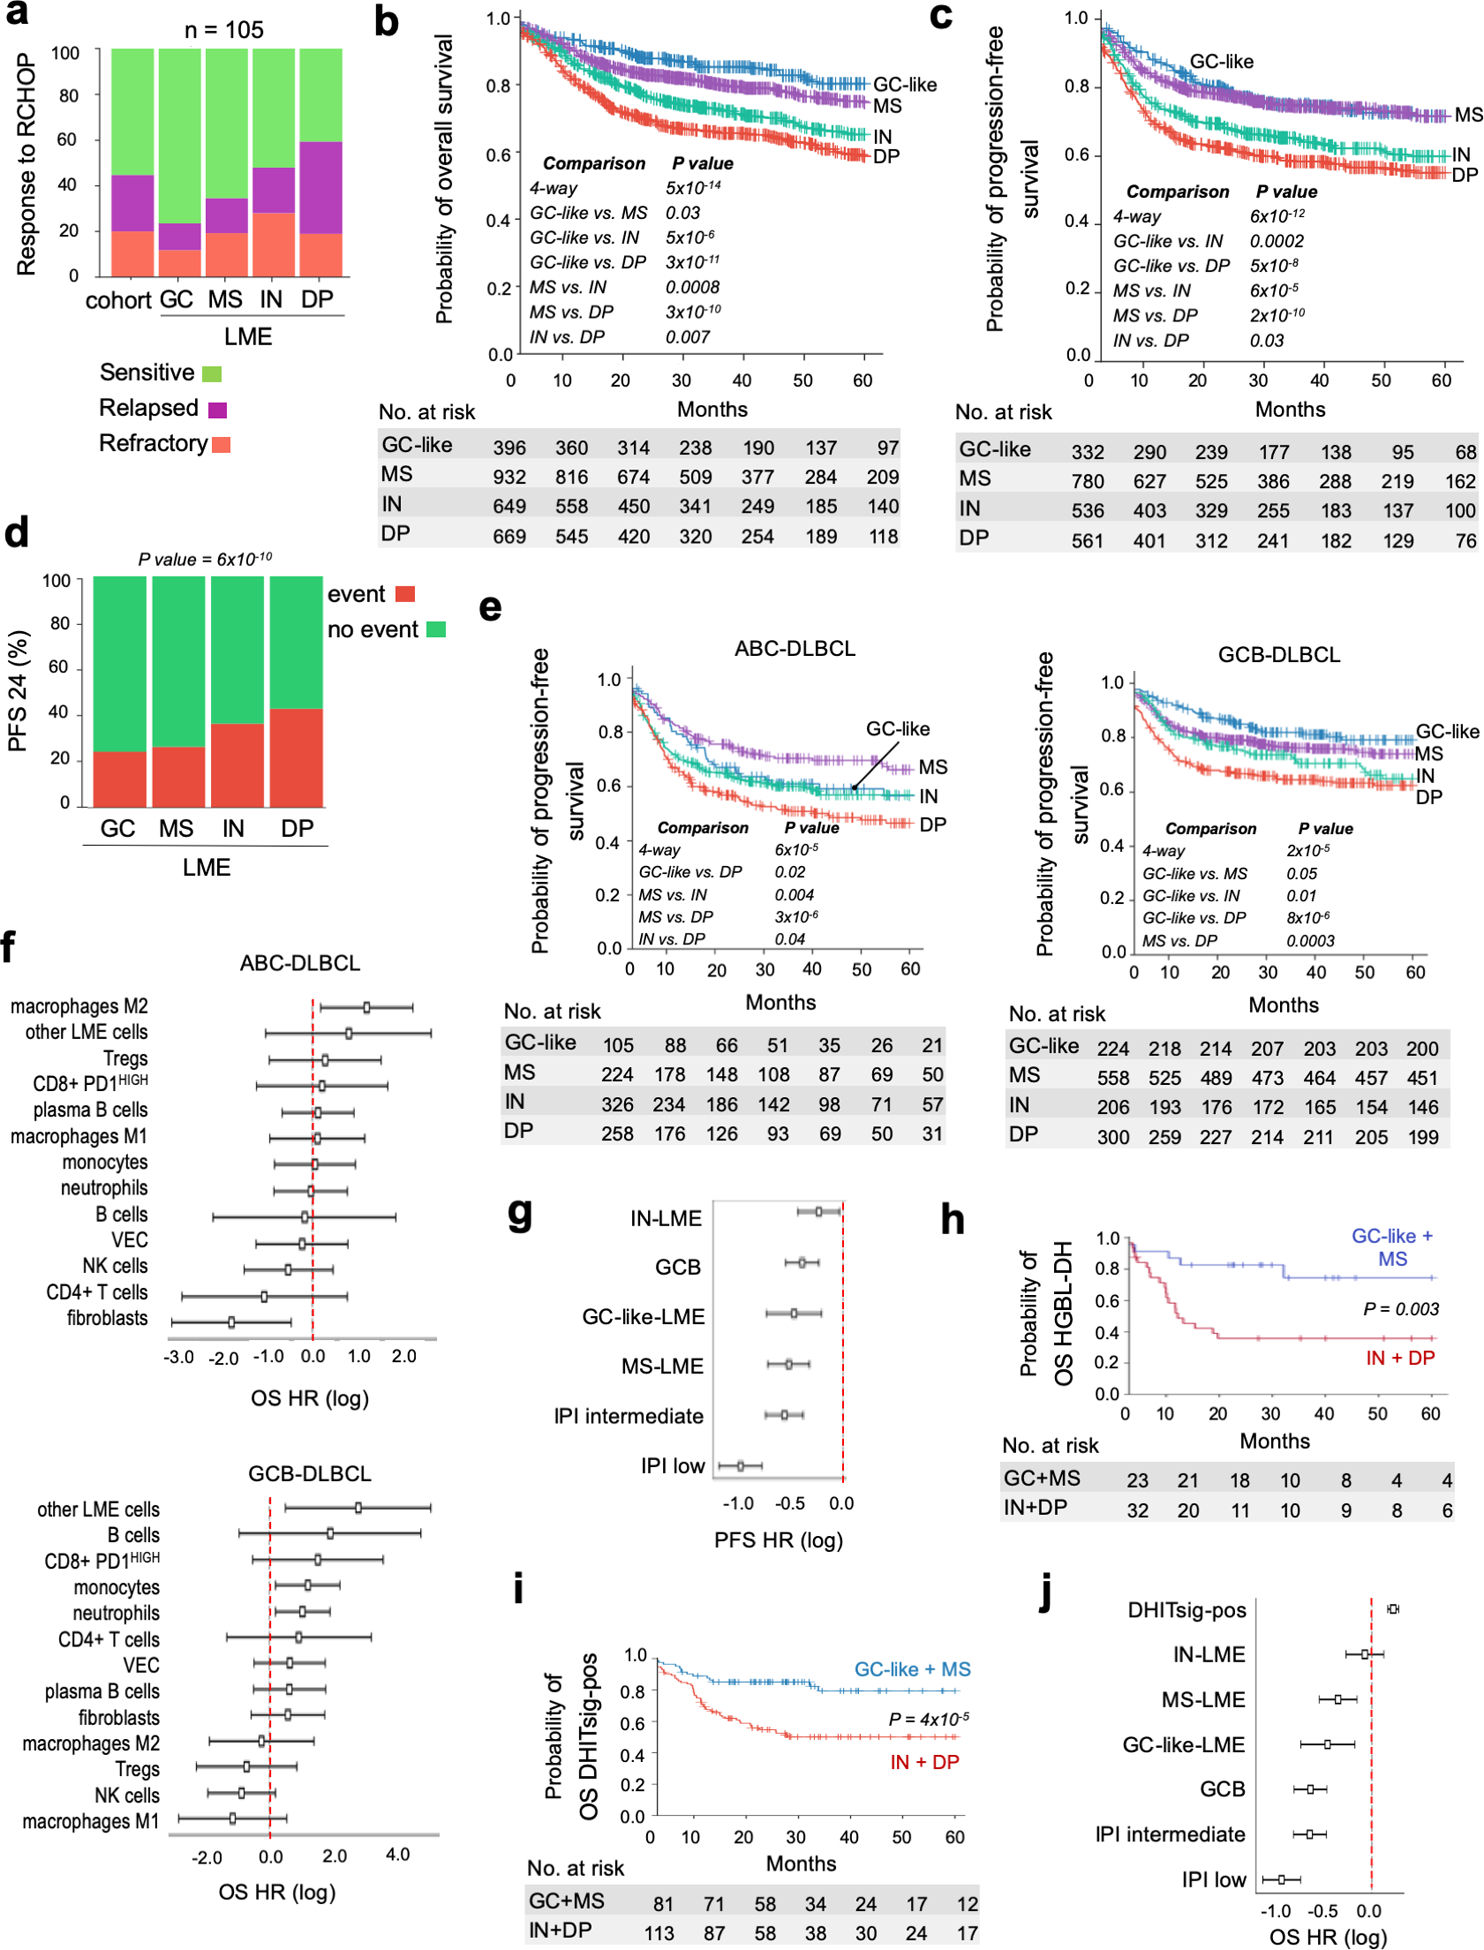
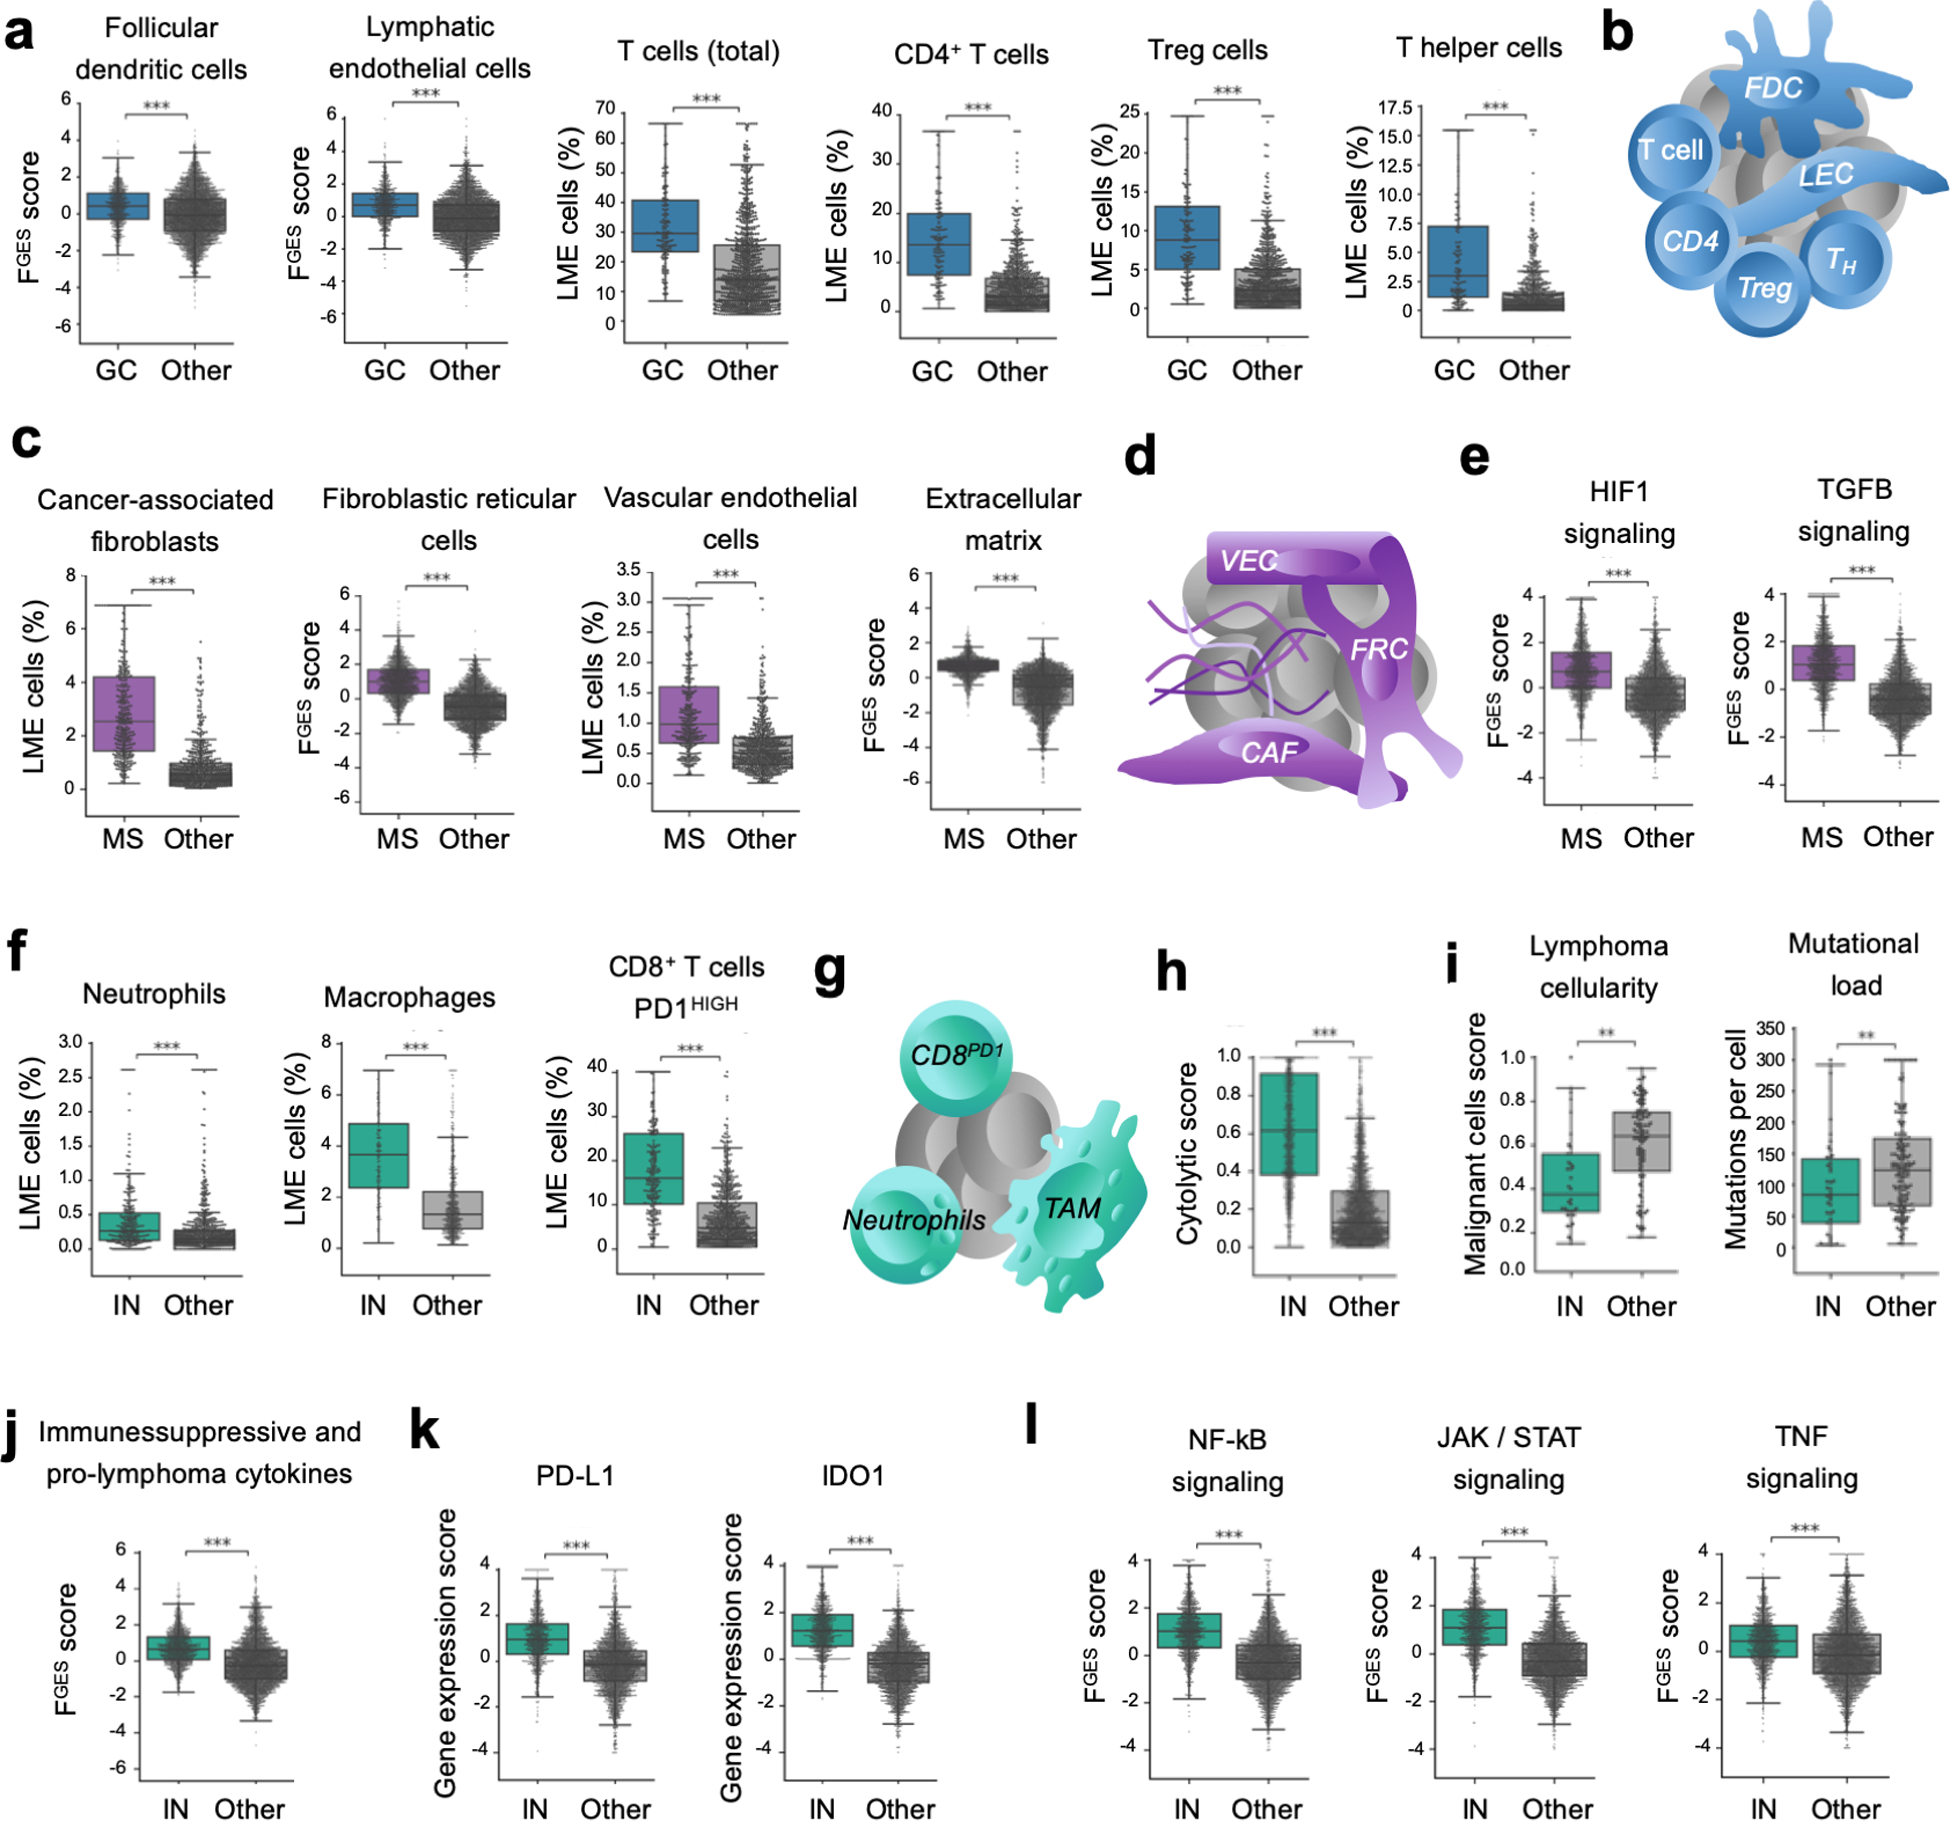
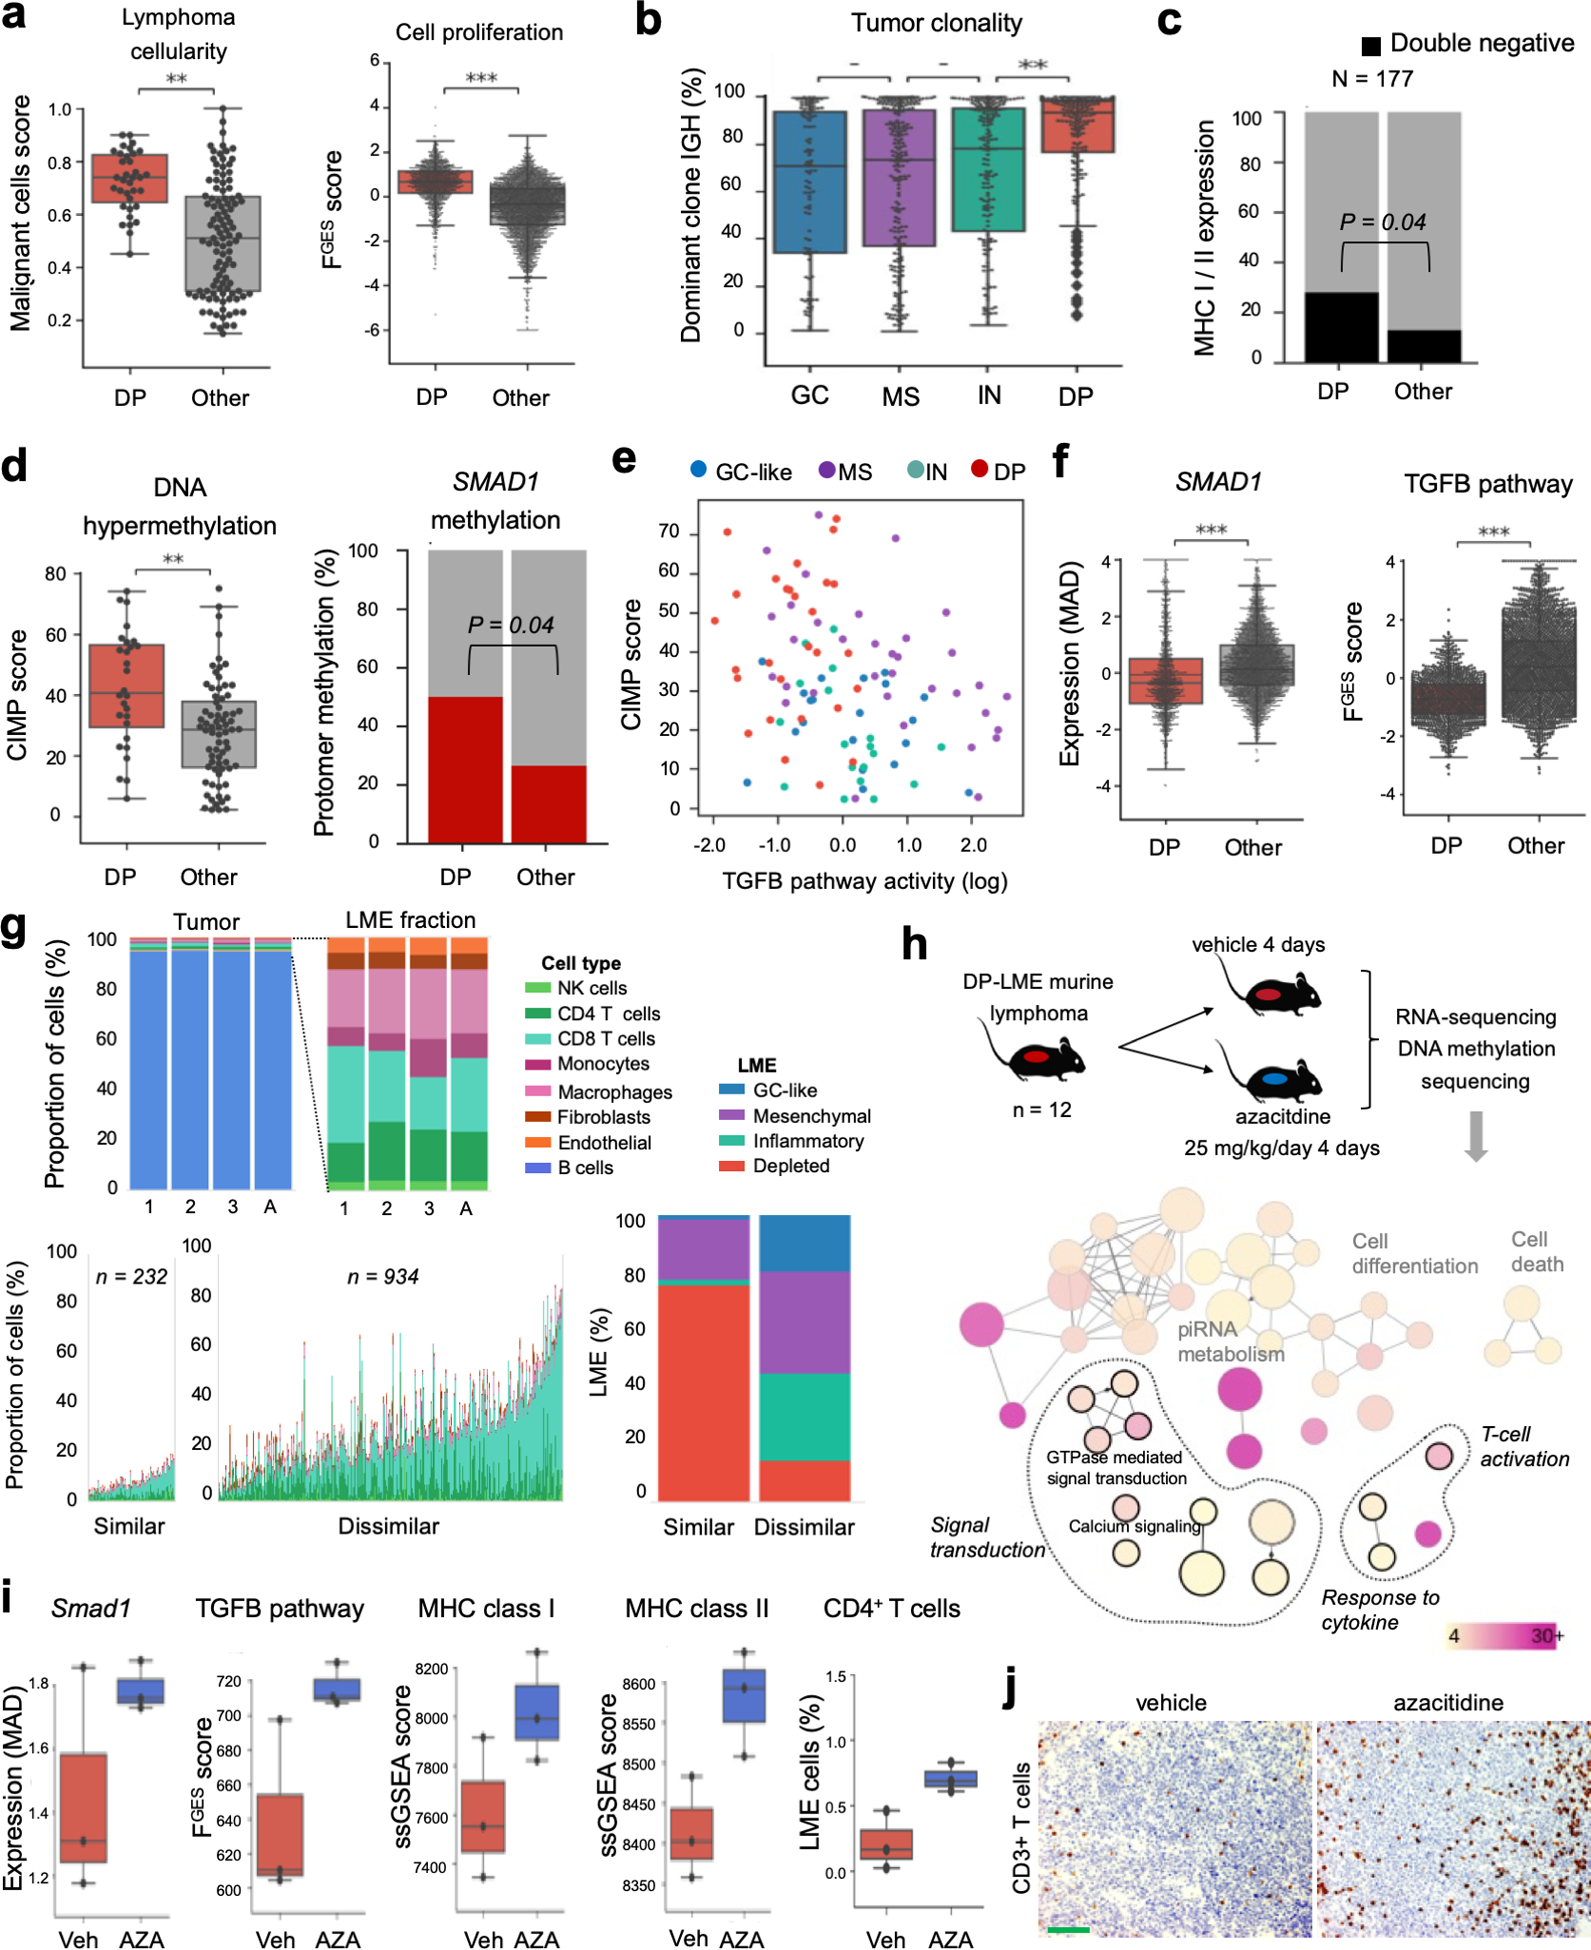
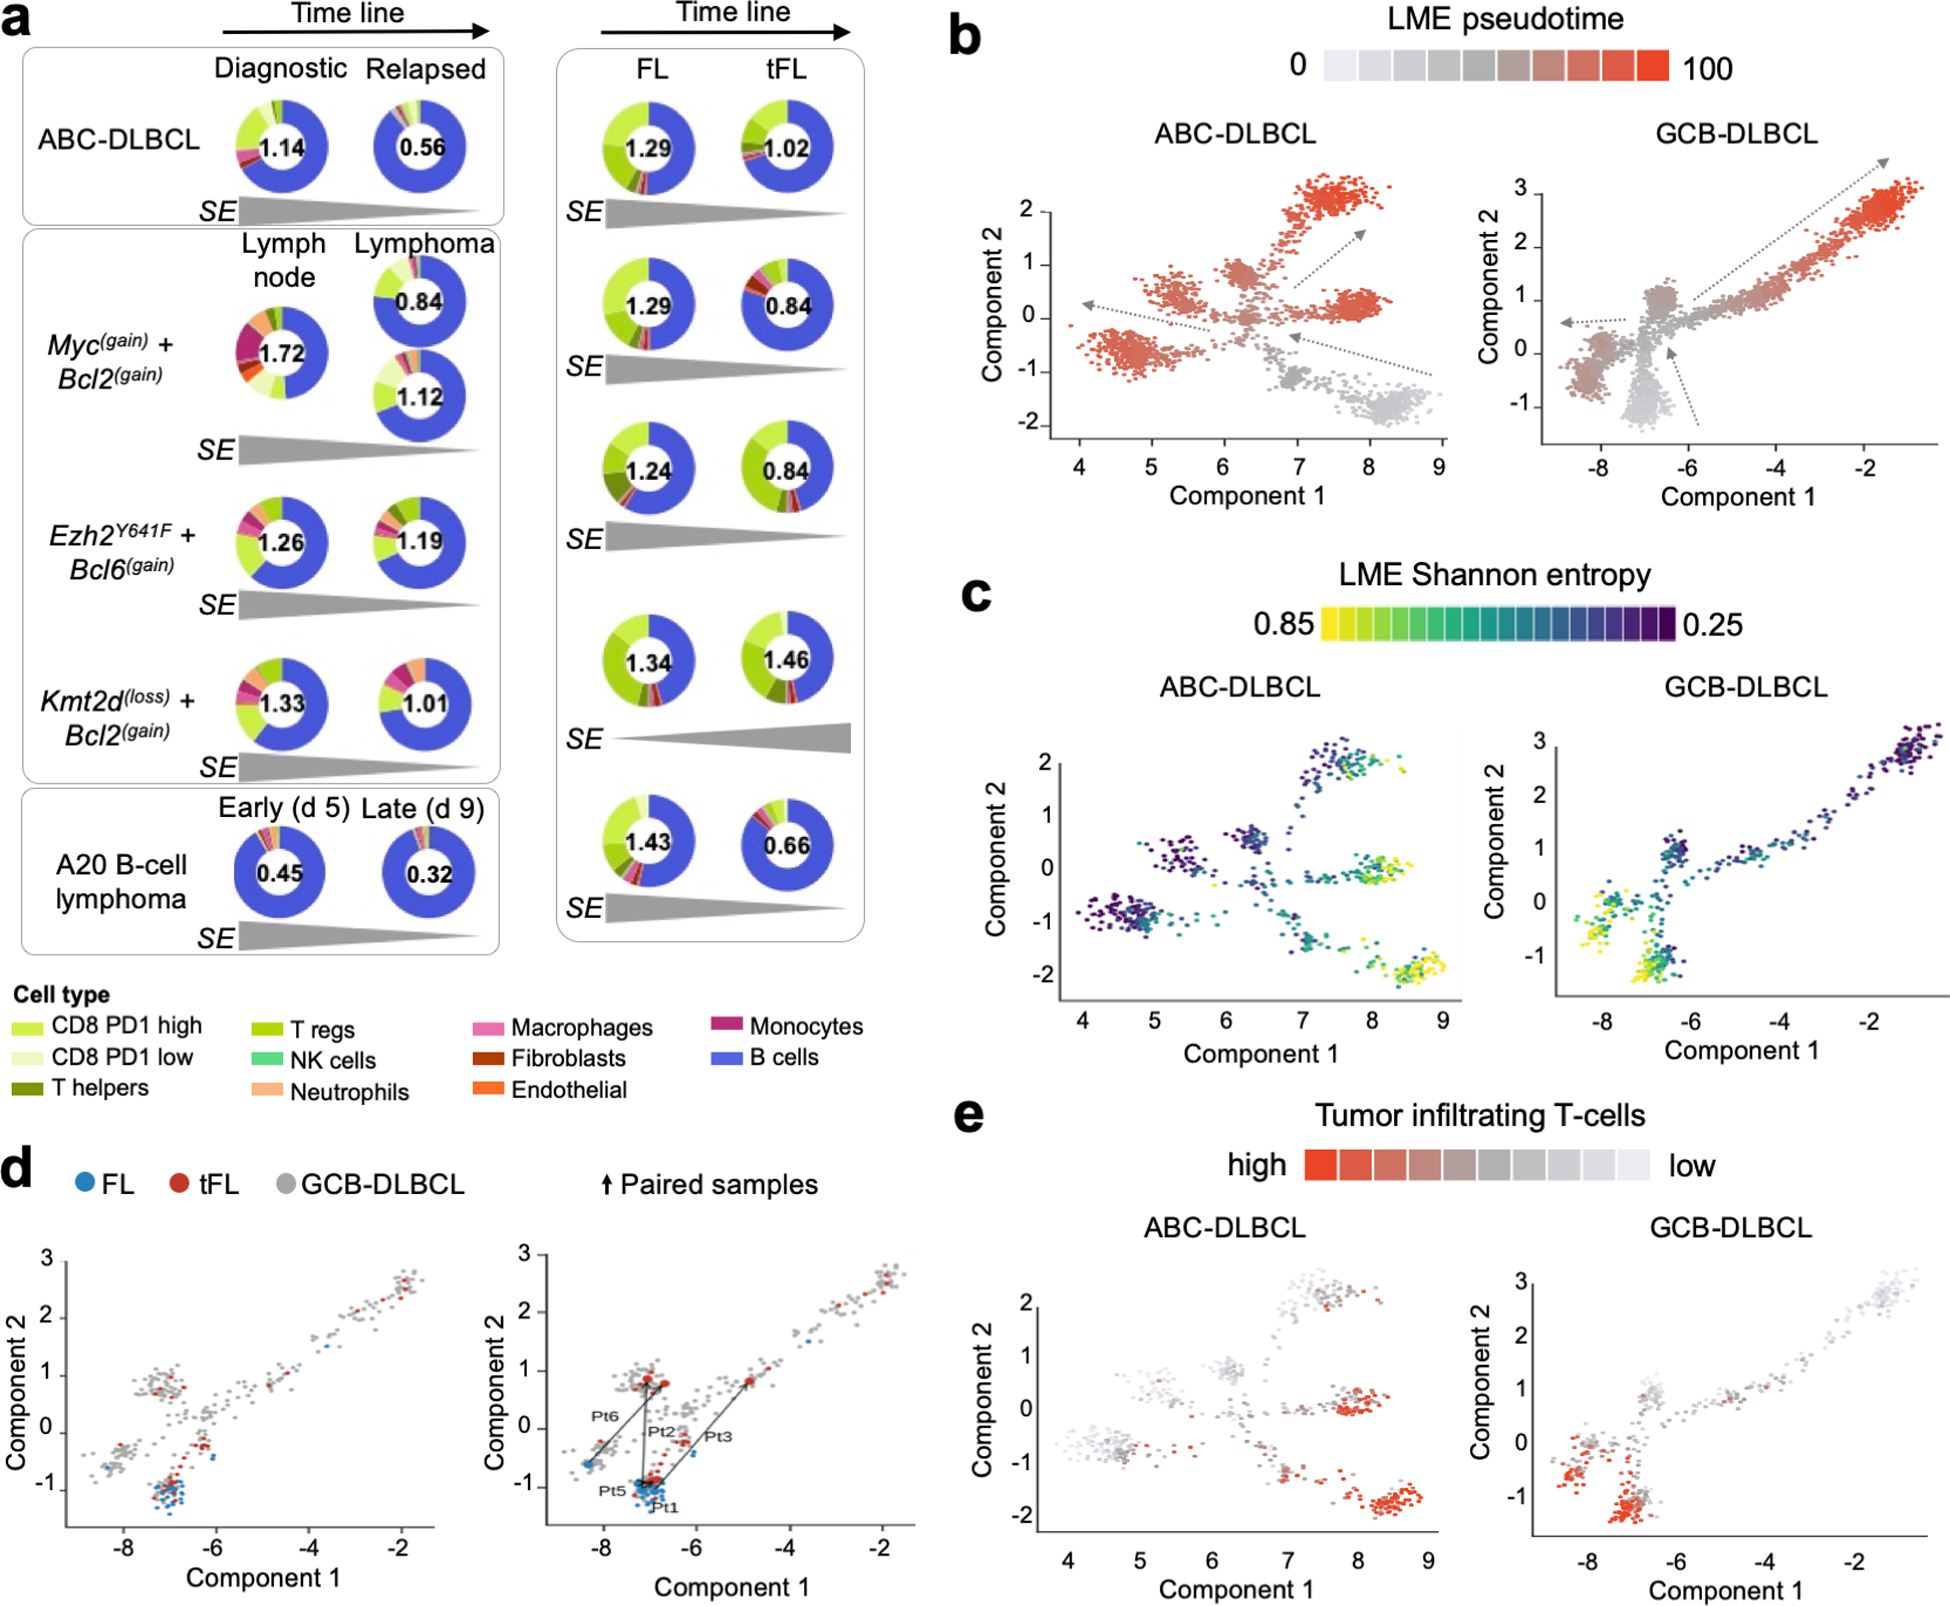
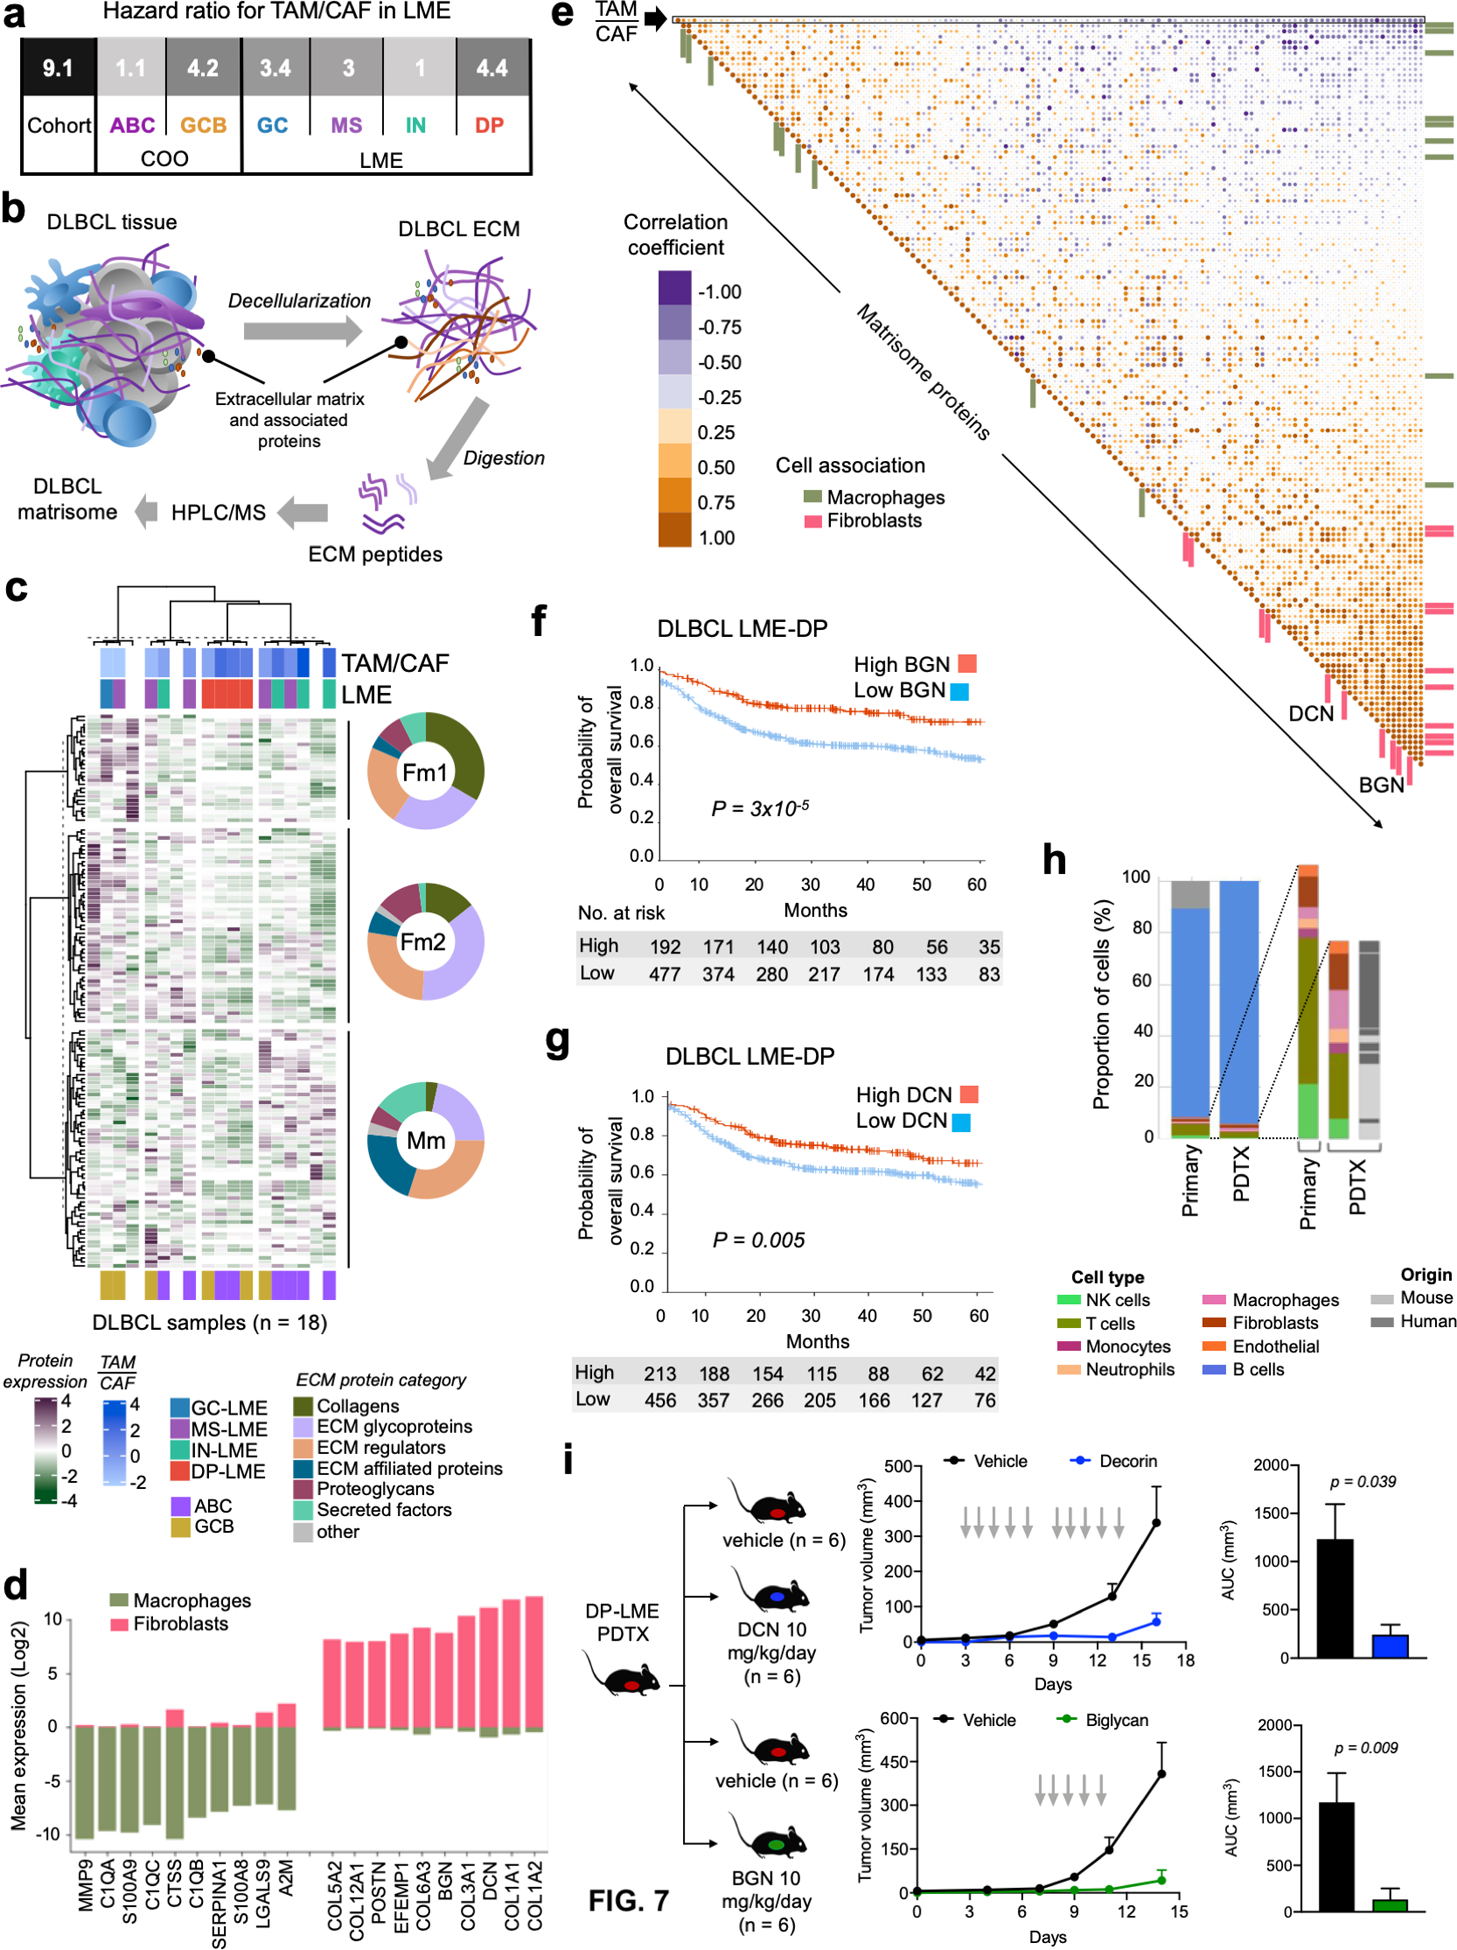
Diffuse large B-cell lymphoma (DLBCL) is a biologically and clinically heterogeneous disease. Transcriptomic and genetic characterization of DLBCL has increased the understanding of its intrinsic pathogenesis and provided potential therapeutic targets. However, the role of the microenvironment in DLBCL biology remains less understood. Here, we performed a transcriptomic analysis of the microenvironment of 4,655 DLBCLs from multiple independent cohorts and described four major lymphoma microenvironment categories that associate with distinct biological aberrations and clinical behavior. We also found evidence of genetic and epigenetic mechanisms deployed by cancer cells to evade microenvironmental constraints of lymphoma growth, supporting the rationale for implementing DNA hypomethylating agents in selected patients with DLBCL. In addition, our work uncovered new therapeutic vulnerabilities in the biochemical composition of the extracellular matrix that were exploited to decrease DLBCL proliferation in preclinical models. This novel classification provides a road map for the biological characterization and therapeutic exploitation of the DLBCL microenvironment. SIGNIFICANCE: In a translational relevant transcriptomic-based classification, we characterized the microenvironment as a critical component of the B-cell lymphoma biology and associated it with the DLBCL clinical behavior establishing a novel opportunity for targeting therapies.This article is highlighted in the In This Issue feature, p. 1307.


Conflict of interest statement

Conflict of interest:

J.P.L. served as a consultant for Sutro, Miltenyi, AstraZeneca, Epizyme, Roche/Genentech, BMS/Celgene, Regeneron, ADC Therapeutics, MEI Pharma, Bayer and Gilead/Kite. N.K., A.B., Z.A., V.S., E.T., N.K., N.M., F.F., M.T., N.A. and N.F. hold shares in BostonGene. A.M.M. received research funding from Sanofi and Janssen, served as consultant for Epizyme, Constellation and Jubiland, and served as scientific advisor for KDAC. L.C. received research funding from BMS/Celgene. All other authors declare no competing interests.

Figures

Figure 1.
Figure 1.. Transcriptomics analysis distinguishes four distinct subtypes of the DLBCL microenvironment.
a. Overview of the transcriptomic approach to identify lymphoma microenvironment (LME) signatures in DLBCL. b. Association between functional gene expression signatures (FGES) represented on the y-axis with cell types on the x-axis where different colors represent unique cell types following the palette shown in a. The strength of the association is represented with red intensities with light grey indicating no association. c. Activity score of the “cell proliferation” FGES represented across B-cell lymphomas including 130 follicular lymphomas (FL), 4,655 diffuse large B-cell lymphomas (DLBCL) and 196 Burkitt lymphomas (BL). d. Spearman rank correlation between the activity score of the “cell proliferation” FGES and the percentage of Ki67 positive nuclei determined by immunohistochemistry in 532 B-cell lymphomas. e. Heat map of the activity scores of 25 FGES (x-axis) denoting four major LME clusters termed as GC-like, mesenchymal, inflammatory and depleted. Individual datasets are indicated by different colors. LEC: lymphatic endothelial cells, VEC: vascular endothelial cells, CAF: cancer-associated fibroblasts, FRC: fibroblastic reticular cells, ECM: extracellular matrix, IS/PL: immune suppressive / pro-lymphoma, IA/AL: immune activating / anti-lymphoma, FDC: follicular dendritic cells, MHC: major histocompatibility complex, TFH: follicular T-helper cells, TIL: tumor infiltrating lymphocytes, NK: natural killer cells. ***p < 0.001.
Figure 2.
Figure 2.. Association of LME categories with genomic alterations in DLBCL cells.
a. Distribution of the DLBCL cell-based COO transcriptomic signature subgroups within the LME categories. b. Distribution of DLBCL genomic subtypes MCD, N1, A53, BN2, ST2, EZB, composite and others within LME categories. c. LME cellular composition (first column for primary samples and second columns for their patient-derived tumor xenograft) and LME origin (mouse vs. human, third column). Upper columns represent percentage of total LME cells and lower columns the percentage of stromal LME cells. The proportion of LME vs. lymphoma cells in primary samples is shown on top of the columns. d. Mutations and copy number alterations significantly enriched (Fisher T-test) in a particular LME category. Alterations also significantly enriched in a COO subgroup are indicated. e. Oncoplot for genomic alterations affecting the proliferation pathway genes CDKN2A, TP53 and CCND3 by LME category. f. Prevalence of proliferation pathway genomic alterations by LME category according to their expected random distribution. The number of cases with these genomic alterations is shown. g. Oncoplot for genomic alterations affecting antigen presentation genes B2M, CIITA and EZH2, and G-protein signaling pathway genes GNAI2, GNA13 and P2RY8 by LME categories. h. Prevalence of antigen presentation and G-protein signaling pathways genomic alterations by LME category according to their expected random distribution. The number of cases with these genomic alterations in each category is shown.
Figure 3.
Figure 3.. Association of DLBCL LME categories with clinical outcome.
a. Response to chemoimmunotherapy (R-CHOP) in a balanced cohort (n = 105) or responsive and non-responsive (refractory and relapsed) DLBCL patients according to the LME category. b-c. Kaplan-Meier models of overall survival (OS) and progression-free survival (PFS), respectively, according to DLBCL LME category. d. PFS at 24 months (PFS24) in DLBCL patients according to the LME category. Censored patients are not shown. e. Kaplan-Meier models of PFS according to LME category in ABC- and GCB-DLBCL subgroups. Only statistically significant pairwise comparisons are shown. f. Contribution individual LME cellular subtypes to the OS hazard ratio (HR) (log with 95% confidence interval) in ABC- (top) and GCB-DLBCLs (bottom). g. PFS hazard ratio (HR) plots (log with 95% confidence interval) for LME category, COO subgroup and IPI. h. Kaplan-Meier models of OS for HGBL-DH patients segregated into favorable prognosis LMEs (GC-like and MS) and unfavorable prognosis LMEs (IN and DP). i. Kaplan-Meier models of OS for DHITsig-positive patients segregated into favorable prognosis LMEs (GC-like and MS) and unfavorable prognosis LMEs (IN and DP). j. OS hazard ratio (HR) plots (log with 95% confidence interval, n = 2,047) for LME category, COO subgroup, IPI and DHITsig status.
Figure 4.
Figure 4.. Distinct cellular communities define DLBCL LME categories.
a. Proportion of LME cells significantly enriched in the GC-like LME obtained by cell deconvolution algorithms or functional gene expression signatures. b. Schematic representation of selected features of GC-like-LME. FDC: follicular dendritic cells, LEC: lymphatic endothelial cells. TFH: follicular T helper cells. c. Proportion of LME cells significantly enriched in the MS LME obtained by cell deconvolution algorithms or functional gene expression signatures. d. Schematic representation of selected features of MS-LME. VEC: vascular endothelial cells, FRC: fibroblastic reticular cells, CAF: cancer-associated fibroblasts. e. HIF1 (hypoxia) and TGFB pathways activity. f. Proportion of LME cells significantly enriched in the IN LME obtained by cell deconvolution algorithms. g. Schematic representation of selected features of IN-LME. TAM: tumor-associated macrophages. h. Cytolytic score in the IN-LME vs. other LMEs. i. Lymphoma cellularity (proportion of malignant cells) and mutational load (number of mutations per cell) in DLBCL containing IN-LME vs. other LMEs. j. Immune suppressive / pro-lymphoma cytokines FGES in the IN-LME vs. other LMEs. k. Expression of PD-L1 and IDO1 in lymphomas with IN-LME vs. other LMEs. l. NF-kB, JAK/STAT and TNF-alpha pathways activity. **p<0.01, ***p<0.001
Figure 5.
Figure 5.. Pharmacologically reversible epigenetic mechanisms of ME evasion.
a. Proportion of malignant cells and proliferative activity of DLBCL with DP-LME. b. Tumor clonality (fraction of dominant clone by IGH). c. Proportion in MHC class I and II double negative by immunohistochemistry analysis of 177 DLBCL comparing DP-LME vs. other LMEs patients. d. Genome wide aberrant DNA hypermethylation CIMP score and specific SMAD1 gene promoter methylation in DP-LME vs. other LMEs. e. Correlation plot between CIMP score and TGF pathway activity (PROGEny) in DLBCL according to their respective LMEs. f. SMAD1 gene expression and TGF pathway activity in the full cohort of DLBCL. g. Characterization of the LME in the syngeneic murine B-cell lymphoma model A20 by the LME similarity score. LME human DLBCLs with the highest 20% of similarity score (n = 232) to A20 LME showed enrichment of immune deserted LMEs (96%) with higher proportion of DP-LMEs (78%). h. Schedule of azacytidine administration in A20 mice and tissue analysis (top). Selection of pathways from differentially hypomethylated and overexpressed genes from the A20 mice treated with azacytidine (bottom). The color bar indicates the percent of genes associated with a pathway and the size of the circles the number of genes in a pathway. i. Smad1 expression, TGF pathway activity, MHC class I and II expression and proportion of deconvoluted CD4+ T cells in the A20 lymphomas treated with azacytidine. j. Representative pictures of CD3 immunostaining of A20 lymphomas treated with azacitidine. The bar represents 100 μm. **p<0.01, ***p<0.001
Figure 6.
Figure 6.. Changes in LME cellular composition during lymphoma progression.
a. LME cellular heterogeneity measured as Shannon entropy (SE) as function of lymphoma progression. Early and late time points include: matched ABC-DLBCL primary and relapsed case, three GEMMs comparing pre-malignant lymph node niches and lymphoma niches, A20 syngeneic B-cell lymphoma model at days 5 and 9 after implantation and five paired indolent FL phase and at the moment of transformation. The SE metric is shown inside every donut plot and the tendency over time is shown at the bottom for each pair. The proportion of cell populations including B-cells are represented in the donut plot. b. Pseudotime analysis of LME progression in ABC and GCB-DLBCLs. c. LME Shannon entropy analysis imposed on the LME pseudotime analysis. d. LME of FL, tFL and de novo GCB-DLBCLs imposed on the LME pseudotime of GCB-DLBCLs (left). Paired FL-tFL samples (n = 5) shown on the LME pseudotime of GCB-DLBCLs (right). e. Analysis of proportion of tumor infiltrating T cells imposed on the pseudotime analysis of BC and GCB-DLBCLs. Density of T cells is shown as color scale.
Figure 7.
Figure 7.. The DLBCL ECM produced by CAFs and TAMs influences lymphoma biology.
a. Probability of overall survival (OS) for the ratio of CAF/TAM proportions in the LME of DLBCLs for the full cohort, COO classes and LME subtypes. b. Graphical representation of the DLBCL matrisome experiments c. Matrisome heat map of 18 DLBCL samples (x-axis) and 136 proteins (y-axis) by unsupervised hierarchical clustering. Donut plots show the breakdown of the ECM proteins category for each of the three matreotype clusters termed Fm1, Fm2 and Mm. For the 14 samples with available RNA-seq, the TAM/CAF ratio, LME cluster and the COO are shown. d. Top-10 and bottom-10 transcripts of matrisome proteins according to their relative abundance in fibroblasts and macrophages. e. Pearson’s correlation matrix of TAM/CAF ratio and the 136 matrisome proteins. Proteins associated with fibroblasts and macrophages (from d) are depicted with distinct color bars and decorin (DCN) and biglycan (BGN) are shown. f-g. Kaplan-Meier model of OS according to BGN (f) and DCN (g) abundance for DLBCL LME-DP patients. h. Cellular composition by transcript deconvolution of primary DLBCL LME-DP and its PDTX model. Expansion of the LME cellular composition in the primary and PDTX model and indication whether these cells in PDTX are of human or mouse origin. i. DLBCL growth curve (left) and area under the curve (AUC) of tumor volume (right) of a DLBCL LME-DP PDTX treated with vehicle vs. DCN (top) or vehicle vs. BGN (bottom).

References

    1. Frontzek F, Lenz G. Novel insights into the pathogenesis of molecular subtypes of diffuse large B-cell lymphoma and their clinical implications. Expert Rev Clin Pharmacol 2019;12(11):1059–67 doi 10.1080/17512433.2019.1683447. - DOI - PubMed
    1. Chapuy B, Stewart C, Dunford AJ, Kim J, Kamburov A, Redd RA, et al. Molecular subtypes of diffuse large B cell lymphoma are associated with distinct pathogenic mechanisms and outcomes. Nat Med 2018;24(5):679–90 doi 10.1038/s41591-018-0016-8. - DOI - PMC - PubMed
    1. Schmitz R, Wright GW, Huang DW, Johnson CA, Phelan JD, Wang JQ, et al. Genetics and Pathogenesis of Diffuse Large B-Cell Lymphoma. N Engl J Med 2018;378(15):1396–407 doi 10.1056/NEJMoa1801445. - DOI - PMC - PubMed
    1. Wright GW, Huang DW, Phelan JD, Coulibaly ZA, Roulland S, Young RM, et al. A Probabilistic Classification Tool for Genetic Subtypes of Diffuse Large B Cell Lymphoma with Therapeutic Implications. Cancer Cell 2020;37(4):551–68 e14 doi 10.1016/j.ccell.2020.03.015. - DOI - PMC - PubMed
    1. Johnson NA, Savage KJ, Ludkovski O, Ben-Neriah S, Woods R, Steidl C, et al. Lymphomas with concurrent BCL2 and MYC translocations: the critical factors associated with survival. Blood 2009;114(11):2273–9 doi 10.1182/blood-2009-03-212191. - DOI - PMC - PubMed

Publication types

MeSH terms