. 2021 Feb 4;11(1):106.
doi: 10.1038/s41398-021-01223-y.

Cntn4, a risk gene for neuropsychiatric disorders, modulates hippocampal synaptic plasticity and behavior

Affiliations

Cntn4, a risk gene for neuropsychiatric disorders, modulates hippocampal synaptic plasticity and behavior

Asami Oguro-Ando et al. Transl Psychiatry. .

Abstract

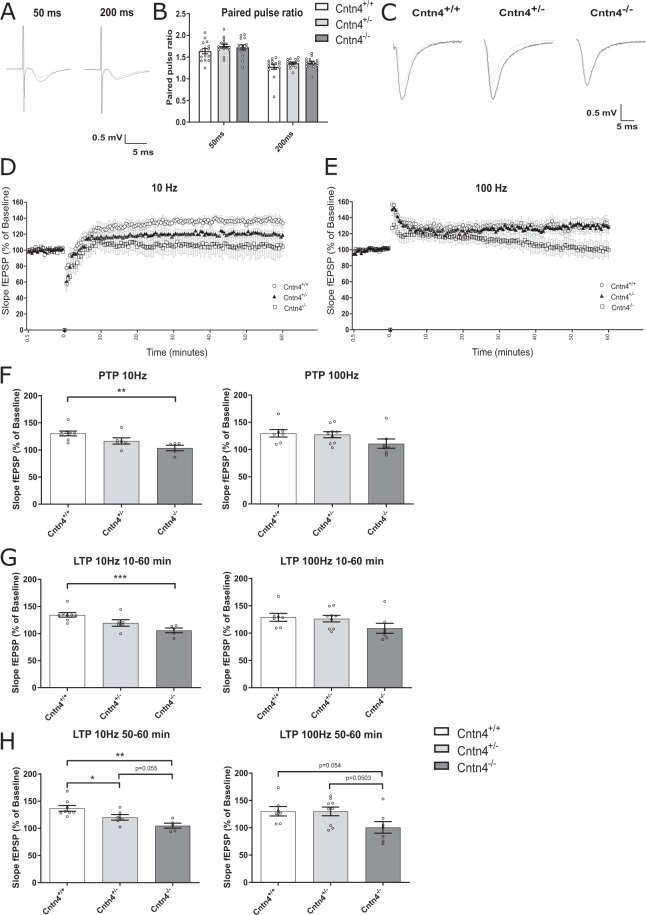
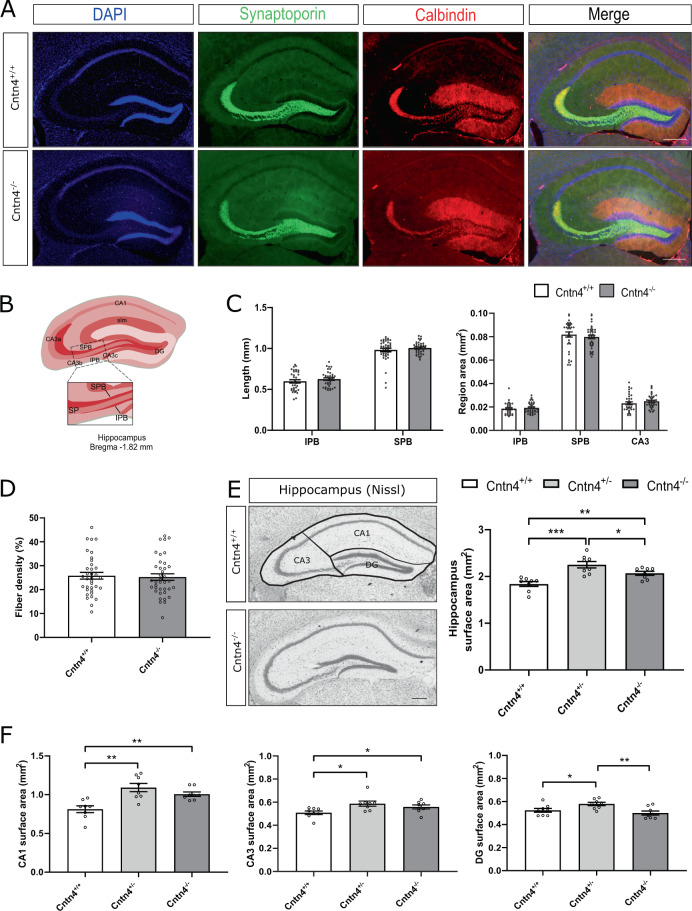
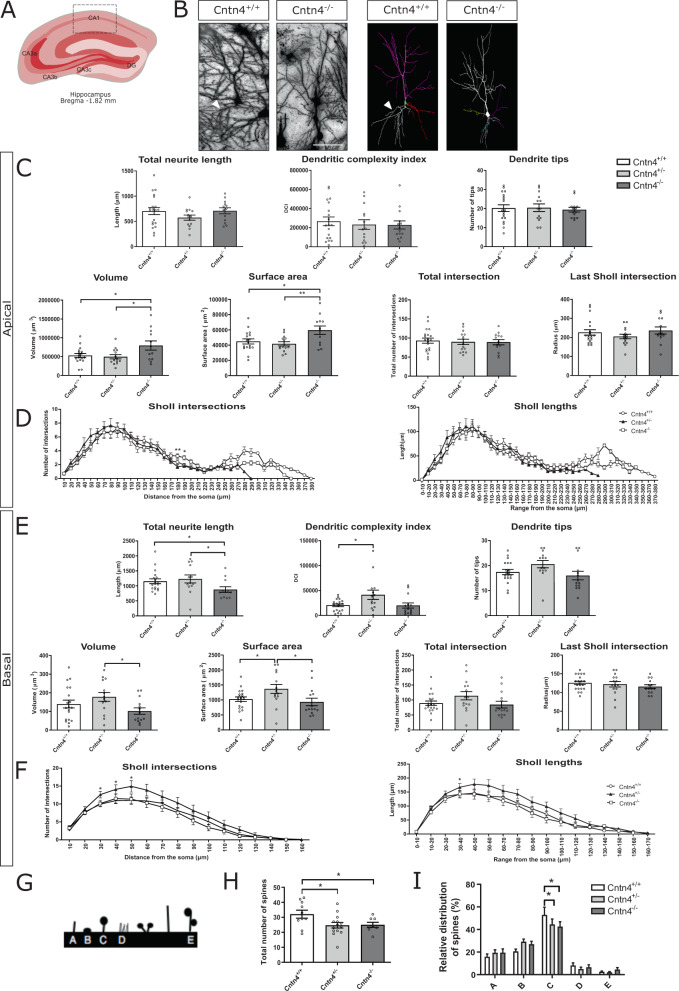
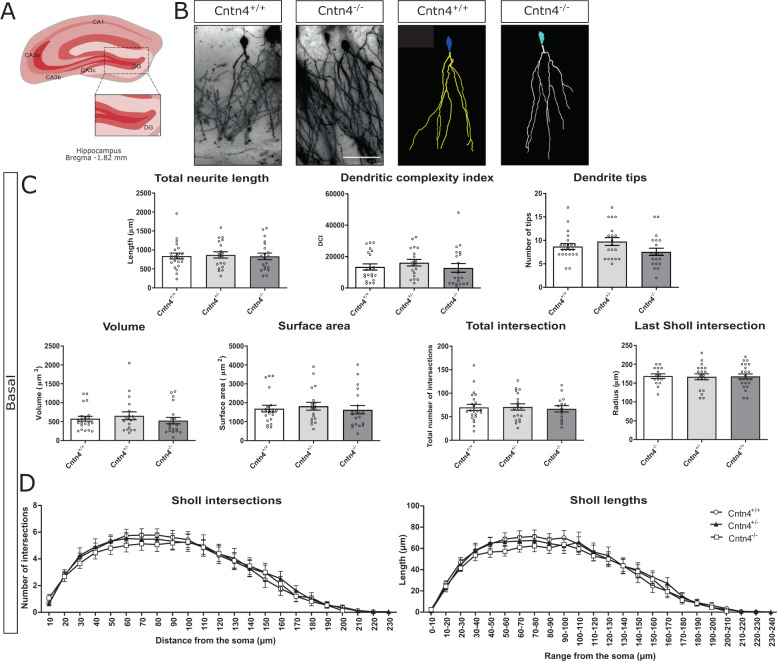
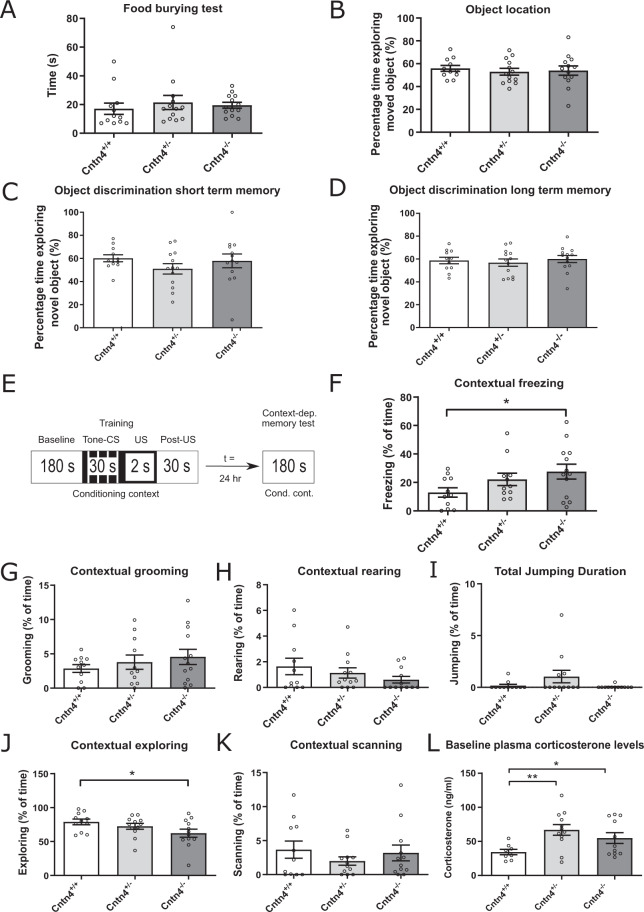
Neurodevelopmental and neuropsychiatric disorders, such as autism spectrum disorders (ASD), anorexia nervosa (AN), Alzheimer's disease (AD), and schizophrenia (SZ), are heterogeneous brain disorders with unknown etiology. Genome wide studies have revealed a wide variety of risk genes for these disorders, indicating a biological link between genetic signaling pathways and brain pathology. A unique risk gene is Contactin 4 (Cntn4), an Ig cell adhesion molecule (IgCAM) gene, which has been associated with several neuropsychiatric disorders including ASD, AN, AD, and SZ. Here, we investigated the Cntn4 gene knockout (KO) mouse model to determine whether memory dysfunction and altered brain plasticity, common neuropsychiatric symptoms, are affected by Cntn4 genetic disruption. For that purpose, we tested if Cntn4 genetic disruption affects CA1 synaptic transmission and the ability to induce LTP in hippocampal slices. Stimulation in CA1 striatum radiatum significantly decreased synaptic potentiation in slices of Cntn4 KO mice. Neuroanatomical analyses showed abnormal dendritic arborization and spines of hippocampal CA1 neurons. Short- and long-term recognition memory, spatial memory, and fear conditioning responses were also assessed. These behavioral studies showed increased contextual fear conditioning in heterozygous and homozygous KO mice, quantified by a gene-dose dependent increase in freezing response. In comparison to wild-type mice, Cntn4-deficient animals froze significantly longer and groomed more, indicative of increased stress responsiveness under these test conditions. Our electrophysiological, neuro-anatomical, and behavioral results in Cntn4 KO mice suggest that Cntn4 has important functions related to fear memory possibly in association with the neuronal morphological and synaptic plasticity changes in hippocampus CA1 neurons.


Conflict of interest statement

The authors declare that they have no conflict of interest.

Figures

Fig. 1
Fig. 1. The effect of Cntn4 deficiency on hippocampal synaptic potentiation.
A Representative fEPSP traces of the paired pulse ratio (PPR) recorded in the CA1 area of each mouse genotype at 50 ms (left) and 200 ms interval (right). To allow comparison between traces, the response to the first (gray) and second pulse (black) are here superimposed. B Paired pulse ratio (expressed as [slope second pulse/slope first pulse]*100%) in the hippocampal region at 50 ms and 200 ms inter-stimulus interval. Data between genotypes was analyzed by two-way ANOVA (p = 0.07). C Representative individual fEPSP traces taken from each genotype. The gray traces represent the baseline fEPSP, the black trace was taken between 50 and 60 min after tetanic stimulation. D Stimulation with 900 pulses at 10 Hz induced synaptic potentiation in the CA1 region of hippocampal slices in all groups. E Stimulation with 900 pulses at 100 Hz induced synaptic potentiation in the CA1 region of hippocampal slices in all groups. F Average post-tetanic potentiation (PTP) measurements at 10 Hz and 100 Hz, respectively. p = 0.003. G Average synaptic potentiation over 60 min (i.e., from 10 to 60 min post-tetanus) at 10 Hz and 100 Hz. P = 0.0009. H Average synaptic potentiation between 50–60 min (i.e., from period between 50 to 60 min post-tetanus) at 10 Hz and 100 Hz. 10 Hz: Cntn4+/+ vs. Cntn4+/- p = 0.047; Cntn4+/+ vs. Cntn4-/- p = 0.001; Cntn4+/- vs. Cntn4-/- p = 0.055. 100 Hz: Cntn4+/+ vs. Cntn4-/- p = 0.0503; Cntn4+/- vs. Cntn4-/- p = 0.054. 10 Hz Cntn4+/+: n = 8, Cntn4+/-: n = 6, Cntn4-/-: n = 5. 100 Hz Cntn4+/+: n = 7, Cntn4+/-: n = 9, Cntn4-/-: n = 7 mice. Data are expressed as means ± S.E.M.
Fig. 2
Fig. 2. Hippocampal mossy fiber distribution in Cntn4-deficient mice.
A Representative image of synaptoporin (green) and calbindin (red) expression in adult Cntn4+/+ and Cntn4-/- hippocampi. DAPI is in blue. The scale bars represent 250 µm. B Schematic representation of the adult mouse hippocampus. The rectangle indicates the area and location used for quantification of mossy fiber crossings in the SP of the CA3. Abbreviations: CA1 cornu ammonis, CA3a-c cornu ammonis 3a-c, DG dentate gyrus, SPB suprapyramidal bundle, IPB infrapyramidal bundle, SP stratum pyramidale, slm stratum lacunosum-moleculare. C Quantification of the length (left panel) and area size (right panel) of the IPB, SPB, and CA3 in Cntn4+/+ and Cntn4-/- mice showed no difference between genotypes. Analysis was performed on at least three sections per brain from Cntn4+/+ and Cntn4-/- mice (n = 6 mice per genotype) using unpaired Student’s t test. Data are presented as mean ± S.E.M. D Quantification of percentage of mossy fibers crossing the SP did not reveal a difference between Cntn4+/+ and Cntn4-/- mice. Analysis was performed on at least three sections per brain from Cntn4+/+ and Cntn4-/- mice (n = 6 mice per genotype) using unpaired Student’s t test. Data are presented as mean ± S.E.M. E Nissl-stained sections of Cntn4+/+, Cntn4+/-, and Cntn4-/- mice demonstrated a significant difference in hippocampal surface areas between genotypes. F Tracing of hippocampal subsections revealed significant area differences across all regions. Analysis was performed on at least two sections per brain from Cntn4+/+, Cntn4+/-, and Cntn4-/- mice (n = 4 mice per genotype) using unpaired Student’s t test and one-way ANOVA. Data are presented as mean ± S.E.M, p = 0.0004, 0.004, 0.04 (total hippocampus); p = 0.001, 0.003 (CA1); p = 0.01, 0.048 (CA3); p = 0.03, 0.004 (DG).
Fig. 3
Fig. 3. Golgi analysis CA1.
Neuron morphology analysis results for Cntn4+/+, Cntn4+/-, and Cntn4-/- mouse hippocampus CA1. A Schematic representation of the hippocampus CA1 with labeled Bregma anterior-posterior. Adapted from Paxinos and Franklin, 2001. B Golgi staining in Cntn4+/+ and Cntn4-/- mouse hippocampus CA1 (left), exemplary tracings of pyramidal neurons (right). The scale bar represents 40 µm. The arrowheads show differences in basal neurite length. C, E Quantitative morphological results for the apical and basal dendrites respectively. p = 0.04, 0.03 (apical volume); p = 0.02, 0.007 (apical surface area); p = 0.04, 0.04 (basal total neurite length); p = 0.02 (basal dendritic complexity index); p = 0.02 (basal volume); p = 0.04, 0.04 (basal surface area). D, F Sholl plots indicate the distribution of respective apical and basal dendritic intersections and length at increasing distance from the center of the cell body. p = 0.004, 0.02 (apical Sholl intersection); p = 0.02, 0.05, 0.04 (basal Sholl intersection); p = 0.03 (basal Sholl lengths). Quantitative analysis was performed, in each area, on at least six slices in Cntn4+/+, Cntn4+/-, and Cntn4-/- mice (n = 5 mice per genotype). Data are presented as mean ± S. E. M, n = 19 (Cntn4+/+), n = 14 (Cntn4+/-), n = 14 mice (Cntn4-/-). G Schematic view of the five different spine morphology categories, A = thin; B = stubby; C = mushroom; D = abnormal (several types); E = double mushroom. Quantitative morphological data on the first 25 μm (50 μm to 75 μm) of Golgi-stained branches of the proximal part of the apical dendrite in pyramidal neurons of the CA1 hippocampus region in Cntn4+/+, Cntn4+/-, and Cntn4-/- mice indicate a significant difference in H total number of spines (including all morphological categories), and I relative distribution of mushroom spines. Data are presented as mean ± S. E. M, n = 10 (Cntn4+/+), n = 14 (Cntn4+/-), and n = 8 mice (Cntn4-/-), p = 0.04, 0.04 (total spine), p = 0.021, 0.029 (mushroom-type spines).
Fig. 4
Fig. 4. Golgi analysis DG.
Neuron morphology analysis results for Cntn4+/+, Cntn4+/-, and Cntn4-/- mouse hippocampus DG. A Schematic representation of the dentate gyrus with labeled Bregma anterior-posterior. Adapted from Paxinos and Franklin, 2001. B Golgi staining in Cntn4+/+ and Cntn4-/- mice DG (left), exemplary tracings of neurons (right). The scale bar represents 40 µm. C Quantitative morphological results for the basal dendrites. D Sholl plots indicate the distribution of basal dendritic intersections and length at increasing distance from the center of the cell body. Quantitative analysis was performed, in each area, on at least six slices in Cntn4+/+, Cntn4+/-, and Cntn4-/- mice (n = 5 mice per genotype). Data are presented as mean ± S. E. M, n = 22 (Cntn4+/+), n = 19 (Cntn4+/-), n = 20 mice (Cntn4-/-).
Fig. 5
Fig. 5. Cntn4-deficient mice demonstrate same responses in object discrimination and object location tasks but altered fear conditioning responses.
A Average time finding the piece of chow (sec) after 24 h of food restriction. The food finding time shows no significant difference between genotypes (n = 38 mice). B Average exploration time on moved object (%). Calculated as Timenovel/Timenovel+familiar. All genotypes spent more time exploring the moved object, however there was no significant difference in exploration time between them (n = 37 mice). C, D Short-term and long-term recognition memory, respectively, in terms of average exploration time on novel object (%). Calculated as Timenovel/Timenovel+familiar. All genotypes spent more time exploring the moved object, however there was no significant difference in exploration time between them (n = 36 mice). Bars represent the means, error bars indicate the standard error of mean (S.E.M.). E Schematic presentation of the fear conditioning test sequence. F Percentage of time spent freezing during 180 s of exposure to a conditional context (without simulation such as tone or foot shock). Cntn4-/- mice spent significantly more time freezing compared to Cntn4+/+ mice (p = 0.043, n = 35 mice). GI Percentage of time spent grooming, rearing and jumping during 180 s of exposure to a conditional context (without simulation such as tone or foot shock) revealed no significant genotype effect. There was no significant genotype effect (n = 35 mice). J Percentage of time spent exploring during 180 s of exposure to a conditional context (without simulation such as tone or foot shock). Cntn4-/- mice spent significantly more time exploring compared to Cntn4+/+ mice (p = 0.034, n = 35 mice). K Percentage of time spent scanning during 180 s of exposure to a conditional context (without simulation such as tone or foot shock) (n = 35 mice). L Average baseline plasma corticosterone levels (ng/ml) for each genotype. Both the Cntn4+/- and Cntn4-/- had significantly higher corticosterone levels than the Cntn4+/+ mice (p = 0.035 and p = 0.002, respectively; n = 31 mice). Bars represent the means, error bars indicate the standard error of mean (S.E.M.).

References

    1. World Health Organization. Depression and other common mental disorders: global health estimates. Geneva: World Health Organization; (2017). Licence: CC BY-NC-SA 3.0 IGO.
    1. Zhao Y, Castellanos FX. Annual research review: discovery science strategies in studies of the pathophysiology of child and adolescent psychiatric disorders - promises and limitations. J. Child Psychol. Psychiatry. 2016;57:421–439. doi: 10.1111/jcpp.12503. - DOI - PMC - PubMed
    1. Kirov G. CNVs in neuropsychiatric disorders. Hum. Mol. Genet. 2015;24:R45–R49. doi: 10.1093/hmg/ddv253. - DOI - PubMed
    1. Geschwind DH, Levitt P. Autism spectrum disorders: developmental disconnection syndromes. Curr. Opin. Neurobiol. 2007;17:103–111. doi: 10.1016/j.conb.2007.01.009. - DOI - PubMed
    1. Rubenstein JLR. Annual research review: development of the cerebral cortex: implications for neurodevelopmental disorders. J. Child Psychol. Psychiatry Allied Discip. 2011;52:339–355. doi: 10.1111/j.1469-7610.2010.02307.x. - DOI - PMC - PubMed

Publication types