. 2021 Feb 4;12(1):785.
doi: 10.1038/s41467-020-20787-9.

Gating the pore of the calcium-activated chloride channel TMEM16A

Affiliations

Gating the pore of the calcium-activated chloride channel TMEM16A

Andy K M Lam et al. Nat Commun. .

Abstract

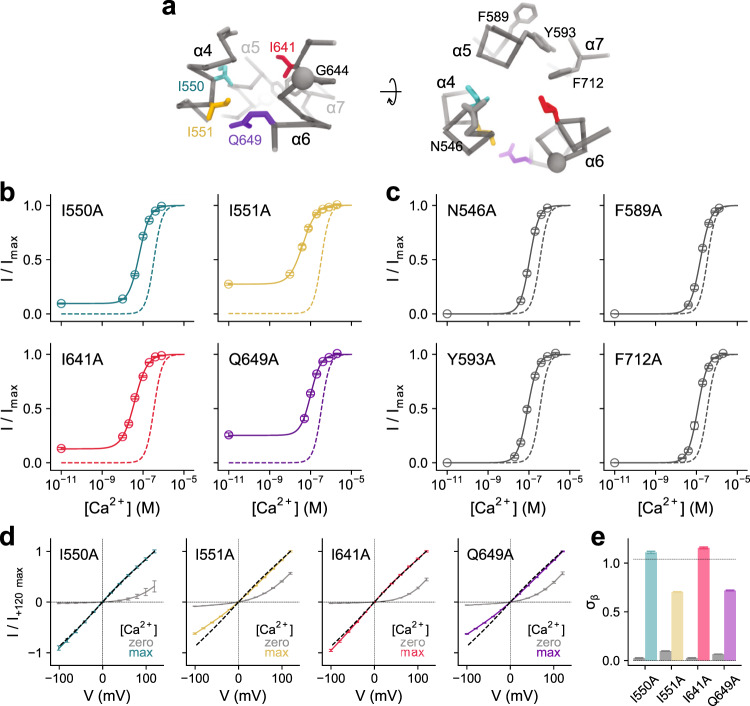
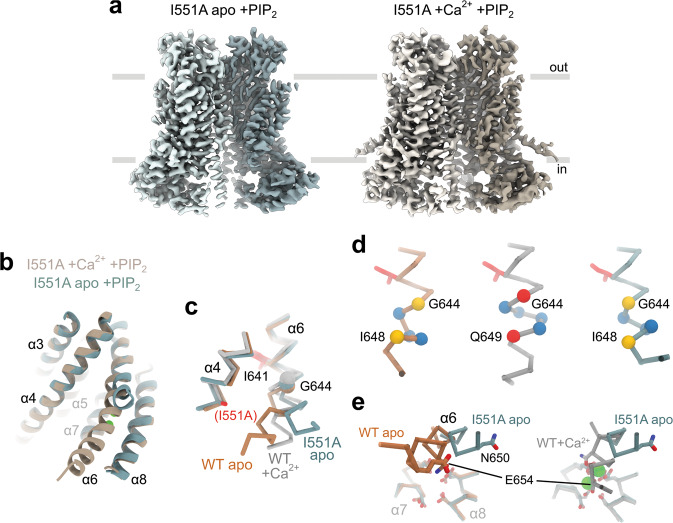
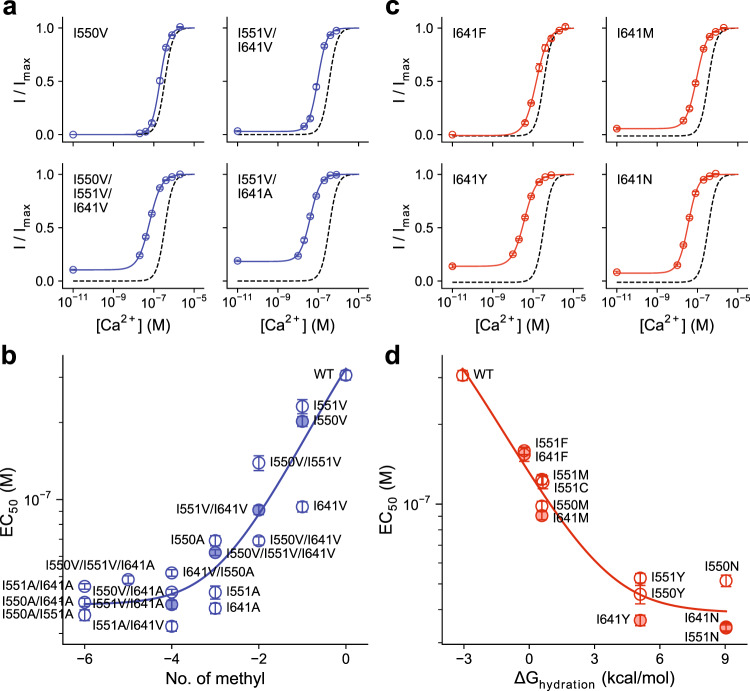
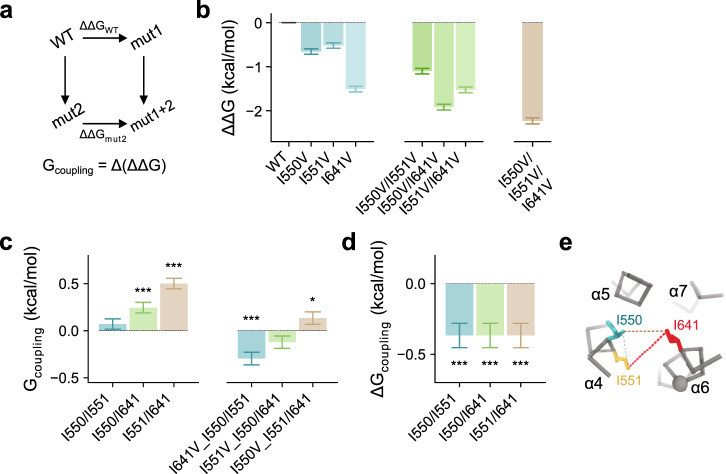
The binding of cytoplasmic Ca2+ to the anion-selective channel TMEM16A triggers a conformational change around its binding site that is coupled to the release of a gate at the constricted neck of an hourglass-shaped pore. By combining mutagenesis, electrophysiology, and cryo-electron microscopy, we identified three hydrophobic residues at the intracellular entrance of the neck as constituents of this gate. Mutation of each of these residues increases the potency of Ca2+ and results in pronounced basal activity. The structure of an activating mutant shows a conformational change of an α-helix that contributes to Ca2+ binding as a likely cause for the basal activity. Although not in physical contact, the three residues are functionally coupled to collectively contribute to the stabilization of the gate in the closed conformation of the pore, thus explaining the low open probability of the channel in the absence of Ca2+.


Conflict of interest statement

The authors declare no competing interests.

Figures

Fig. 1
Fig. 1. Characterization of pore residues by systematic mutagenesis.
a Cα representation of the pore contained in a single subunit of TMEM16A (PDB: 5OYB) with different regions indicated. Blue surface encloses the water-accessible volume of the pore calculated in HOLE with a probe radius of 1.15 Å. be Summary of Ca2+ concentration-response relationships of Ala mutants in different regions of the pore. b Outer vestibule, c neck, d inner vestibule, and e Ca2+ binding site. Red indicates a left-shift, and blue a right-shift in the EC50. Left, sections of the pore with Cα atoms of selected mutated residues shown as spheres and colored according to the effect on Ca2+ potency. Center, Ca2+ potencies of mutants. The logarithm of the fold-change in EC50 of each investigated residue compared to wild type (WT) is shown. Individual measurements are displayed as circles, bars show averages of the indicated number of patches shown in Supplementary Tables 1–3, and errors are SEM. Right, histogram of EC50 shifts in the corresponding region. a, e Ca2+-binding residues are shown as sticks and bound Ca2+ ions as green spheres.
Fig. 2
Fig. 2. Functional properties of mutants forming the gate.
a Cα representation of the entrance to the narrow region of the pore in TMEM16A. Sidechains of selected residues are displayed. The relationship of views is indicated. b, c Concentration-response relations of selected mutants of the inner neck region with left-shifted EC50 for b, residues showing basal activity and c, residues not showing pronounced basal activity. Data are averages of the indicated number of patches shown in Supplementary Tables 1–3, errors are SEM. Solid lines are fits to the Hill equation. Dashed lines show the relation of WT. d Instantaneous I-V relations of mutants that display basal activity at zero and saturating Ca2+ concentrations. Dashed lines show the relation of WT at saturating Ca2+ concentrations. Data are averages of 5, 10, 7, and 13 patches for I550A, I551A, I641A, and Q649A respectively, errors are SEM. Solid lines are fits to a model of ion permeation (Eq. 2). e Values of σβ, corresponding to the relative rate of conduction at the inner pore close to the Ca2+ binding site (see “Methods”), for mutants displaying basal activity at zero and saturating Ca2+ concentrations. Dashed line indicates the value of WT at saturating Ca2+ concentrations. Bars indicate the best-fit values of the averaged data shown in d. Errors are 95% confidence intervals.
Fig. 3
Fig. 3. Structural features of a constitutively active mutant.
a Cryo-EM map of mouse TMEM16A-I551A in the absence (left) and presence (right) of 1 mM Ca2+ supplemented with 1.5 mM diC8-PI(4,5)P2 in GDN at 3.3 and 4.1 Å respectively. The view is from within the membrane, with the extracellular side at the top. b Superposition of the pore region (α3–α8) of the apo and Ca2+-bound mutant structures in ribbon representation. The view is rotated by ~45° around the dimer axis compared to a. c Superposition of α4 and α6 of the indicated structures in Cα representation. The Cα of Gly 644 is shown as sphere, the sidechains of Ile 641 and the mutation I551A in the mutant structure as sticks. The apo and Ca2+-bound structures of WT were previously reported (PDB: 5OYG and 5OYB respectively). d Section of α6 around Gly 644. Yellow spheres depict respective pairs of hydrogen-bonded positions in α-helix conformation, red spheres depict a pair of interacting residues in π-helix conformation, and blue spheres indicate the Cα positions in between. e Superposition of the Ca2+ binding sites of indicated structures viewed from within the membrane. The protein is shown in Cα representation, and sidechains of Ca2+ binding residues as sticks. d, e The coloring of the Cα-traces is as in c. b, e Ca2+ ions in the Ca2+-bound structure are shown as green spheres.
Fig. 4
Fig. 4. Energetic contribution of hydrophobic volume and hydration energy of gate residues.
a Selected concentration-response relations of mutants with decreasing hydrophobic volume of gate residues. b Relationship between EC50 change and hydrophobic volume decrease. The effective contribution of each methyl group was estimated to be 0.83 ± 0.21 kcal/mol in stabilizing the closed state. c Selected concentration-response relations of mutants with increasing hydrophilicity of gate residues. d Relationship between EC50 change and hydration energy. The fractional contribution of the residues’ hydration energy was estimated to be 0.37 ± 0.11 in stabilizing the open state. a, c Data are averages of the indicated number of patches shown in Supplementary Tables 4 and 5 respectively, errors are SEM. Solid lines are fits to the Hill equation. Dashed lines are the relation of WT. b, d Filled symbols correspond to the mean EC50 of the mutants shown in a and c respectively. Data are averages of the indicated number of patches shown in Supplementary Tables 4 and 5 respectively, errors are SEM. Solid line is a fit to an MWC-type gating model (Eqs. 4–8, see “Methods”). The two series were fitted globally with shared binding constants. The errors of the estimates correspond to 95% confidence intervals.
Fig. 5
Fig. 5. Functional coupling within the triadic gate.
a Schematic illustration of mutant cycle analysis. b ΔΔG of the displayed mutants calculated by fitting their concentration-response relations to an MWC-type gating model (Eqs. 4–6, 9, and 11–12). Bars indicate ΔΔG calculated from the best-fit values of the averaged data shown in Supplementary Fig. 7c. Errors correspond to 95% confidence intervals. c Coupling energy (Gcoupling or ΔΔΔG) measured in double-mutant cycles in the background of WT (left) or indicated mutants (right). Bars indicate the values calculated from the best-fit values shown in b using Eq. 13. d Change in coupling energy (ΔGcoupling or ΔΔΔΔG) between the cycles displayed in c. Bars indicate the values calculated from the values shown in c using Eq. 14. e Cα representation of the inner pore entrance viewed from the extracellular side. Dashed lines depict functional coupling between the displayed residues with a thickness approximately corresponding to the respective coupling energies shown in c, left. c, d Errors are standard errors. Asterisks indicate significant deviation from zero in a two-sided one-sample t-test (from left to right, c ***p = 2e−5; ***p = 2e−16; ***p = 2e−5; *p = 0.043; d ***p = 3e−5 for each value).
Fig. 6
Fig. 6. Effect of sidechain volume on ion conduction in the open state.
a Energy profile of a minimal ion permeation model to account for the I-V relations of TMEM16A. b Instantaneous I-V relations of mutations of Ile 641 with increasing sidechain volume at saturating Ca2+ concentrations. c Energy barrier relative to the outermost barrier in the conduction path at the inner pore entrance (top) and at the middle of the pore (bottom) for Ile 641. d Instantaneous I-V relations of mutations of Ile 550 and Ile 551 with increasing sidechain volume at saturating Ca2+ concentrations. Inset shows a magnified view of the shaded region. e Energy barrier relative to the outermost barrier in the conduction path at the inner pore entrance (top) and at the middle of the pore (bottom) for the residues Ile 550 and Ile 551. b, d Data are averages of 7, 6, 9, and 7 patches (I641), 6, 7, 5, and 11 patches (I550), and 8, 10, 7, and 10 patches (I551) for A, V, M, and F respectively, errors are SEM. Solid lines are fits to a model of ion permeation (Eq. 2). Dashed lines show the relation of WT. c, e Data are calculated using Eq. 3 from the best-fit values of the averaged data shown in b and d respectively, errors are 95% confidence intervals.
Fig. 7
Fig. 7. Relationship between non-conducting and conducting conformations.
a Schematic illustration of the hydrophobic gate at the inner entrance of the narrow neck that prevents ion conduction in the closed state (left). Functional interactions between hydrophobic residues are indicated by dashed lines. Beige area indicates putative de-wetted region that excludes water in the closed conformation. In the open conformation (right), the residues of the gate have dissociated leading to a widening of the pore and a retraction of gate residues on α4. b Relationship between conducting and non-conducting conformations in the presence and absence of Ca2+. In the non-conducting apo conformation of WT (left), the intracellular half of α6 has moved away from the Ca2+ binding site. Upon Ca2+ binding, α6 rearranges its conformation by moving towards the Ca2+ binding site. The subsequent rotation around the helix axis, to bring a residue in contact with bound Ca2+ ions, introduces a strained π-helix conformation. The movement of α6 couples to the gate region to open the channel (center). The coupling between the gate and α6 is illustrated in the structure of a gate mutant showing basal activity in the absence of Ca2+ (right). In this case, α6 has approached the vacant binding site, opening the gate without transiting to a strained π-helix conformation.

Similar articles

Cited by

References

    1. Hartzell C, Putzier I, Arreola J. Calcium-activated chloride channels. Annu. Rev. Physiol. 2005;67:719–758. doi: 10.1146/annurev.physiol.67.032003.154341. - DOI - PubMed
    1. Yang YD, et al. TMEM16A confers receptor-activated calcium-dependent chloride conductance. Nature. 2008;455:1210–1215. doi: 10.1038/nature07313. - DOI - PubMed
    1. Schroeder BC, Cheng T, Jan YN, Jan LY. Expression cloning of TMEM16A as a calcium-activated chloride channel subunit. Cell. 2008;134:1019–1029. doi: 10.1016/j.cell.2008.09.003. - DOI - PMC - PubMed
    1. Caputo A, et al. TMEM16A, a membrane protein associated with calcium-dependent chloride channel activity. Science. 2008;322:590–594. doi: 10.1126/science.1163518. - DOI - PubMed
    1. Manoury B, Tamuleviciute A, Tammaro P. TMEM16A/anoctamin 1 protein mediates calcium-activated chloride currents in pulmonary arterial smooth muscle cells. J. Physiol. 2010;588:2305–2314. doi: 10.1113/jphysiol.2010.189506. - DOI - PMC - PubMed

Publication types

MeSH terms

LinkOut - more resources