. 2021 Feb 4;11(1):3030.
doi: 10.1038/s41598-021-82726-y.

Comparison between 16S rRNA and shotgun sequencing data for the taxonomic characterization of the gut microbiota

Affiliations

Comparison between 16S rRNA and shotgun sequencing data for the taxonomic characterization of the gut microbiota

Francesco Durazzi et al. Sci Rep. .

Abstract

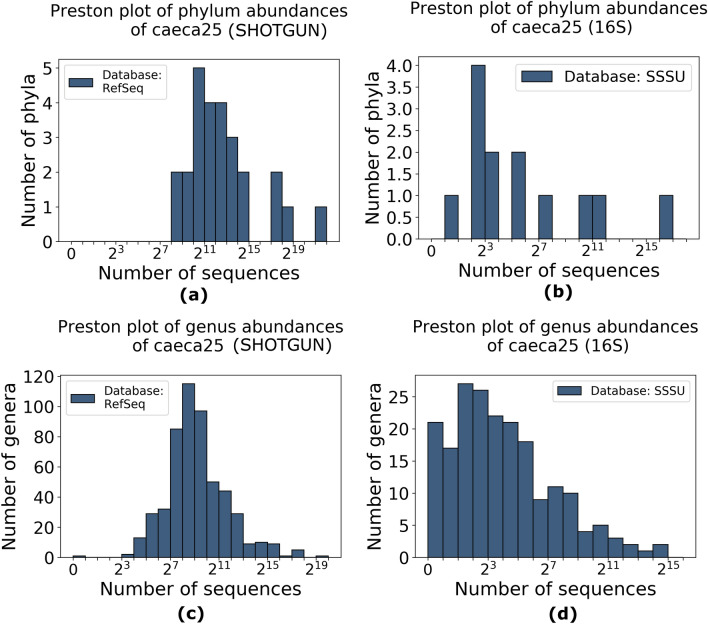
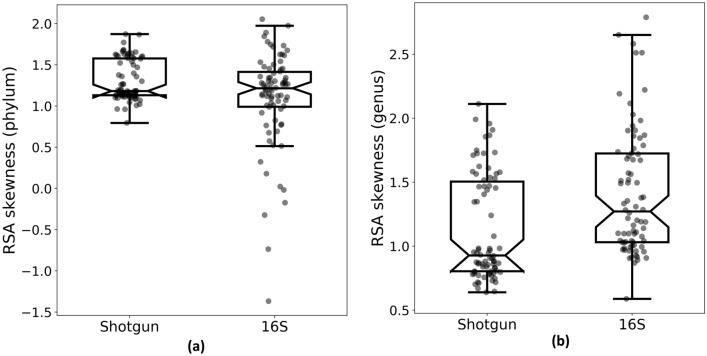
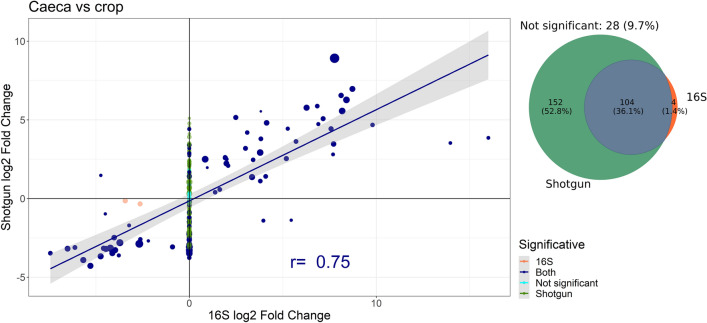
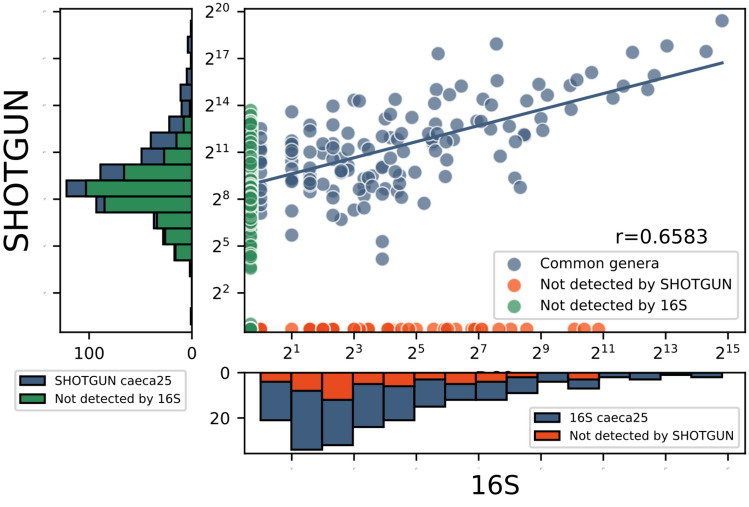
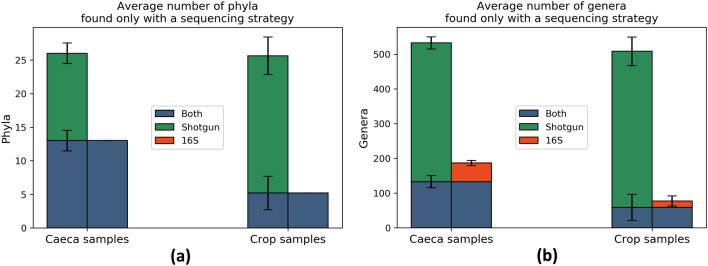
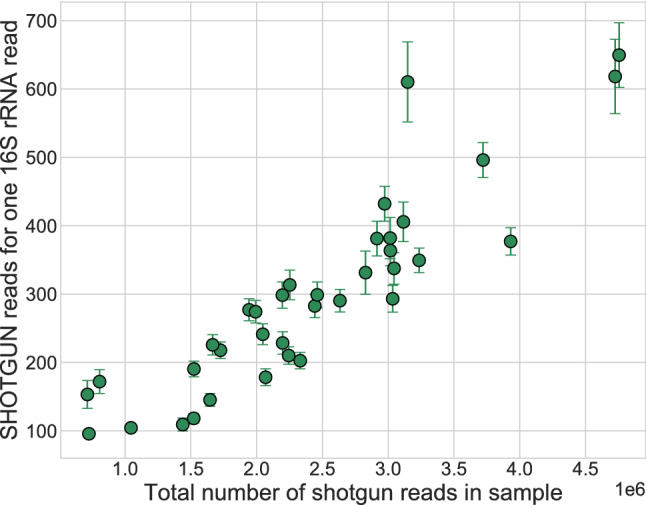
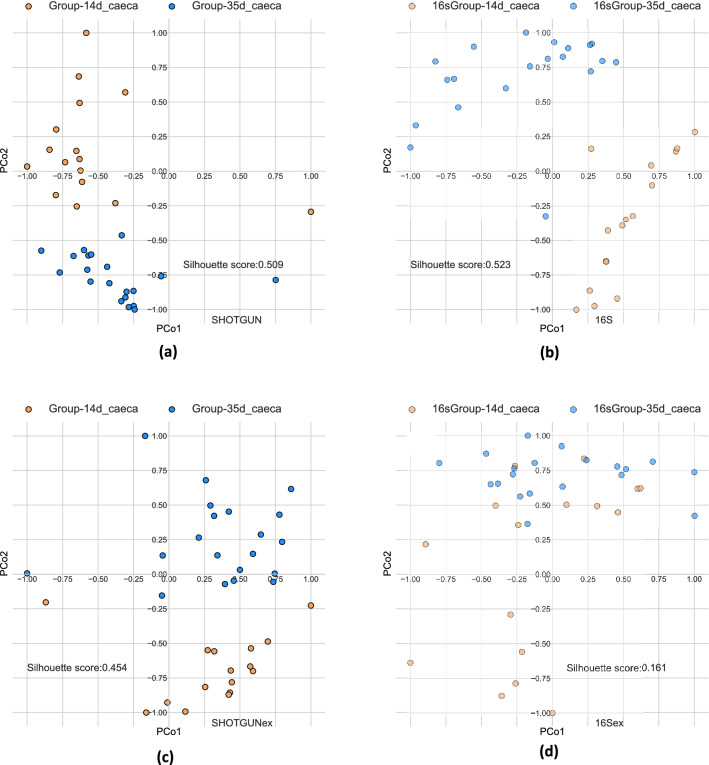
In this paper we compared taxonomic results obtained by metataxonomics (16S rRNA gene sequencing) and metagenomics (whole shotgun metagenomic sequencing) to investigate their reliability for bacteria profiling, studying the chicken gut as a model system. The experimental conditions included two compartments of gastrointestinal tracts and two sampling times. We compared the relative abundance distributions obtained with the two sequencing strategies and then tested their capability to distinguish the experimental conditions. The results showed that 16S rRNA gene sequencing detects only part of the gut microbiota community revealed by shotgun sequencing. Specifically, when a sufficient number of reads is available, Shotgun sequencing has more power to identify less abundant taxa than 16S sequencing. Finally, we showed that the less abundant genera detected only by shotgun sequencing are biologically meaningful, being able to discriminate between the experimental conditions as much as the more abundant genera detected by both sequencing strategies.


Figures

Figure 1
Figure 1
RSA histograms in logarithmic scale (Preston plots ) of bacterial abundances in one sample selected as anexample (caeca25): (a) genera sampled by shotgun sequencing, (b) genera sampled by 16S rRNA sequencing, (c) phyla sampled by shotgun sequencing and (d) phyla sampled by 16S sequencing.
Figure 2
Figure 2
Box plot of the RSA skewness of bacterial communities at (a) phylum level and (b) genus level. Bacterial communities are sampled with (left) shotgun sequencing and (right) 16S sequencing.
Figure 3
Figure 3
Fold changes between caeca and crop in genera identified by both strategies. Some fold changes are shrunk toward zero by the DESeq2 algorithm (see “Methods” section). Points with a statistically significant change for both strategies are represented in blue, for shotgun only in green, for 16S only in orange and without a significant change in cyan (adjusted P > 0.05 with DESeq2). Point size is the log10 of average number of reads from shotgun strategy mapping to each genus. Pearson’s correlation coefficient r and regression line are computed only on points with statistically significant fold changes according to both strategies (“Both” group in figure legend and in Table 1).
Figure 4
Figure 4
Scatter plot of 16S and shotgun genera abundances of one sample selected as example (caeca25). Histograms display stacked bars, where every column is divided in a part corresponding to the abundance of genera detected by both sequencing strategies (blue) and the other part is relative to genera detected exclusively by only one strategy (red for 16S and green for shotgun). Pearson's correlation coefficient is computed only for the common genera. Logarithmic (log2) scale helps to recognize that less abundant genera identified by shotgun sequencing are almost not detected by 16S sequencing.
Figure 5
Figure 5
Average number of (a) phyla and (b) genera found within caeca and crop samples. The length of the error bars is equal to the standard deviation computed on all the samples.
Figure 6
Figure 6
Intercepts of shotgun vs 16S abundance linear regressions of caeca samples against the total number of reads in each set, representing the number of shotgun sequences corresponding to one 16S sequence. Error bars correspond to the confidence interval for the parameter provided by the fit.
Figure 7
Figure 7
PCoA based on the beta-diversities between samples (Bray–Curtis metric), computed on genera abundances of caeca samples normalized by DESeq2, labelled by sampling time: 14th day (gold), 35th day (cyan). (a, b) with all genera detected respectively by shotgun (a) and 16S (b); with genera found exclusively by shotgun (c) or 16S (d).

References

    1. Maccaferri S, Biagi E, Brigidi P. Metagenomics: key to human gut microbiota. Dig. Dis. 2011;29:525–530. doi: 10.1159/000332966. - DOI - PubMed
    1. Cornejo-Pareja, I., Muñoz-Garach, A., Clemente-Postigo, M. & Tinahones, F. J. Importance of gut microbiota in obesity. Eur. J. Clin. Nutr.72, (2018). - PubMed
    1. Stanley D, Hughes RJ, Moore RJ. Microbiota of the chicken gastrointestinal tract: influence on health, productivity and disease. Appl. Microbiol. Biotechnol. 2014;98:4301–4310. doi: 10.1007/s00253-014-5646-2. - DOI - PubMed
    1. De Cesare, A. et al. Effect of dietary supplementation with Lactobacillus acidophilus D2/CSL (CECT 4529) on caecum microbioma and productive performance in broiler chickens. PLoS One12, (2017). - PMC - PubMed
    1. ten Hoopen, P. et al. The metagenomic data life-cycle: Standards and best practices. Gigascience6, (2017). - PMC - PubMed

Publication types

Substances