. 2021 Feb 4;11(1):3134.
doi: 10.1038/s41598-021-82787-z.

Saliva is more sensitive than nasopharyngeal or nasal swabs for diagnosis of asymptomatic and mild COVID-19 infection

Affiliations

Saliva is more sensitive than nasopharyngeal or nasal swabs for diagnosis of asymptomatic and mild COVID-19 infection

Alvin Kuo Jing Teo et al. Sci Rep. .

Erratum in

Abstract

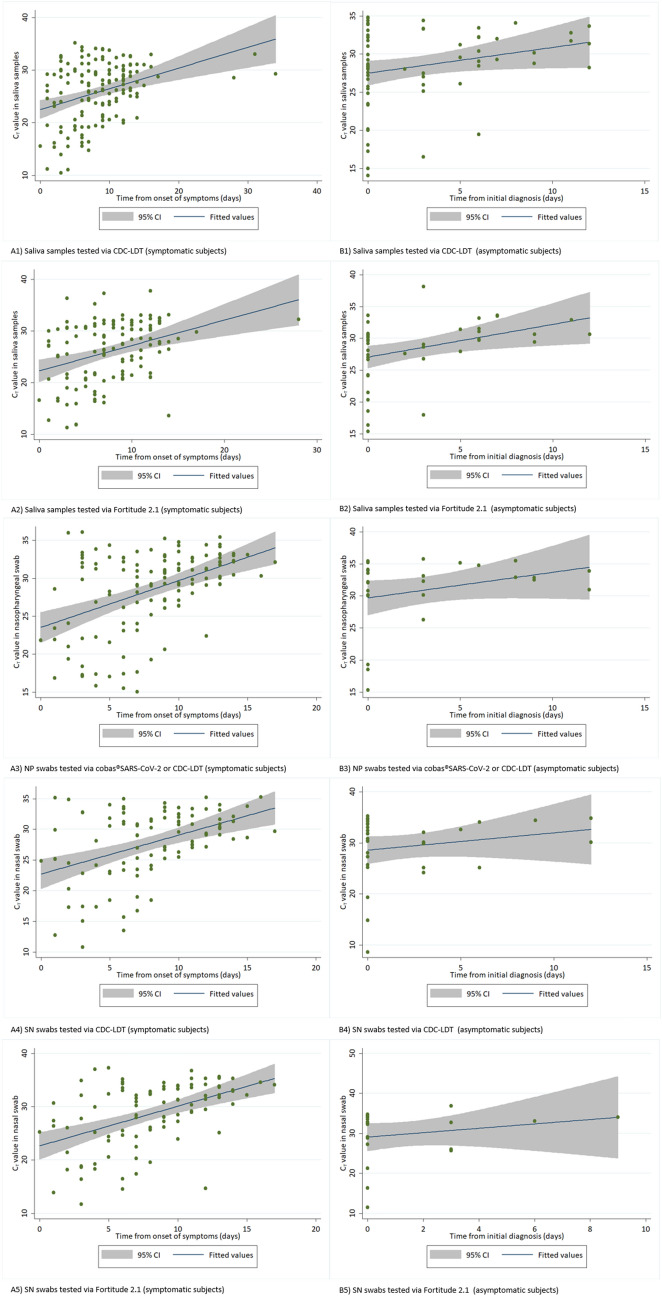
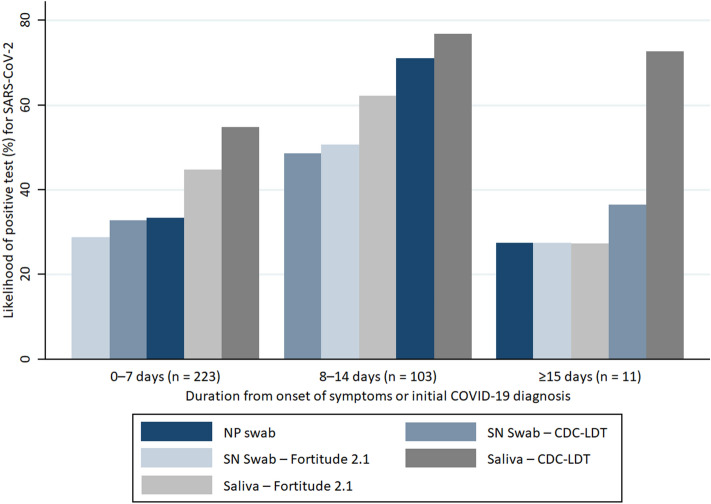
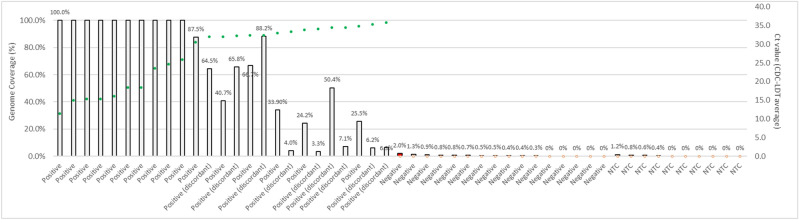
We aimed to test the sensitivity of naso-oropharyngeal saliva and self-administered nasal (SN) swab compared to nasopharyngeal (NP) swab for COVID-19 testing in a large cohort of migrant workers in Singapore. We also tested the utility of next-generation sequencing (NGS) for diagnosis of COVID-19. Saliva, NP and SN swabs were collected from subjects who presented with acute respiratory infection, their asymptomatic roommates, and prior confirmed cases who were undergoing isolation at a community care facility in June 2020. All samples were tested using RT-PCR. SARS-CoV-2 amplicon-based NGS with phylogenetic analysis was done for 30 samples. We recruited 200 subjects, of which 91 and 46 were tested twice and thrice respectively. In total, 62.0%, 44.5%, and 37.7% of saliva, NP and SN samples were positive. Cycle threshold (Ct) values were lower during the earlier period of infection across all sample types. The percentage of test-positive saliva was higher than NP and SN swabs. We found a strong correlation between viral genome coverage by NGS and Ct values for SARS-CoV-2. Phylogenetic analyses revealed Clade O and lineage B.6 known to be circulating in Singapore. We found saliva to be a sensitive and viable sample for COVID-19 diagnosis.


Conflict of interest statement

Yukti Choudhury, Chae Yin Cher, Zi Yi Wan, and Min Han Tan are employees of, and affiliated with, Lucence. Y.C. and M.H.T. are shareholders of Lucence; M.H.T. is a director of Lucence. An affiliated entity of Lucence is the applicant of certain patent applications for relevant diagnostics. Y.C., C.Y.C. and/or M.H.T. are named inventors for some of these patent applications. At the time of this research, patents are pending for the next-generation sequencing approach (SG App. No. 10202007270P) and the saliva testing process (SG App. No. 10202007826S) discussed in the manuscript.

Figures

Figure 1
Figure 1
RT-PCR cycle threshold (Ct) values of naso-oropharyngeal saliva samples, nasopharyngeal (NP) swabs, and self-administered nasal (SN) swabs obtained from subjects infected with SARS-CoV-2. (A) (left) shows the cycle threshold (Ct) values of samples obtained from symptomatic subjects over time since the onset of symptoms. (B) (right) shows the Ct values of samples obtained from asymptomatic subjects over time since the initial COVID-19 diagnosis. Saliva samples and SN swabs were tested via CDC-LDT and Fortitude 2.1. All NP swabs were tested via cobas severe acute respiratory syndrome coronavirus 2 (SARS-CoV-2) (Roche Molecular Systems, Branchburg, NJ) or Centers for Disease Control and Prevention-Laboratory Developed Test (CDC-LDT).
Figure 2
Figure 2
Likelihood of test positivity over time in confirmed COVID-19 subjects. The figure shows the likelihood of positivity for SARS-CoV-2 for nasopharyngeal (NP) swabs, self-administered nasal (SN) swabs, and naso-oropharyngeal saliva samples collected at 0–7 days, 8–14 days, and ≥ 15 days from the onset of symptoms (symptomatic subjects) or initial COVID-19 diagnosis (asymptomatic subjects). NP swabs were tested using via cobas SARS-CoV-2 or Centers for Disease Control and Prevention-Laboratory Developed Test (CDC-LDT).
Figure 3
Figure 3
Correlation between viral genome coverage (%) by next generation sequencing (NGS) and cycle threshold (Ct) values for SARS CoV-2. NGS is a sensitive method of detecting low-level SARS-CoV-2 virus in clinical samples, and coverage (%) of the genome is correlated to the Ct value determined by RT-PCR. Thirty samples (17 saliva and 11 SN swabs and 1 NP swab) were tested by NGS. Ten samples (4 saliva, 6 SN swabs) with discordant results from the RT-PCR tests were confirmed to be positive by NGS (median genome coverage 29.7%, range 3.3–88.2%). Genome coverage (%) is defined as the proportion of the SARS-CoV-2 genome that has > 1× depth of coverage. The threshold coverage (%) for making positive call by NGS was established by running 5 negatives (by RT-PCR) samples from this study, 11 negative NP swab samples from community testing, and 10 no-template controls (NTC). The threshold was determined to be the detection of 5 amplicons, which corresponds to a coverage of ~ 1.7% of the SARS-CoV-2 genome. Among five negatives (by both RT-PCR methods) saliva samples, one saliva sample was called positive by NGS (red bar) with a genome coverage of 2.0%. This sample was from a patient with RT-PCR positive NP swab and nasal swab samples collected at the same time, raising the possibility of a low-level signal detected on NGS. Ct values for samples with positive calls (by either or both Fortitude 2.1 and CDC-LDT RT-PCR assays) are represented on the graph with green circles, and samples negative for SARS-CoV-2 (by both RT-PCR tests) and NTC are represented as open circles. Average Ct values (of 2 targets) or single Ct value (when only 1 target was detected) from the CDC-LDT assay are plotted on the secondary axis.

References

    1. World Health Organization. Novel Coronavirus (2019-nCoV) Situation Report (2020). https://www.who.int/docs/default-source/coronaviruse/situation-reports/2.... Accessed 1 September 2020.
    1. Worldometer. COVID-19 Coronavirus Pandemic (2020). https://www.worldometers.info/coronavirus/#countries. Accessed 1 September 2020.
    1. Ministry of Health Singapore. COVID-19 Situation Report (2020). https://covidsitrep.moh.gov.sg/. Accessed 1 September 2020.
    1. Priyanka, Choudhary OP, Singh I, Patra G. Aerosol transmission of SARS-CoV-2: The unresolved paradox. Travel Med. Infect. Dis. 2020;37:101869. doi: 10.1016/j.tmaid.2020.101869. - DOI - PMC - PubMed
    1. Young BE, et al. Epidemiologic features and clinical course of patients infected with SARS-CoV-2 in Singapore. JAMA. 2020 doi: 10.1001/jama.2020.3204. - DOI - PMC - PubMed

Publication types