. 2021 Feb;18(2):186-193.
doi: 10.1038/s41592-020-01054-7. Epub 2021 Feb 4.

Multi-particle cryo-EM refinement with M visualizes ribosome-antibiotic complex at 3.5 Å in cells

Affiliations

Multi-particle cryo-EM refinement with M visualizes ribosome-antibiotic complex at 3.5 Å in cells

Dimitry Tegunov et al. Nat Methods. 2021 Feb.

Abstract

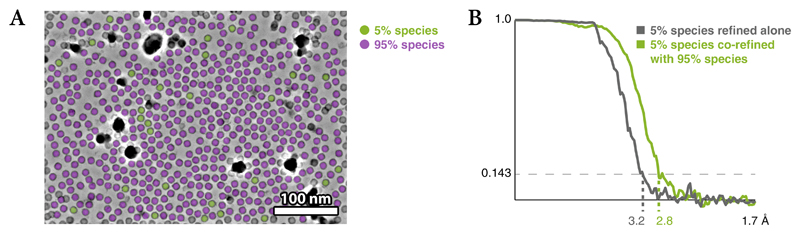
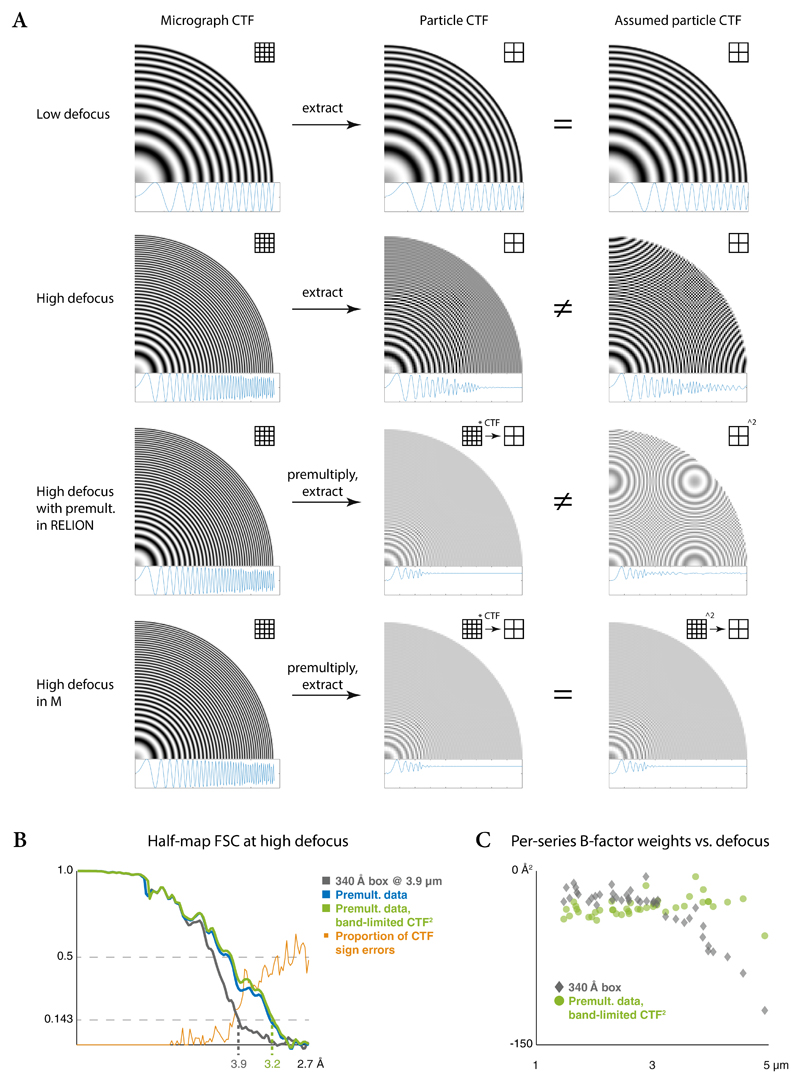
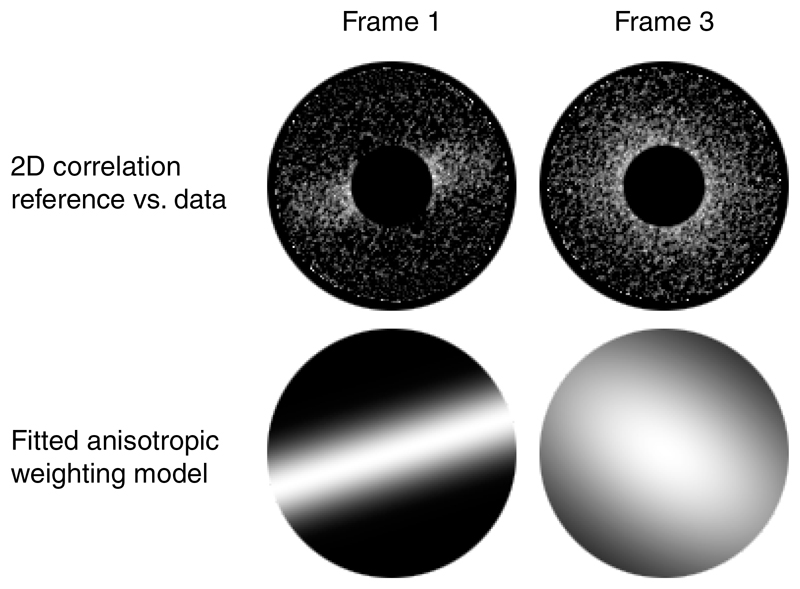
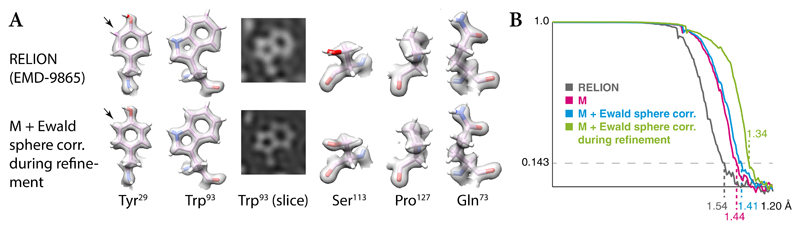
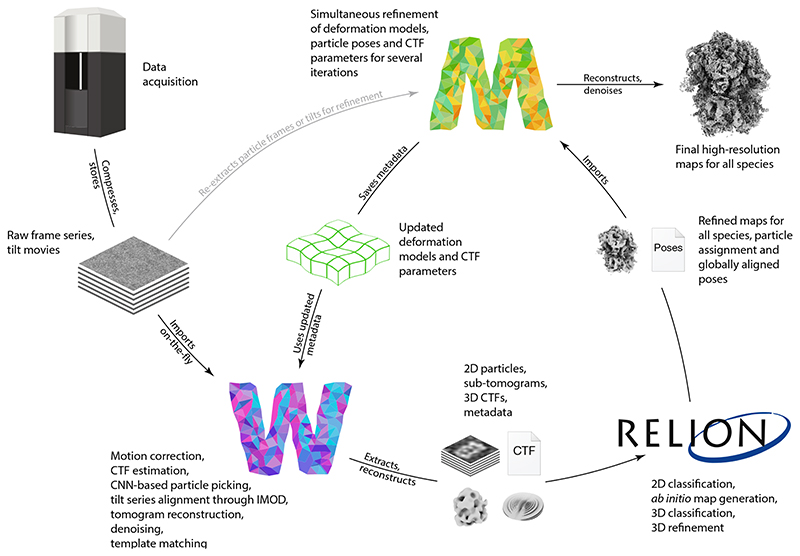
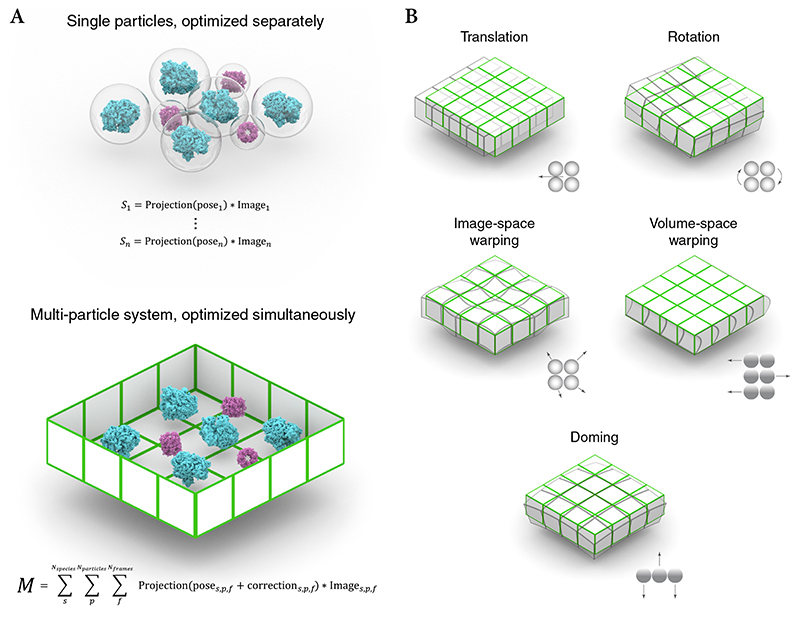
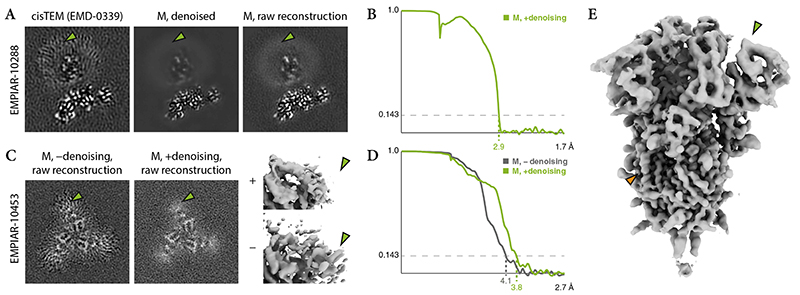
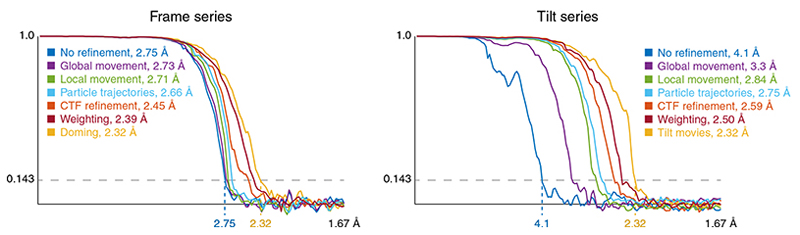
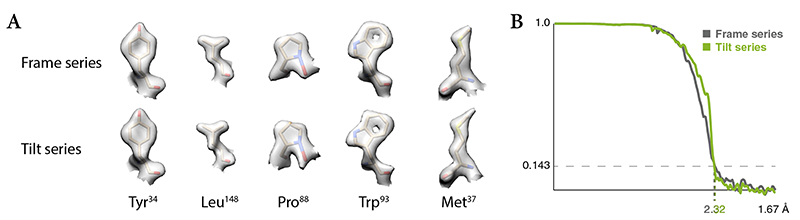
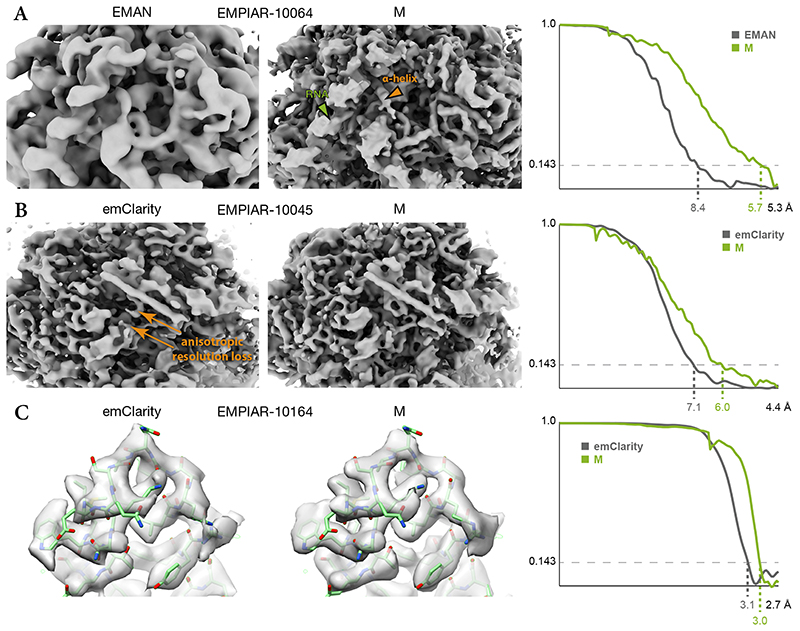
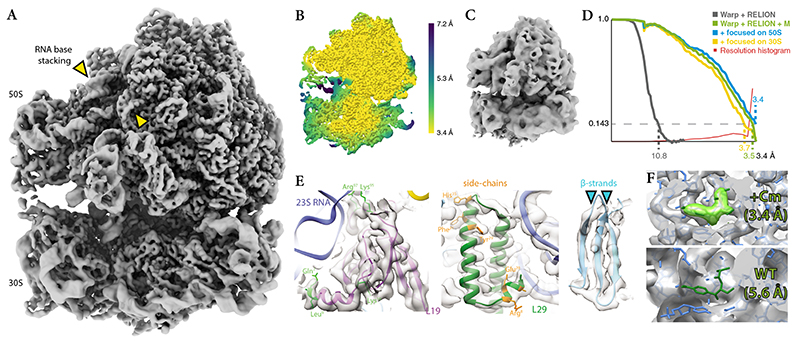
Cryo-electron microscopy (cryo-EM) enables macromolecular structure determination in vitro and inside cells. In addition to aligning individual particles, accurate registration of sample motion and three-dimensional deformation during exposures are crucial for achieving high-resolution reconstructions. Here we describe M, a software tool that establishes a reference-based, multi-particle refinement framework for cryo-EM data and couples a comprehensive spatial deformation model to in silico correction of electron-optical aberrations. M provides a unified optimization framework for both frame-series and tomographic tilt-series data. We show that tilt-series data can provide the same resolution as frame-series data on a purified protein specimen, indicating that the alignment step no longer limits the resolution obtainable from tomographic data. In combination with Warp and RELION, M resolves to residue level a 70S ribosome bound to an antibiotic inside intact bacterial cells. Our work provides a computational tool that facilitates structural biology in cells.


Conflict of interest statement

Competing financial interests

The authors declare no competing financial or other interests.

Figures

Extended Data Figure 1
A pyramid results from a combination of several grids to model the in-plane motion occurring in a frame-series with 40 frames as a function of position and dose. Each cubical cell represents a sampling point. The top grid has full temporal (per-frame exposure) and no spatial resolution to model fast, global motion (left, 1x1x40, shown truncated). For subsequent grids, temporal resolution is reduced by a factor of 4 and spatial resolution is doubled to model slower, local motion (center, 2x2x10; right 4x4x3). The spatial resolution of the first grid can be set higher if there is enough particle signal to fit.
Extended Data Figure 2
Apoferritin frame-series were refined using a small 5% sub-population of the particles alone, and together with another 95% sub-population that improved the accuracy of the multi-particle system hyperparameters, but did not contribute particles to the 5% half-maps. (a) Exemplary micrograph (n = 150 micrographs collected from the same sample) showing the distribution of the 2 sub-populations within a frame-series. (b) FSC curves between the half-maps of the 5% population in both scenarios, showing the benefit of multi-species refinement.
Extended Data Figure 3
High-resolution information is delocalized at high defocus. Choosing an insufficiently large particle box size results in loss of that information. In Fourier space, this results in CTF oscillations becoming too fast to be resolved at the sampling rate provided by the small box, averaging to 0. M chooses the box size automatically for each frame- or tilt-series’ defocus, pre-multiplies the data and simulated CTF by the CTF to eliminate the oscillations and localize the signal, and then crops the data to the desired map size. This avoids the pitfall of losing map resolution due to an inappropriately chosen box size. (a) Visualization of the delocalization and aliasing effects in Fourier space as 2D and rotationally averaged 1D CTFs; grids depict sampling rate. At low defocus (row 1), all signal is localized within the box and no aliasing is seen in the simulated CTF used for the image formation model during refinement. At high defocus (row 2), high-resolution signal is delocalized outside the small particle box. Once the particle is extracted, the fast CTF oscillations are averaged to 0 and high-resolution information is lost. At the same time, the simulated CTF is filled with aliasing artifacts because it is not low-pass filtered in the same way. If the particle data are pre-multiplied by the CTF at a box size large enough to contain all signal and resolve all CTF oscillations (row 3), as can be done optionally in RELION, all particle signal is contained in the box after cropping it to a smaller size, and the CTF averages to 0.5. However, the simulated CTF2 does not match this and contains aliasing artifacts. M applies the pre-multiplication to both particle data and simulated CTF in a larger box before cropping (row 4) to avoid the mismatch. (b) FSC between the half-maps reconstructed from HIV1 virus-like particles of a single high-defocus (3.9μm) tilt-series in an insufficiently large box. Using data extracted without pre-multiplication, as is currently common, limits the resolution to 3.9Å (grey). Pre-multiplying both particle data and CTF in a larger box, as automated in M, improves the result to 3.2Å (green). Pre-multiplying only particle data is only slightly worse here (blue), but would likely lead to noticeably worse results in RELION as the aliased CTF2 would be used in the image formation during refinement. The FSC curves diverge as the proportion of CTF sign errors (orange) increases. (c) Relation between tilt-series defocus and associated contribution of high-resolution information to the reconstruction. For the larger dataset, not pre-multiplying the data results in a strong correlation, where high-defocus data is down-weighted to contribute less (grey). The correlation disappears when pre-multiplication is applied, so more tilt-series contribute high-resolution information (green).
Extended Data Figure 4
Normalized 2D cross-correlation between reference projections and data, averaged over all particles in a single frame is shown for the 1st and 3rd frame of the same exposure. Values in the low-frequency region are excluded to reduce the value range. The fitted B-factor is highly anisotropic for the 1st frame because of intra-frame motion: 0Å2 and -62Å2 along X and Y, respectively. For the 3rd frame, the fit is much more isotropic due to lack of intra-frame motion, but some high-resolution information is lost to radiation damage: -8Å2 and -10Å2 along X and Y, respectively.
Extended Data Figure 5
Atomic-resolution data of apoferritin previously refined with RELION 3.1 to 1.54Å (EMD-9865) were processed with M to achieve a resolution of 1.34Å. (a) Examples of side-chain densities produced by RELION (top) and M (bottom), showing cases of improved atomic features such as one of the hydrogens in Tyr29 (black arrow). (b) FSC between the half-maps produced by RELION (grey) and M (green), showing a general improvement in resolution through M.
Extended Data Figure 6
Doming models describing per-frame, spatially resolved (3x3 points) defocus offsets fitted during the refinement of atomic-resolution data of apoferritin (EMPIAR-10248) were averaged across the dataset, showing significant changes in the CTF during exposure. (a) Defocus change plotted against the accumulated exposure show a fast change in both the central point and the average of the entire field of view’s 3x3 points at the beginning of the exposure. After the first 7.5e-2 of exposure, the average change stabilizes, while the central point continues to decrease in defocus. (b) When corrected for global inclination, the difference between the central and peripheral defocus change indicates a steady increase in doming within the field of view as a function of accumulated exposure. (c) Surface rendering of the spatially resolved defocus change for the first 7 frames shows an inclination of the entire field of view, as well as a more localized dent in the center. The observed change in the CTF can also be caused by electrostatic lensing effects due to sample charging, and further experiments are necessary to investigate the exact nature of doming.
Extended Data Figure 7
(a) 2D XY slice through an exemplary denoised tomogram (n = 65 tilt-series collected from the same sample. Each tilt-series captures a single cell). (b) Resolution plotted against the number of particles shows that 5Å can be obtained with less than 3000 large, asymmetric particles in cells. Extrapolation beyond the Nyquist limit of the data (magenta line) is speculative, but indicates that 3Å could be surpassed with less than 100,000 particles, given data with higher magnification. (c) Histogram of manually measured cell thickness values from 65 tomograms.
Figure 1
Figure 1. The Warp–RELION–M pipeline for frame and tilt-series cryo-EM data refinement
Electron microscopy data are pre-processed on-the-fly in Warp, which then exports particles as images or sub-tomograms. For tilt series, 3D CTF volumes containing the missing wedge and tilt-dependent weighting information are generated for each particle. Particles are imported in RELION, where they can be subjected to a multitude of processing strategies, resulting in 3D reference maps, global particle pose alignments, and class assignments. The particle population encompassing all classes is then imported in M, where reference-based frame or tilt image alignments are performed simultaneously with further refinement of particle poses and CTF parameters. Finally, M produces high-resolution reconstructions that can be used for model building. The improved alignments can be used in Warp to re-export particles for further, more accurate classification in RELION.
Figure 2
Figure 2. Multi-particle system modeling and optimization
(a) Previous algorithms treat particles as isolated entities and optimize their poses using separate cost functions (top). In M’s multi-particle refinement framework, all particles within the field of view are treated as parts of the same physical volume. Their poses and hyperparameters describing the beam-induced deformation of the volume are optimized simultaneously using a single cost function (bottom). (b) The multi-particle system deformation model incorporates several modes: Global movement and rotation to account for inaccuracies in stage movement between frames and stage rotation between tilts; image-space warping to model local non-linear deformation in the 2D reference frame of a frame or tilt image; volume-space warping to model the movement of overlapping particles perpendicular to the projection axis (tilt-series only); doming to account for the hypothesized bending of a thin sample along the projection axis (frame-series only).
Figure 3
Figure 3. Effects of deep learning-based denoising of reconstructions during refinement
(a) 2D XY slices through 3D reconstructions of the cannabinoid receptor 1-G membrane protein. The original refinement in cisTEM (left) introduced artifacts in the highly disordered lipid region (green arrow). The denoised map (middle) and the raw reconstruction before denoising (right) used in the last refinement iteration in M using 149,308 particles (ca. 15% fewer than in the original study) are devoid of the artifacts because the denoising filtered and downweighed the low-resolution region. (b) FSC between the half-maps independently refined in M, showing a global resolution of 2.9Å. A value of 3.0Å was reported in the original study, with no FSC curve included with the deposited map. (c) 2D XY slices and isosurface renderings of the S1 domain in SARS-CoV-2 spike protein reconstructions. Refinement in M without denoising introduced visible artifacts (left, bottom–right) in the region (green arrows), which had significantly lower resolution than the rest of the protein. Using denoising, the artifacts were avoided (center, top–right). (d) FSC between the half-maps refined in M with and without denoising, showing an improvement in global resolution from 4.1Å to 3.8Å when using denoising. (e) Isosurface rendering of the entire denoised SARS-CoV-2 reconstruction with a global resolution of 3.8Å. Through the denoising process, the more disordered S1 domain (green arrow) was filtered to lower resolution compared to other parts where side chains are visible (orange arrow).
Figure 4
Figure 4. Contributions of individual multi-particle system model components to map resolution
Fourier shell correlation between half-maps for frame-series and tilt-series apoferritin data obtained through extending the set of optimizable parameter groups. Starting with the ‘No refinement’ baseline, in top-down order in the legend, a new group of parameters was added, while keeping the previously added groups, and refinement was performed from scratch. The resolution for each step is given in the legend.
Figure 5
Figure 5. M achieves similar resolution for frame-series and tilt-series data of an apoferritin sample
(a) Representative side chain densities observed in the frame-series and tilt-series maps. (b) Comparison between the global FSC curves for each map.
Figure 6
Figure 6. Comparison of maps obtained from published tilt-series using M or other software
(a) 80S ribosome data from EMPIAR-10064 were used to benchmark tilt-series processing in EMAN (EMD-0529). M achieved higher resolution, accompanied by visibly better resolved features such as RNA (green arrow) and α-helices (orange arrow). (b) 80S ribosome data from EMPIAR-10045 were used to benchmark emClarity. The originally published map (EMD-8799, not shown) exhibited strong resolution anisotropy. A recently updated map still suffered from resolution anisotropy (“smearing” direction indicated by orange arrows). M achieved higher and more isotropic resolution, aiding the map’s interpretability. (c) HIV-1 capsid-SP1 data from EMPIAR-10164 were used to benchmark emClarity (EMD-8986). M achieved slightly higher resolution using ca. 30% of the particle number used by emClarity. Doubling the number of particles did not increase the resolution. PDB-5L93 was rigid-body fitted into the maps for visualization.
Figure 7
Figure 7. M. pneumoniae 70S ribosome-antibiotic map at 3.5Å refined with the new Warp–RELION–M pipeline from tilt-series data set of intact cells
(a) Isosurface representation of the 3.5Å resolution map. (b) Isosurface of the map colored by local resolution. Despite stalling of the ribosome that is induced by antibiotic binding, residual ratcheting leads to higher resolution in the large 50S subunit, which dominates the alignment, and lower resolution in the small 30S subunit. (c) Isosurface of a 10.8Å map derived from the same data set using only Warp and RELION. (d) FSC curves showing the resolution improvement achieved through global and focused refinement in M. The overlaid local resolution histogram shows that a significant portion of the map is resolved close to the data’s Nyquist limit of 3.4Å. (e) High-resolution features, such as large amino acid side chains (in green and orange) and well-separated β-strands (cyan arrows), are resolved at a level expected for this resolution range. (f) Atomic model of a Cm-bound 70S ribosome (PDB-4v7t) fitted into the 3.4Å 50S map (top) shows correspondence of map density (light green) to the Cm molecule (dark green). Fitting the same model into a 5.6Å 70S ribosome map of untreated M. pneumoniae cells (EMD-10683, bottom) does not show any density for Cm, providing a negative control.

References

    1. Dubochet J, Lepault J, Freeman R, Berriman JA, Homo JC. Electron microscopy of frozen water and aqueous solutions. J Microsc. 1982;128:219–237.
    1. Danev R, Yanagisawa H, Kikkawa M. Cryo-Electron Microscopy Methodology: Current Aspects and Future Directions. Trends in biochemical sciences. 2019;44:837–848. - PubMed
    1. Lyumkis D. Challenges and opportunities in cryo-EM single-particle analysis. J Biol Chem. 2019;294:5181–5197. - PMC - PubMed
    1. Bharat TA, Scheres SH. Resolving macromolecular structures from electron cryo-tomography data using subtomogram averaging in RELION. Nature protocols. 2016;11:2054–2065. - PMC - PubMed
    1. Castaño-Díez D, Kudryashev M, Arheit M, Stahlberg H. Dynamo: a flexible, user-friendly development tool for subtomogram averaging of cryo-EM data in high-performance computing environments. Journal of structural biology. 2012;178 - PubMed

Publication types

MeSH terms

Substances