. 2021 Mar;24(3):437-448.
doi: 10.1038/s41593-020-00786-1. Epub 2021 Feb 4.

Activity-dependent regulome of human GABAergic neurons reveals new patterns of gene regulation and neurological disease heritability

Affiliations

Activity-dependent regulome of human GABAergic neurons reveals new patterns of gene regulation and neurological disease heritability

Gabriella L Boulting et al. Nat Neurosci. 2021 Mar.

Abstract

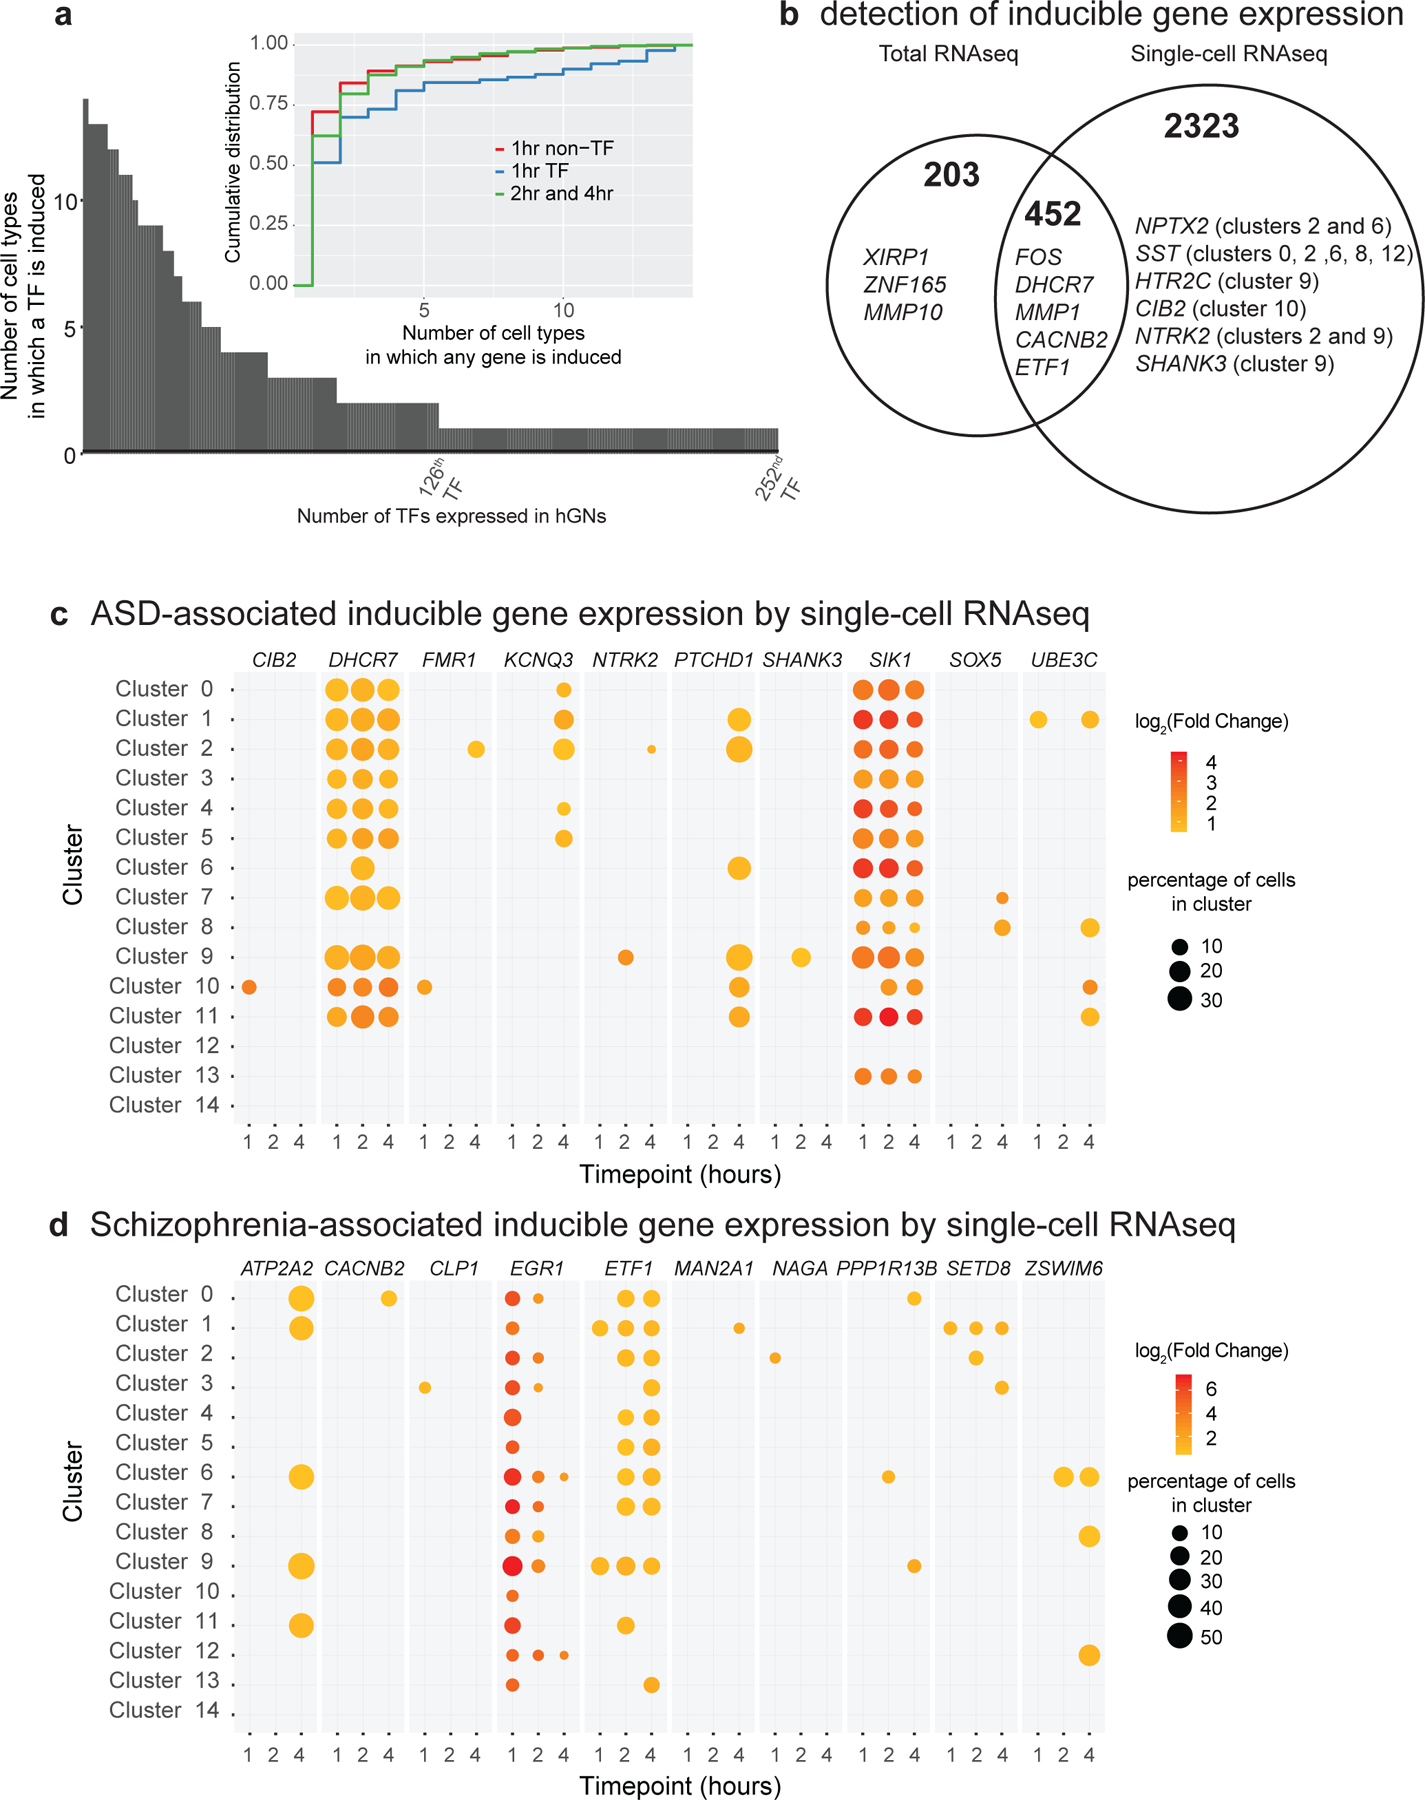
Neuronal activity-dependent gene expression is essential for brain development. Although transcriptional and epigenetic effects of neuronal activity have been explored in mice, such an investigation is lacking in humans. Because alterations in GABAergic neuronal circuits are implicated in neurological disorders, we conducted a comprehensive activity-dependent transcriptional and epigenetic profiling of human induced pluripotent stem cell-derived GABAergic neurons similar to those of the early developing striatum. We identified genes whose expression is inducible after membrane depolarization, some of which have specifically evolved in primates and/or are associated with neurological diseases, including schizophrenia and autism spectrum disorder (ASD). We define the genome-wide profile of human neuronal activity-dependent enhancers, promoters and the transcription factors CREB and CRTC1. We found significant heritability enrichment for ASD in the inducible promoters. Our results suggest that sequence variation within activity-inducible promoters of developing human forebrain GABAergic neurons contributes to ASD risk.


Conflict of interest statement

COMPETING INTERESTS STATEMENT

The authors declare no competing interests.

Figures

Extended Data Figure 1.
The gene expression profile of hGNs is similar to that of developing human telencephalic GABAergic neurons.
Extended Data Figure 2.
Single cell RNA sequencing of hGNs reveals developing ventral forebrain cell types.
Extended Data Figure 3.
Activity-dependent gene expression patterns detected by total RNAseq
Extended Data Figure 4.
Activity-dependent gene expression patterns detected by single-cell RNAseq
Extended Data Figure 5:
hGN activity-dependent enhancers and promoters
Extended Data Figure 6.
Detection of CREB, pCREB, and CRTC1
Extended Data Figure 7.
Disease heritability enrichment in hGN promoter and enhancer regions
Extended Data Figure 8.
ABC model predictions of inducible enhancer-gene associations
Figure 1.
Figure 1.. hGNs express RNA signatures of developing forebrain GABAergic neurons.
a. Live (DIV 7) and b. immunostained (DIV 15) hGN cultures exhibit neuronal morphology and express the neuronal proteins MAP2 and NF. Images are representative of >10 independent experiments. c. Fold induction of immediate-early genes’ FOS and NPAS4 mRNA at 1 hour after membrane depolarization of hGNs compared to unstimulated mRNA levels measured by qPCR (n=4; median and interquartile range). d. hGNs form functional synapses in culture and show spontaneous inhibitory post-synaptic currents (sIPSCs), which are blocked by gabazine. e. mRNA expression levels (from 1G total RNAseq) of hGNs is consistent with an enrichment of GABAergic neuronal identities as opposed to other brain cell types or induced pluripotent stem cells (n=6; box center = mean; box minima/maxima = mean +/− 1 SE; whiskers minima/maxima = mean +/− 1 SD). f. UMAP visualization of hGN scRNAseq displaying eight striatal-like GABAergic neuronal cell clusters, three clusters of MGE- or septal-like derived GABAergic neurons, and minority populations of glutamatergic neurons and mitotic progenitor cells. g. UMAP visualizations of hGN scRNAseq with cells colored purple if RNA transcripts were detected for developmental marker genes of neural progenitors (NES), post-mitotic neurons (MAP2), forebrain identity (FOXG1), GABAergic neurons (vGAT or SLC32A1), pallial glutamatergic neurons (TBR1), MGE-derived neurons (NKX2.1), and developing striatal neurons (EBF1 and SERTAD4).
Figure 2.
Figure 2.. Neuronal activity-dependent gene expression of hGNs by total RNAseq.
mRNA expression level changes measured by total RNAseq of 1G hGNs at a. 15 minutes (n=3), 1 hour (n=3), 2 hours (n=6), and 4 hours (n=3) after membrane depolarization compared to expression in unstimulated cultures (n=6) represented by MA-plot. Genes with a significantly different gene expression level and a minimum fold-change magnitude of 1.5 after depolarization are marked in red. Genes having inducible expression fall above y = 0 and example gene names are labeled. b. Time courses of gene expression levels measured by total RNAseq for genes not previously known to be stimulation inducible in the brain, LINC00473 and ZNF331 (positive controls), and GAD1 (negative control). Timepoints at which the transcript was significantly induced compared to unstimulated cultures are marked with an asterisk. (n=6 (0hr, 2hr) or 3 (15min, 1 hr, and 4hr) biologically independent samples; plots display mean +/− S.E.M.) c. Diagram of CACNB2 transcript variants and exons recognized by TaqMan probes used to query transcript-specific activity-dependent expression. d. Box and whisker plot displaying fold-changes in mRNA levels of different CACNB2 transcript variants after membrane depolarization of hGNs, as measured by TaqMan qPCR (n=3–4; one-sided t-test: *p = 0.0145, **p = 0.0071). CACNB2 induction is due to increased levels of ‘short transcript D’ (NM_201570.2) in response to membrane depolarization, and is dependent on the transcription factor CRTC1.
Figure 3.
Figure 3.. Neuronal activity-dependent gene expression of hGNs by single-cell RNAseq.
a. Single cell RNAseq of 1G hGNs reveals ubiquitous and cell-type specific transcription factor (TF) gene induction within hGN cultures. Early- inducible (1hr) TF genes are induced in more cell types than late-inducible (2 and 4 hours) TF genes. b. The genes detected to have inducible expression are partially overlapping between total and single-cell RNAseq methods. Total RNAseq can detect induction of lowly expressed genes (e.g. XIRP1), whereas single-cell RNAseq can detect induction of genes inducible in only a subset of hGN cell types (e.g. NPTX2). For total RNAseq, n=6 (0hr, 2hr) or 3 (15min, 1hr, and 4hr) biologically independent samples. c. Selected SFARI ASD-associated genes having inducible expression in hGNs, as measured by single-cell RNAseq, including genes with induction across many hGN cell clusters (e.g. DHCR7) and genes showing hGN cell-cluster restricted induction (e.g. SHANK3). d. Selected schizophrenia-associated genes having inducible expression in hGNs. The magnitude of fold-change of mRNA levels in each cell cluster at different timepoints after membrane depolarization compared to unstimulated mRNA levels is indicated by dot color. Only timepoints with significantly induced mRNA levels (compared to unstimulated) are shown. The percentage of cells in each cluster from which expression was detected is represented by the size of the dot. For scRNAseq, n= 37,101 cells examined over 3 independent experiments using independent differentiation lots of 1G neurons.
Figure 4.
Figure 4.. hGN activity-dependent promoters and enhancers
a. 1G H3K27ac ChIPseq peak size changes in 15 minute or 2 hour membrane depolarized hGNs compared to unstimulated cultures represented by MA-plot. Peak regions with a significantly greater read count after membrane depolarization (inducible) are in red, and those with a significantly lower read count are in blue. b. Summary of 1G H3K27ac ChIPseq regions, their inducibility, and representation in the in vivo reference list. The majority of inducible H3K27ac ChIPseq peaks are either significantly increased at 15 minutes (early) or 2 hours (late) after membrane depolarization, but not both. c. Compared to all 1G H3K27ac ChIPseq regions, 1G early-inducible regions are enriched for those that overlap with a TSS (promoter regions) and 1G late-inducible regions are enriched for those that do not overlap a TSS (enhancer regions). d. The CREB binding sequence is the most enriched sequence motif within 15 min inducible H3K27ac regions and the AP-1 motif is the most enriched within 2 hour inducible H3K27ac regions. e. Aggregate plots of 1G H3K27ac ChIPseq reads within inducible H3K27ac ChIPseq regions before (unstim) and after 15 minutes or 2 hours of membrane depolarization.
Figure 5.
Figure 5.. Genome-wide binding of the activity-dependent CREB Complex
a. Immunostaining of 1G hGN cultures for pCREB (red), CRTC1 (purple), and MAP2 (green) before and 15 minutes after membrane depolarization. After depolarization, nuclear pCREB and CRTC1 increase. Images are representative of 3 independent experiments. b. Genome browser tracks of all 1G total RNAseq, ChIPseq, and ATACseq data generated at the ASD-associated inducible gene locus DHCR7 (pooled and normalized reads from 2–3 biological replicates of ChIPseq and ATACseq, or 3–6 biological replicates of total RNAseq, for each condition). DHCR7 is encoded on the negative strand of chromosome 11, therefore transcript reads accumulate downward. CREB complex is also bound at the DHCR7 promoter in mid-gestational primary human fetal cortex. The ‘half CRE’ track indicates locations of the minimal CREB binding motif in this region. The ‘vert.cons.’ track represents sequence conservation across 100 vertebrate species, and sites predicted to be conserved are assigned positive scores (blue), while sites predicted to be fast-evolving are assigned negative scores (red). c. Overlap of CREB, pCREB, and CRTC1 ChIPseq peaks used to define the CREB complex-bound regions. Diagram circles and overlap are proportional to the number of peaks for each TF ChIPseq. d. Genomic distribution plot of CREB complex ChIPseq peaks reveals that 85% of CREB complex peak summits are proximal (<1.7kb; green) to a gene’s TSS. e. Aggregate plots of CREB, pCREB, and CRTC1 ChIPseq reads within 15 min inducible H3K27ac regions and 2hr inducible H3K27ac regions with and without stimulation. Both pCREB and CRTC1 enrichment increase after hGN membrane depolarization and greater enrichment of CREB complex is seen in early inducible H3K27ac regions than in late inducible H3K27ac regions.
Figure 6.
Figure 6.. Disease heritability enrichment in hGN promoter and enhancer regions
a. Diagram summarizing the relationship between hGN H3K27ac ChIPseq peak regions and the sub-regions investigated for disease heritability enrichment. b. Heritability enrichment of 4G hGN H3K27ac promoter regions and enhancer regions across neurological and non-neurological diseases. c. Heritability enrichment of the 4G inducible and constitutive 500bp enhancers across neurological diseases, showing only constitutive enhancers having significant heritability enrichment. Pairwise two-sided t-test *p < 0.05 d. Heritability enrichment of the 4G inducible and constitutive 500bp promoters across neurological diseases, showing significant enrichment of ASD and BP heritability in inducible promoters, but not constitutive promoters. SCZ heritability is similarly enriched in inducible and constitutive promoters. Pairwise two-sided t-test *p < 0.05 e. Known sequence motifs enriched within inducible 500bp promoters compared to constitutive 500bp promoters from both 1G and 4 G data sets. Each heritability enrichment value is provided in bar plot (+/− std. error). n.s. = not significantly different. Heritability enrichments with multi-test corrected p-values ≥ 0.05 are cross-hatched. Exact p-values are provided in Supplementary Table 14.

References

MAIN TEXT REFERENCES

    1. Geschwind DH & Rakic P Cortical Evolution: Judge the Brain by Its Cover. Neuron 80, 633–647 (2013). - PMC - PubMed
    1. Sousa AMMM, Meyer KA, Santpere G, Gulden FO & Sestan N Evolution of the Human Nervous System Function, Structure, and Development. Cell 170, 226–247 (2017). - PMC - PubMed
    1. Lui JH, Hansen DV & Kriegstein AR Development and Evolution of the Human Neocortex. Cell 146, 18–36 (2011). - PMC - PubMed
    1. Petanjek Z et al. Extraordinary neoteny of synaptic spines in the human prefrontal cortex. Proceedings of the National Academy of Sciences 108, 13281–13286 (2011). - PMC - PubMed
    1. Hensch TK Critical period regulation. Annual review of neuroscience 27, 549–79 (2004). - PubMed

METHODS ONLY REFERENCES

    1. Klein AM et al. Droplet barcoding for single-cell transcriptomics applied to embryonic stem cells. Cell 161, 1187–201 (2015). - PMC - PubMed
    1. Langmead B, Trapnell C, Pop M & Salzberg SL Ultrafast and memory-efficient alignment of short DNA sequences to the human genome. Genome biology 10, R25 (2009). - PMC - PubMed
    1. Butler A, Hoffman P, Smibert P, Papalexi E & Satija R Integrating single-cell transcriptomic data across different conditions, technologies, and species. Nature biotechnology 36, 411–420 (2018). - PMC - PubMed
    1. Satija R, Farrell JA, Gennert D, Schier AF & Regev A Spatial reconstruction of single-cell gene expression data. Nature biotechnology 33, 495–502 (2015). - PMC - PubMed
    1. Qiu X et al. Single-cell mRNA quantification and differential analysis with Census. Nature methods 14, 309–315 (2017). - PMC - PubMed

Publication types