. 2019 Oct 30:4:100016.
doi: 10.1016/j.mbplus.2019.100016. eCollection 2019 Nov.

Cartilage-like composition of keloid scar extracellular matrix suggests fibroblast mis-differentiation in disease

Affiliations

Cartilage-like composition of keloid scar extracellular matrix suggests fibroblast mis-differentiation in disease

Javier Barallobre-Barreiro et al. Matrix Biol Plus. .

Abstract

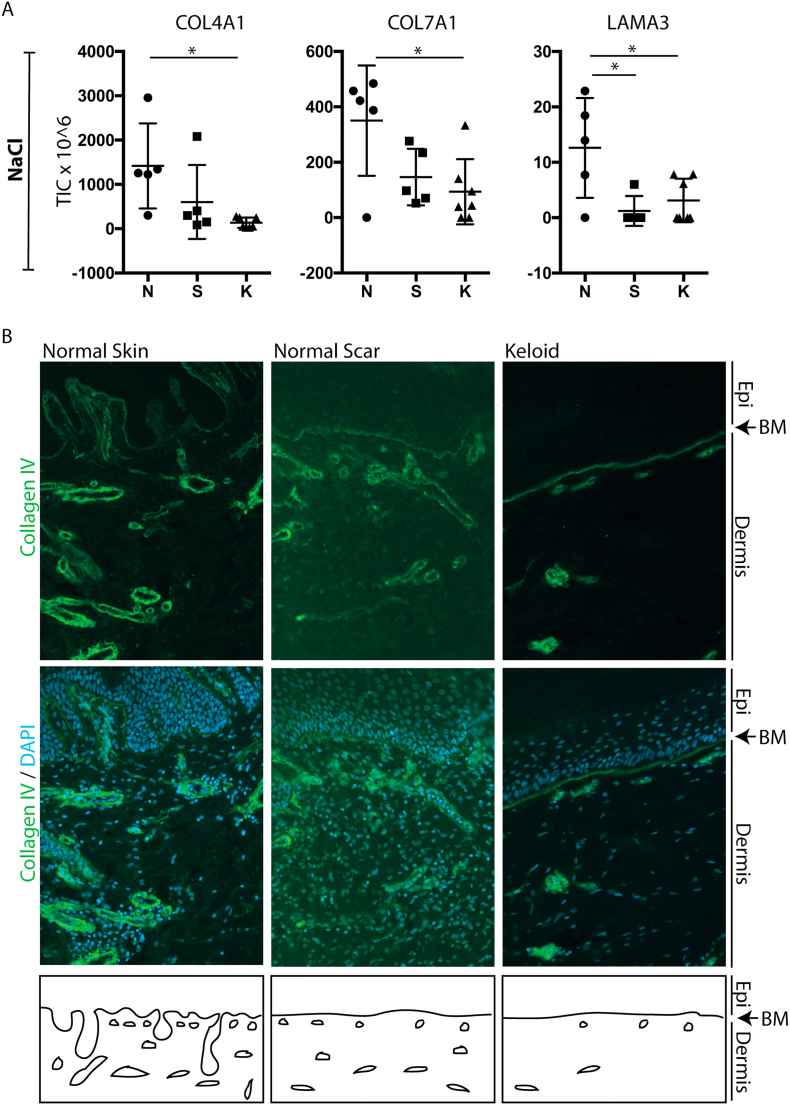
Following wound damage to the skin, the scarring spectrum is wide-ranging, from a manageable normal scar through to pathological keloids. The question remains whether these fibrotic lesions represent simply a quantitative extreme, or alternatively, whether they are qualitatively distinct. A three-way comparison of the extracellular matrix (ECM) composition of normal skin, normal scar and keloids was performed using quantitative discovery-based proteomics. This approach identified 40 proteins that were significantly altered in keloids compared to normal scars, and strikingly, 23 keloid-unique proteins. The major alterations in keloids, when functionally grouped, showed many changes in proteins involved in ECM assembly and fibrillogenesis, but also a keloid-associated loss of proteases, and a unique cartilage-like composition, which was also evident histologically. The presence of Aggrecan and Collagen II in keloids suggest greater plasticity and mis-differentiation of the constituent cells. This study characterises the ECM of both scar types to a depth previously underappreciated. This thorough molecular description of keloid lesions relative to normal scars is an essential step towards our understanding of this debilitating clinical problem, and how best to treat it.

Keywords: Differentiation; ECM; Fibrosis; Plasticity; Scar; Wound.


Conflict of interest statement

The authors have declared that no conflict of interest exists.

Figures

Fig. 1
Fig. 1
Comparison of the ECM proteome (LC-MS/MS) of normal skin (n = 5), normal scars (n = 5) and keloid scars (n = 7). (A, C) Venn diagrams illustrating binary expression data in the three tissue types, with tissue-unique proteins listed (full lists in Appendix Table S3). (B, D) Heatmaps of normalised abundances for proteins with significant differences (p < 0.05) for the comparisons shown. Proteins were clustered using hierarchical average linkage clustering using MeV software. Comparison of the ECM proteome (LC-MS/MS) of normal skin (n = 5), normal scars (n = 5) and keloid scars (n = 7). (A, C) Venn diagrams illustrating binary expression data in the three tissue types, with tissue-unique proteins listed (full lists in Supplementary Table S3). (B, D) Heatmaps of normalised abundances for proteins with significant differences (p < 0.05) for the comparisons shown. Proteins were clustered using hierarchical average linkage clustering using MeV software.
Fig. 2
Fig. 2
Alterations in collagen organization in keloid scar. (A) Histological sections stained with Haematoxylin Van Gieson (HVG). Scale bar: 50 μm. (B, C) Abundance (Total Ion Current, TIC) of (B) FACIT collagens and (C) SLRPs in NaCl and GuHCl extracts of normal skin (N, n = 5), normal scar (S, n = 5), and keloid (K, n = 7). Results are graphed as mean ± SD, with individual values shown. Statistical significance was calculated using Students t-test (*, p < 0.05).
Fig. 3
Fig. 3
Cartilage-like composition in keloid scars. (A) A list of the 17 of 27 keloid-associated proteins implicated in cartilage development or homeostasis. (B) Abundance (Total Ion Current, TIC) of Aggrecan in NaCl and GuHCl extracts of normal skin (N, n = 5), normal scar (S, n = 5), and keloid (K, n = 7). Results are graphed as mean ± SD, with individual values shown. (C) Histological sections stained with Haematoxylin and Eosin (H&E; scale bar: 50 μm; * indicate areas of hyalinisation) or Alcian Blue, pH 2.5 (scale bar: 200 μm). (D) Quantitative assessment of the number of pixels exceeding a threshold intensity of blue, following batch staining of the tissues. Results are graphed as mean ± SD, with individual values shown.
Supplementary Fig. S1
A schematic diagram illustrating the methodology. Following removal of the epithelium, dermis tissue was processed sequentially in NaCl buffer to extract loosely/ionically bound matrix proteins, SDS buffer to collect the cellular protein fraction (not analysed in this study), and Guanidine-HCl (GuHCl) buffer to extract integral matrix proteins. The NaCl and GuHCl proteins were deglycosylated and trypsin-digested in preparation for a discovery-based quantitative proteomic assessment.
Supplementary Fig. S2
Varying abundances of common fibrillar proteins. Abundance (Total Ion Current, TIC) of (A) COL1A1, COL3A1 and their ratio [calculated using the abundance of COL1A1÷2 (Collagen I trimer is 2× COL1A1 chains plus 1× COL2A1 chain) divided by COL3A1÷3 (Collagen III trimer is 3× COL3A1 chains)]; and (B) Fibronectin, in NaCl and GuHCl extracts of normal skin (N, n = 5), normal scar (S, n = 5), and keloid (K, n = 7). Results are graphed as mean ± SD, with individual values shown. Statistical significance was calculated using Students t-tests (*, p < 0.05). (C) Western blot analysis of the NaCl tissue extracts, blotted for Fibronectin expression. In the absence of cellular proteins, sample loading was verified with Ponceau S staining of the membrane.
Supplementary Fig. S3
A reduction in basement membrane proteins in keloid scars. Abundance (Total Ion Current, TIC) of COL4A1, COL7A1 and Lamanin A3 in the NaCl extracts of normal skin (N, n = 5), normal scar (S, n = 5), and keloid (K, n = 7). Results are graphed as mean ± SD, with individual values shown. Statistical significance was calculated using Students t-tests (*, p < 0.05). (B) Immunostaining of representative tissue sections for Collagen IV (with cell nuclei stained with DAPI), indicates intact basement membrane, but less undulations and fewer blood vessels as depicted in the schematic.
Supplementary Fig. S4
A reduction in proteases in keloid scars. Abundance (Total Ion Current, TIC) of Cathepins S and Z (CATS, CATX/Z) as well as Aminopeptidase N (AMPN) and Peptidase D in NaCl extracts of normal skin (N, n = 5), normal scar (S, n = 5), and keloid (K, n = 7). Results are graphed as mean ± SD, with individual values shown. Statistical significance was calculated using Students t-tests (*, p < 0.05). Their extracellular matrix substrates are indicated.

References

    1. Andrews J.P., Marttala J., Macarak E., Rosenbloom J., Uitto J. Keloids: the paradigm of skin fibrosis - pathomechanisms and treatment. Matrix Biol. 2016;51:37–46. - PMC - PubMed
    1. J. Shaw T., Kishi K., Mori R. Wound-associated skin fibrosis: mechanisms and treatments based on modulating the inflammatory response. Endocr Metab Immune Disord Drug Targets. 2010;10(4):320–330. - PubMed
    1. Lee J.Y., Yang C.C., Chao S.C., Wong T.W. Histopathological differential diagnosis of keloid and hypertrophic scar. Am. J. Dermatopathol. 2004;26(5):379–384. - PubMed
    1. Jumper N., Paus R., Bayat A. Functional histopathology of keloid disease. Histol. Histopathol. 2015;30(9):1033–1057. - PubMed
    1. Naitoh M., Kubota H., Ikeda M., Tanaka T., Shirane H., Suzuki S., Nagata K. Genes to Cells: Devoted to Molecular & Cellular Mechanisms. 10(11) 2005. Gene expression in human keloids is altered from dermal to chondrocytic and osteogenic lineage; pp. 1081–1091. - PubMed

LinkOut - more resources