. 1977 Nov-Dec;20(3):165-89.
doi: 10.1016/0033-0620(77)90019-6.

Physiology and theory of tracer washout techniques for the estimation of myocardial blood flow: flow estimation from tracer washout

Physiology and theory of tracer washout techniques for the estimation of myocardial blood flow: flow estimation from tracer washout

J B Bassingthwaighte. Prog Cardiovasc Dis. 1977 Nov-Dec.

Abstract

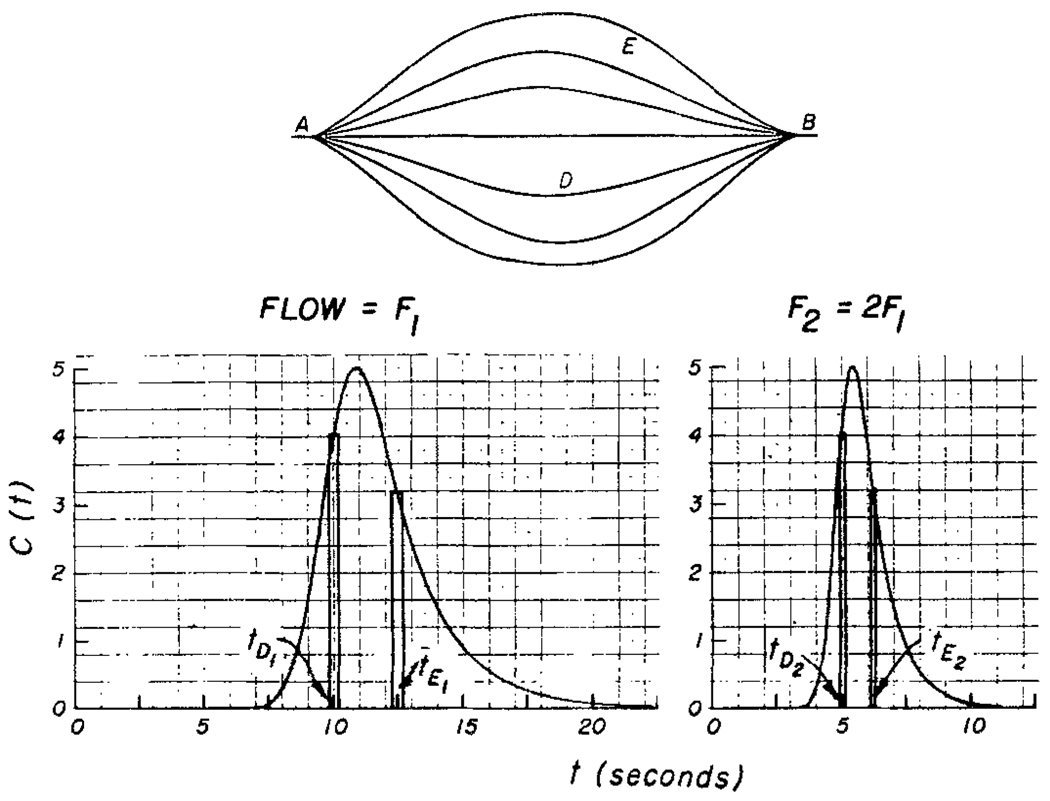
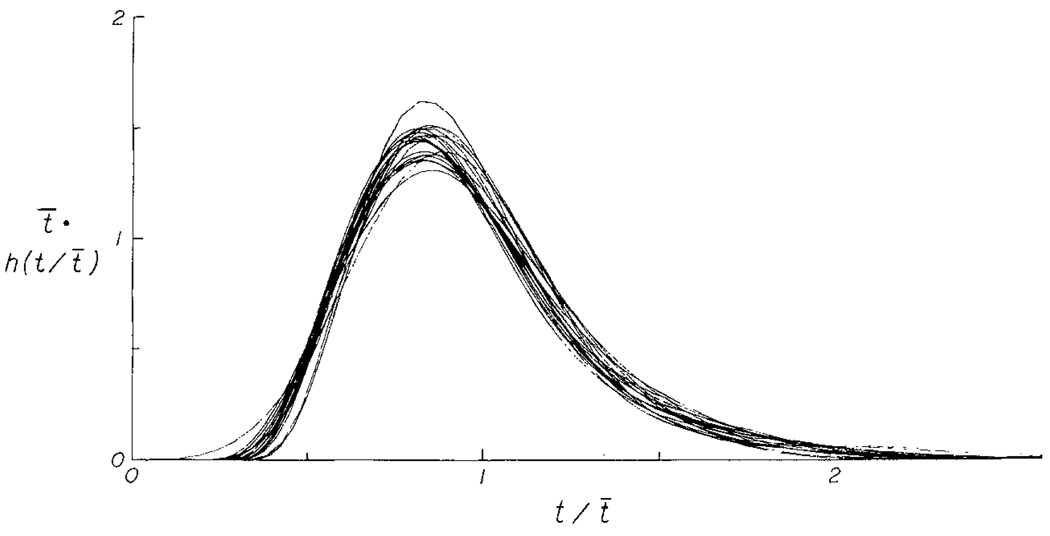
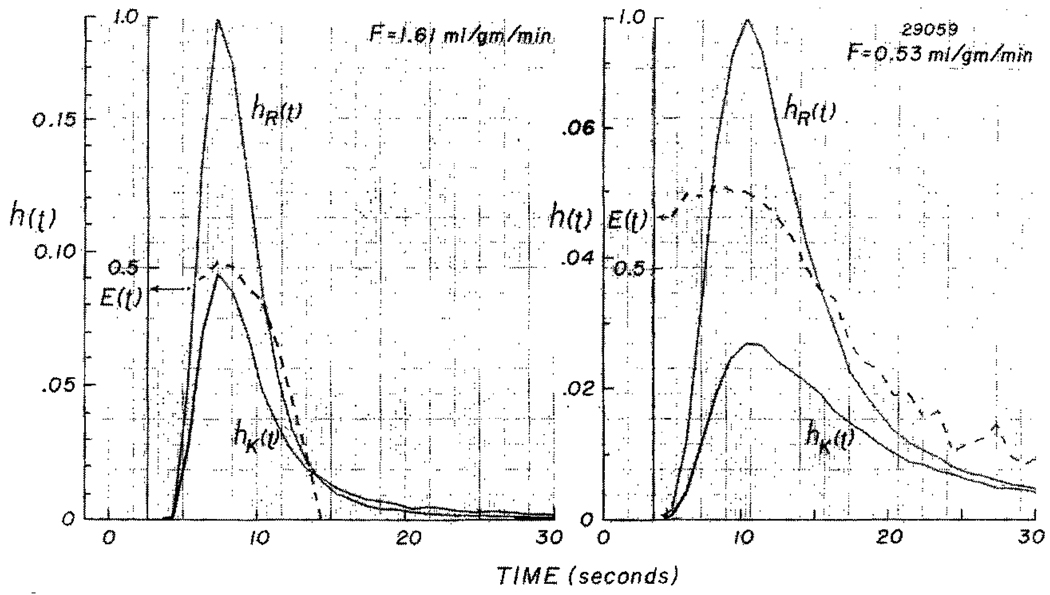
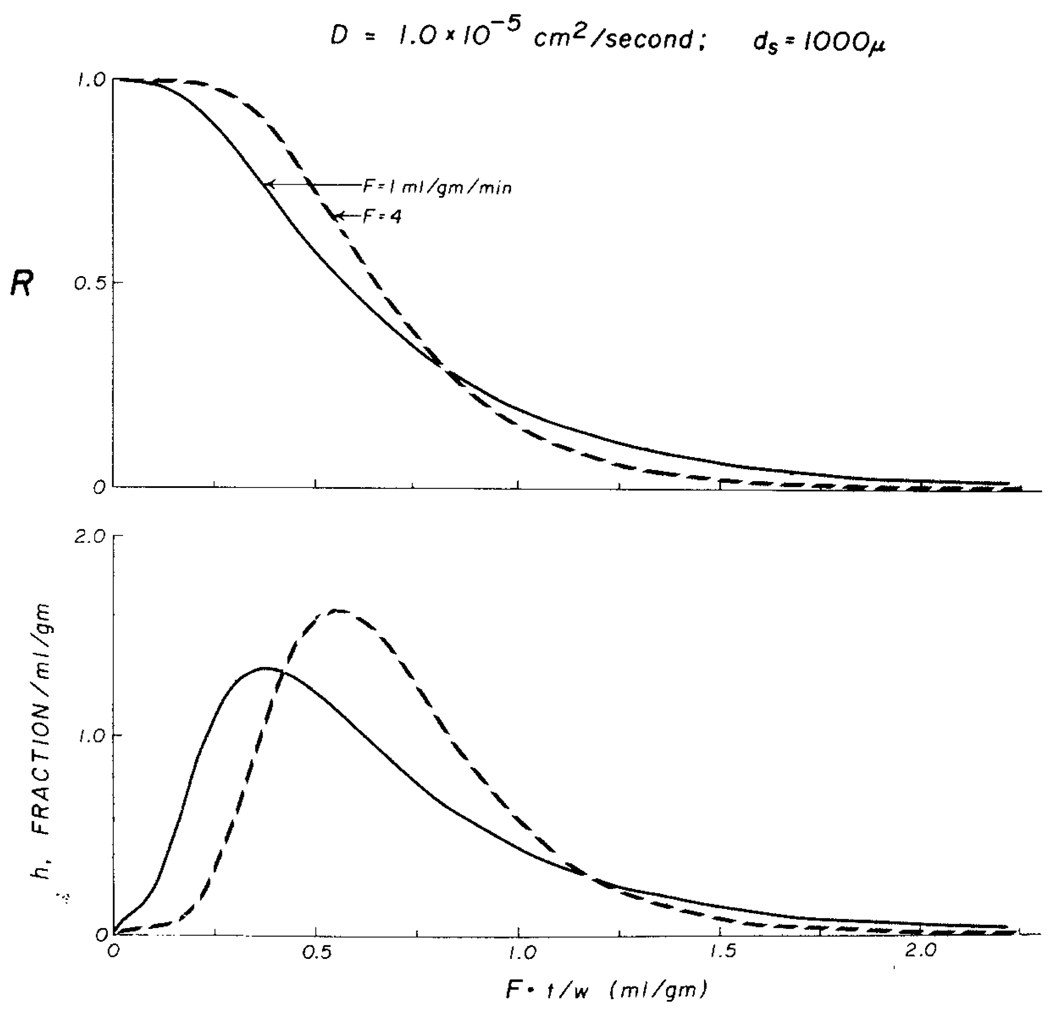
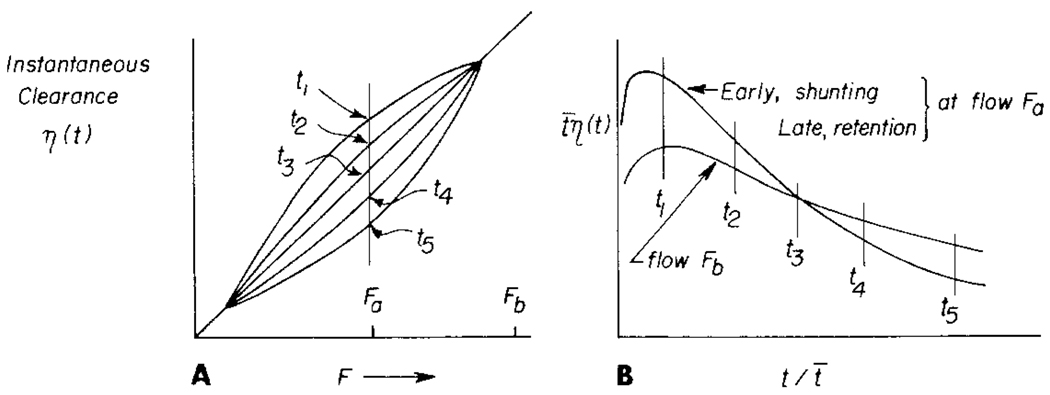
The time course of washout of tracer from the myocardium provides an estimate of the flow per unit volume when the blood-tissue exchange is flow-limited. Methods of testing for the flow-limitation and for the absence of influences of low permeability or diffusion on the washout include the uses of paired or multiple tracers and the examination for similarity of the shapes of the residue function or washout curves at varied coronary blood flows. A conceptual framework for these studies is provided by a clearance-flow diagram for the myocardium where capillaries are long compared to radial intercapillary distances. This anatomic-physiologic framework coupled with a probabilistic, general analytic approach and with various experimental approaches to tracer studies of mass transport through the heart provides a general basis for methods of estimating myocardial blood flow in the whole organ and in its component regions.


Figures

Fig. 1
Fig. 1
Clearance–flow diagram, following Renkin. The thin line of identity, where clearance equals flow, signifies that washout is completely flow-limited.
Fig. 2
Fig. 2
Microvasculature of the dog left ventricular myocardium. The vessels are filled with a white elastomer (Microfil, MV 112, Canton Biomedical Products, Inc., Boulder, Colo. 80302) and the tissue rendered transparent by replacement of the water with alcohol, then methyl salicylate. In the left to lower region is an arteriole accompanied by two venules, a typical triad. Capillaries are long and generally parallel, but have branches and interconnections. (Reproduced by permission.4)
Fig. 3
Fig. 3
Adaptations of Krogh cylinder models to the myocardial microvasculature. (A) The traditional concurrent flow model composed of hexagonal axisymmetric columns of equal length. With concurrent, identical flows in adjacent capillaries having coincident entrances and exits, there are no concentration gradients across the interfaces between regions and no net fluxes between hexagons. (B) A combination of concurrent flows in each of two groups flowing in countercurrent fashion. The exact coincidence of starting and ending points is unrealistic but quantitatively may be representative, since capillary lengths are long compared to the length over which the sudden branching from the arterioles and the confluence into the venules occur.
Fig. 4
Fig. 4
Diagram of experimental approaches to measuring the response of a system to a slug injection of tracer of dose mi. The left lower striped cylinder represents an idealized gamma detector providing a signal proportional to the amount of indicator, q(t), contained in the organ of volume V at time t, and which gives the residue function R(t). The uppermost detector provides a signal from the outflow, proportional to the effluent concentration–time curve and to h(t). Only in an idealized nonrecirculating system can H(t) be directly estimated by measuring the cumulative amount of indicator having left the organ and being collected in the chamber in front of the detector on the right.
Fig. 5
Fig. 5
Relationships between h(t), H(t), R(t), and η(t). The curve of h(t) is given by a lagged normal density curve having a relative dispersion of 0.33 and a skewness of 1.5. However, the theory is general and applies to h(t)s of all shapes. (Figs. 5–9 are similar to figures published in Seminars in Nuclear Medicine.45)
Fig. 6
Fig. 6
Tracer dilution curve with monoexponential extrapolation. The curve of tracer passing the sampling site for the first time (not recirculating) is termed the primary curve. The extrapolation is exponential, following Hamilton et al. and is an approximation. The equation for flow applies to the primary curve.
Fig. 7
Fig. 7
Three residue function curves, R(t), may have quite differing shapes (A, B, and C) but have the same area beneath the curve, ∫0 R(t)dt, and give the same estimate of flow par unit volume. Curve A represents a uniform mixing chamber; curve C represents a “piston flow” system, with all transit times the same.
Fig. 8
Fig. 8
Combined intravascular and external detection. External detection provides t̄ by equation 14A and the slope dR/dt at a particular sampling time ts. Sampling from the venous outflow from the organ at t provides the concentration. Cv(ts). The combination allows estimation of F, F/V, and therefore of V. The main source of difficulty in applying this technique is ascertaining the time delay between the organ and the sampling site in the outflow.
Fig. 9
Fig. 9
Truncation of the integration of R(t) to provide an approximate value for F/λV when recirculation masks the terminal portion of the curve. The approximation is exact when R(t) is monoexponential.
Fig. 10
Fig. 10
Diagrammatic representation of the effect of a doubling of flow rate in a system with a constant relative distribution of transit times, as would occur in a stable laminar flow system. When the flow is doubled, the area of the dilution curve is halved, and the transit time through any particular path (D or E) between A and B is also halved. In such a system, the various measures of the breadth of concentration–time curves are linearly related to the mean transit time (see text).
Fig. 11
Fig. 11
Transcoronary transport functions for plasma protein-bound indocyanine green obtained at varied flow rates (t̄ from 5.3 to 9.1 sec) in the dog. The similarity of the curves indicates flow-limited intraorgan distribution of the dye and constancy of the relative distribution of flows. The ordinate is the fraction emerging per mean transit time at each time t, and unity on the abscissa is 1 mean transit time. (Data from experiments of Knopp et al.17)
Fig. 12
Fig. 12
(A) “Similarity” of a family of residue function curves can be tested by plotting curves obtained at differing flows (left) each against time divided by its own mean transit time. Superimposition of the curves indicates similarity and that solute washout is flow-limited (right). (B) 125Iodoantipyrine washout curves obtained by external γ-detection of a blood-perfused isolated heart after bolus injection into the cannulated aortic root at various flows. F/W is the flow (ml/g−1/min−1) listed in order of the times at which R(t) = 0.5. Broken lines. F/W > 2; solid lines, 1 < F/W < 2; dotted lines, F/W < 1 ml/g−1/min−1. The range was narrow and the order apparently random, therefore, the curves demonstrate similarity.
Fig. 13
Fig. 13
Effect of flow and venous 131I-albumin and 42K curves and 42K extractions. Venous concentration-time curves for 131I-labeled albumin [hR(t)] and 42K+ [hK(t)] were normalized to fraction of injected dose, as in equation 2. At high flow (left), a greater fraction of injected dose is recovered in a shorter period, and curves are less temporally dispersed than at low flow (right). Fractional extractions [E(t), broken lines] increase to maximum (Emax) at or slightly before time of peak of hR(t). Emax is higher at a low flow and persists for approximately 4 sec before a decrease in E(t) is seen. (Reproduced by permission.43)
Fig. 14
Fig. 14
Numerical solutions for the residue functions obtained from a countercurrent exchange model, similar to that of Fig. 3B, at two different flows. The curves have been normalized by abscissa scaling in proportion to t̄, so that they would be identical if there were no diffusional shunting between inflow and outflow. Note that prolongation of the tail at the lower flow. The corollary of early shunting is late retention: tracer that is in the depths of the tissue will have a tendency to be shunted from outflow to inflow and so be retained longer in the tissue than would occur if the washout were solely flow-limited.
Fig. 15
Fig. 15
Source-to-sink diffusion. Influences of diffusional transfer of tracer between inflow and outflow on clearance.
Fig. 16
Fig. 16
Influence of diffusional shunting on clearance following an impulse injection into the arterial inflow. (A) Clearance–flow relationship at various times after tracer injection. These relationships exist only momentarily following a sudden injection, but each would apply in the steady state if the relative local concentrations were stable. Thus, at time t1, tracer is principally in the inflow region, and at time t5, tracer is deep within the tissue, as suggested by “early” and “late” in Fig. 15. (B) Normalized emergence functions at two flows: Fa, where shunting is apparent and at a higher flow, and Fb, where convective transport is rapid and diffusional shunting negligible.
Fig. 17
Fig. 17
Local radial concentration equilibration and negligible axial diffusional transport from entrance to exit means flow-limited exchange of tracer, region III of Fig. 15. Flow in the capillary is from left to right; relative brightness indicates relative concentrations in capillary and tissue after an impulse injection at the upper end of the capillary 0.3 sec earlier. Solution of convection–diffusion model of Bassingthwaighte, Knopp, and Hazelrig with DR ≫ Dx radial diffusivity much greater than axial.
Fig. 18
Fig. 18
Concentration profiles in capillary–tissue model with a significant capillary permeability barrier and additional radial diffusion limitation. Response to impulse injection of tracer at the input 0.5 sec earlier. Flow in capillary is from left to right. Solution of convection–diffusion model or Bassingthwaighte, Knopp, and Hazelrig with capillary velocity = 0.1 cm/sec, PS/F = 2, and radial diffusive velocity = diffusion coefficient/cylinder radius = 0.04 cm/sec. The lower panel shows the concentration–time curve at the outflow.
Fig. 19
Fig. 19
(A)Frontal view of dog heart. (B) Coronal rings of left ventricle: top ring is base of heart. Arrows point to position of major coronary vessels on these rings. (C) Diagram of the division of one left ventricular ring into 8 segments and into 12 concentric cylinders from endocardium to epicardium. (Reproduced with permission from the American Heart Association.40)
Fig. 20
Fig. 20
Relative deposition densities of 9µ microspheres in a 1-cm thick mid-left ventricular slice of an anaesthetized baboon heart, demonstrating higher densities (flows) in the subendocardial region. The densities relative to the mean density for the heart are shown by the shading according to the calibration scale. Gradations are at 0.13 times the mean flow for the whole heart, so that in this slice, the range was room 0.6 to 1.9 times the mean myocardial flow. The relative areas are proportional to the mass of each piece, there being six pieces from endocardium to epicardium. (Data from experiments with R. B. King. J. R. S. Holes, L B. Rowell, and O. A. Smith.)
Fig. 21
Fig. 21
Frequency functions of relative deposition densities of microspheres in the whole left ventricle of one awake baboon, interpreted as regional flows relative to the mean myocardial flow. Six situations are represented, two at rest, two at moderate heat stress (low), and two at severe heat stress (high). The coronary blood flows were: control, 2.33 and 2.31 ml/g−1/min−1; low heat stress, 1.4 and 1.9; and high heat stress, 2.0 and 3.0. The relative dispersions of the six distributions were 0.25 ± 0.03. (Experiments with R. B. King, J. R. S. Hales, L. B. Rowell, and O. A. Smith.)

References

    1. Zierler KL. Equations for measuring blood flow by external monitoring of radioisotopes. Circ Res. 1965;16:309–321. - PubMed
    1. Chinard FP, Enns T, Nolan MF. Indicator–dilution studies with “diffusible” indicators. Circ Res. 1962;10:473, 490. - PubMed
    1. Renkin EM. Transport of potassium-42 from blood to tissue in isolated mammalian skeletal muscles. Am J Physio1. 1959;197:1205–1210. - PubMed
    1. Bassingthwaighte JB, Yipintsoi T, Harvey RB. Microvasculature of the dog left ventricular myocardium. Microvasc Res. 1974;7:229–249. - PMC - PubMed
    1. Guller B, Yipintsoi T, Orvis AL, et al. Myocardial sodium extraction at varied coronary flows in the dog: Estimation of capillary permeability by residue and out-flow detection. Circ Res. 1975;37:359–378. - PMC - PubMed

Publication types

LinkOut - more resources