. 2021 Feb 6;55(1):91-116.
doi: 10.33594/000000327.

Multiomics-Identified Intervention to Restore Ethanol-Induced Dysregulated Proteostasis and Secondary Sarcopenia in Alcoholic Liver Disease

Affiliations

Multiomics-Identified Intervention to Restore Ethanol-Induced Dysregulated Proteostasis and Secondary Sarcopenia in Alcoholic Liver Disease

Shashi Shekhar Singh et al. Cell Physiol Biochem. .

Abstract

Background/aims: Signaling and metabolic perturbations contribute to dysregulated skeletal muscle protein homeostasis and secondary sarcopenia in response to a number of cellular stressors including ethanol exposure. Using an innovative multiomics-based curating of unbiased data, we identified molecular and metabolic therapeutic targets and experimentally validated restoration of protein homeostasis in an ethanol-fed mouse model of liver disease.

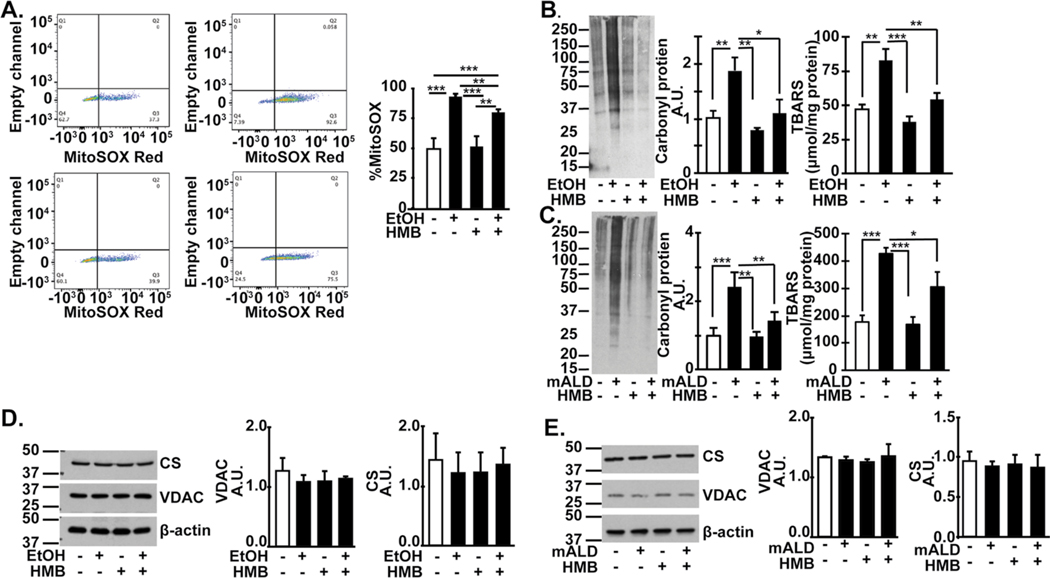
Methods: Studies were performed in ethanol-treated differentiated C2C12 myotubes and physiological relevance established in an ethanol-fed mouse model of alcohol-related liver disease (mALD) or pair-fed control C57BL/6 mice. Transcriptome and proteome from ethanol treated-myotubes and gastrocnemius muscle from mALD and pair-fed mice were analyzed to identify target pathways and molecules. Readouts including signaling responses and autophagy markers by immunoblots, mitochondrial oxidative function and free radical generation, and metabolic studies by gas chromatography-mass spectrometry and sarcopenic phenotype by imaging.

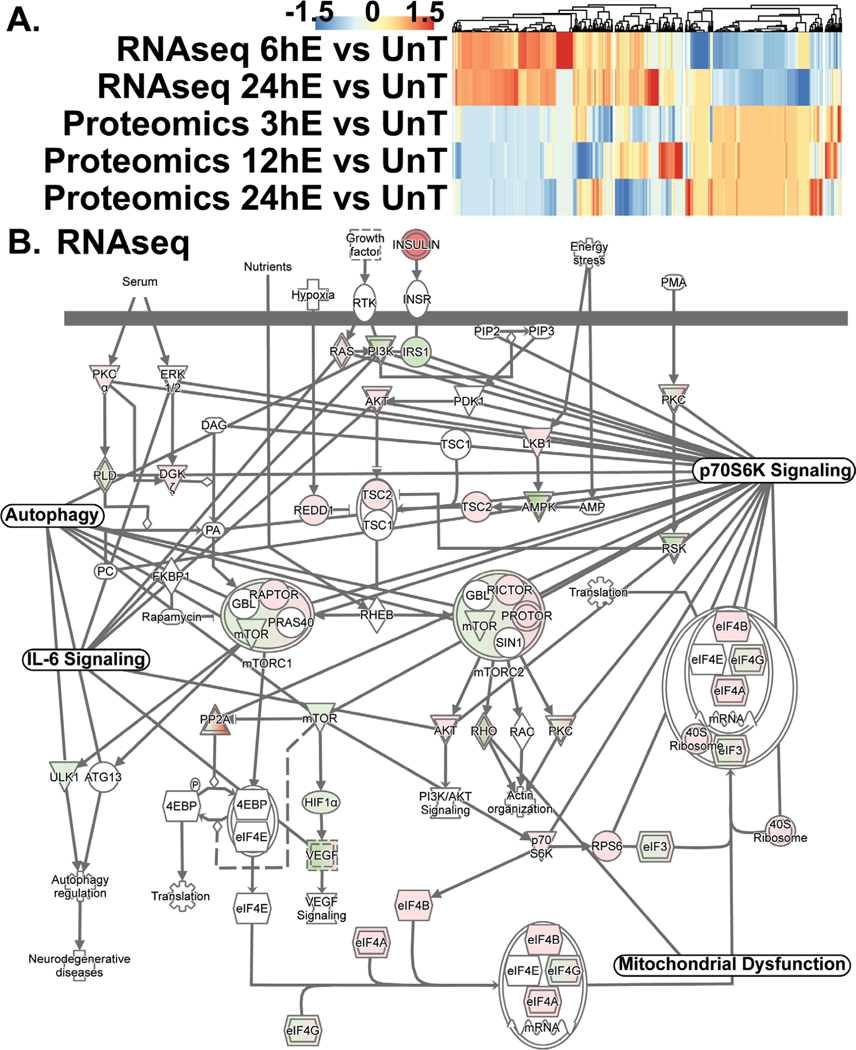
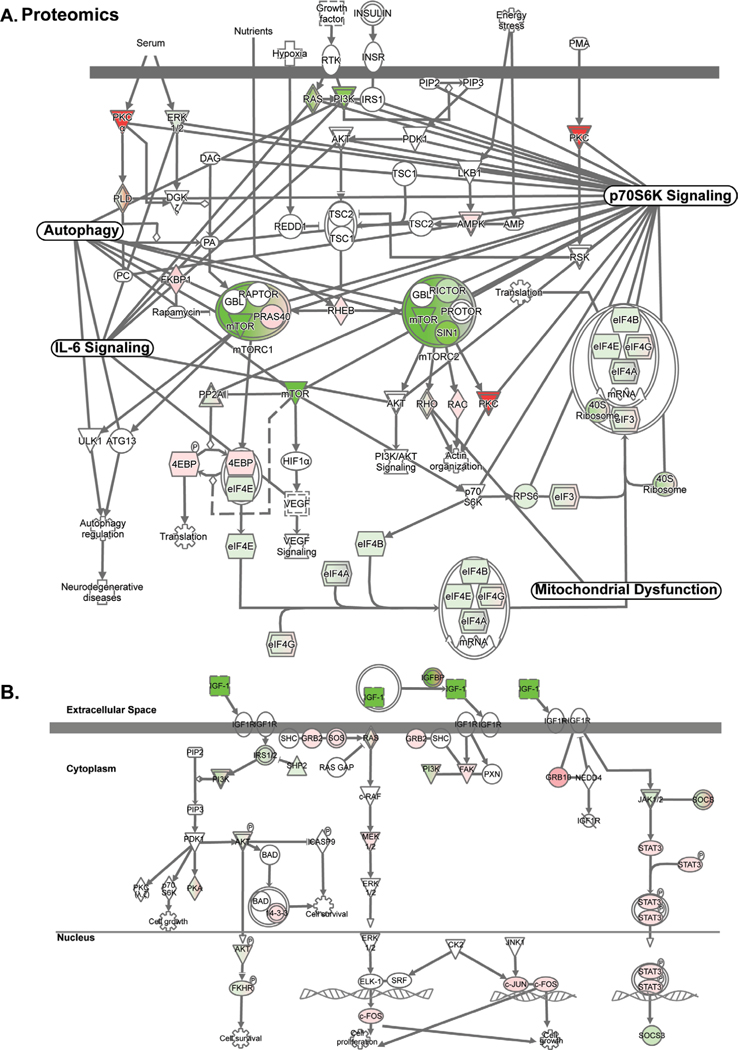
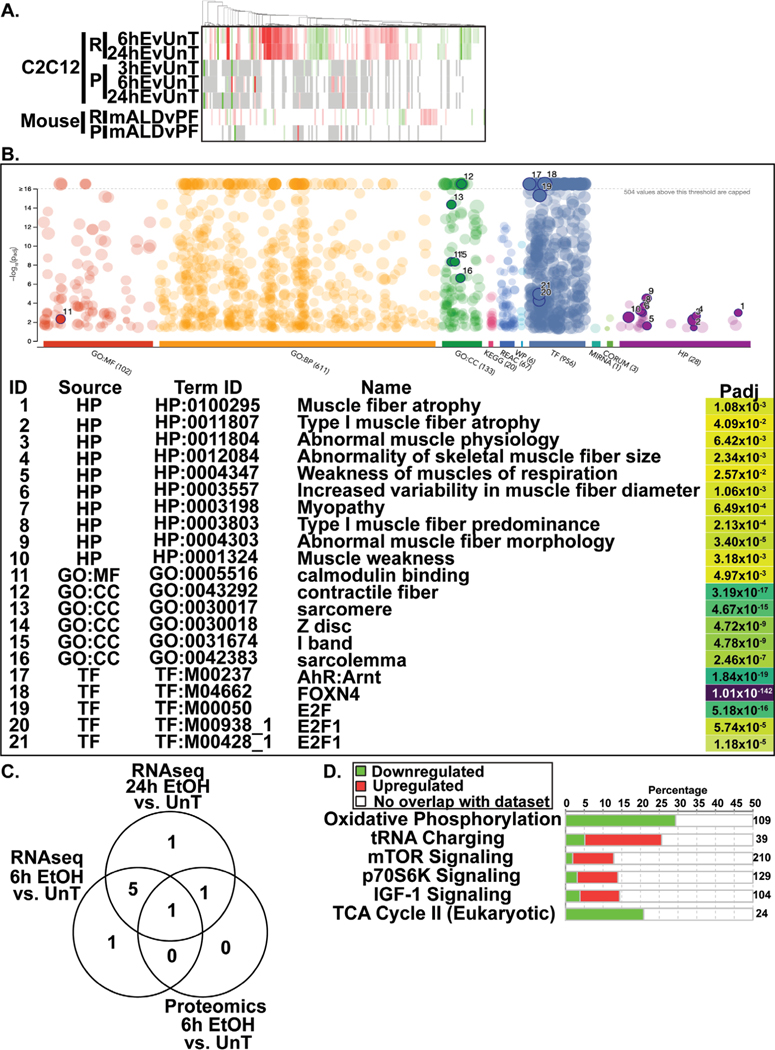
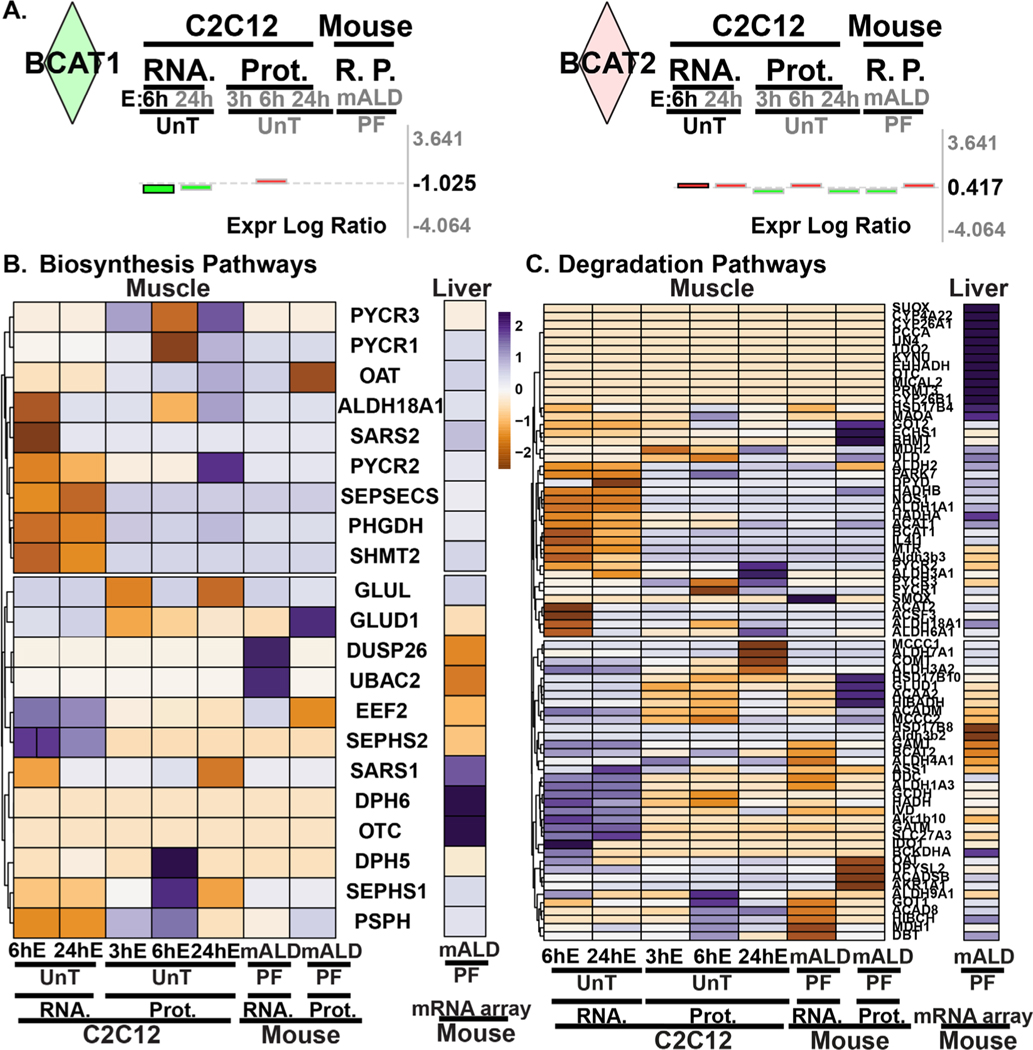
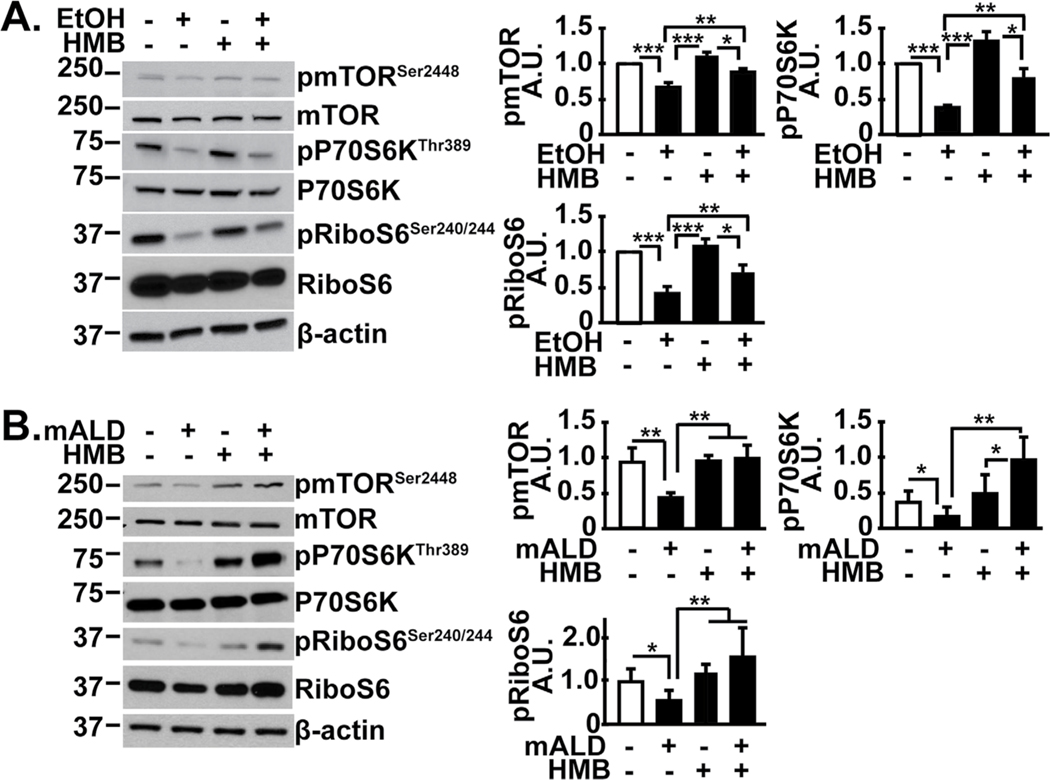
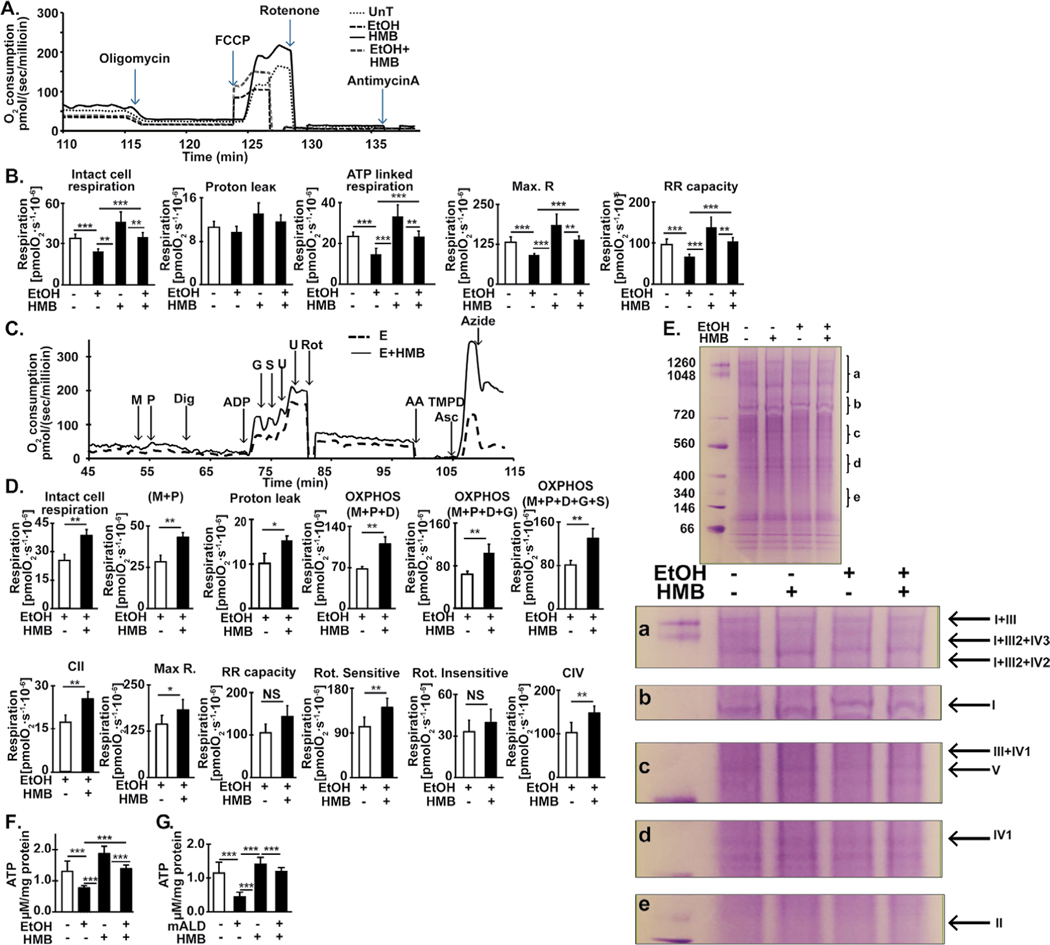
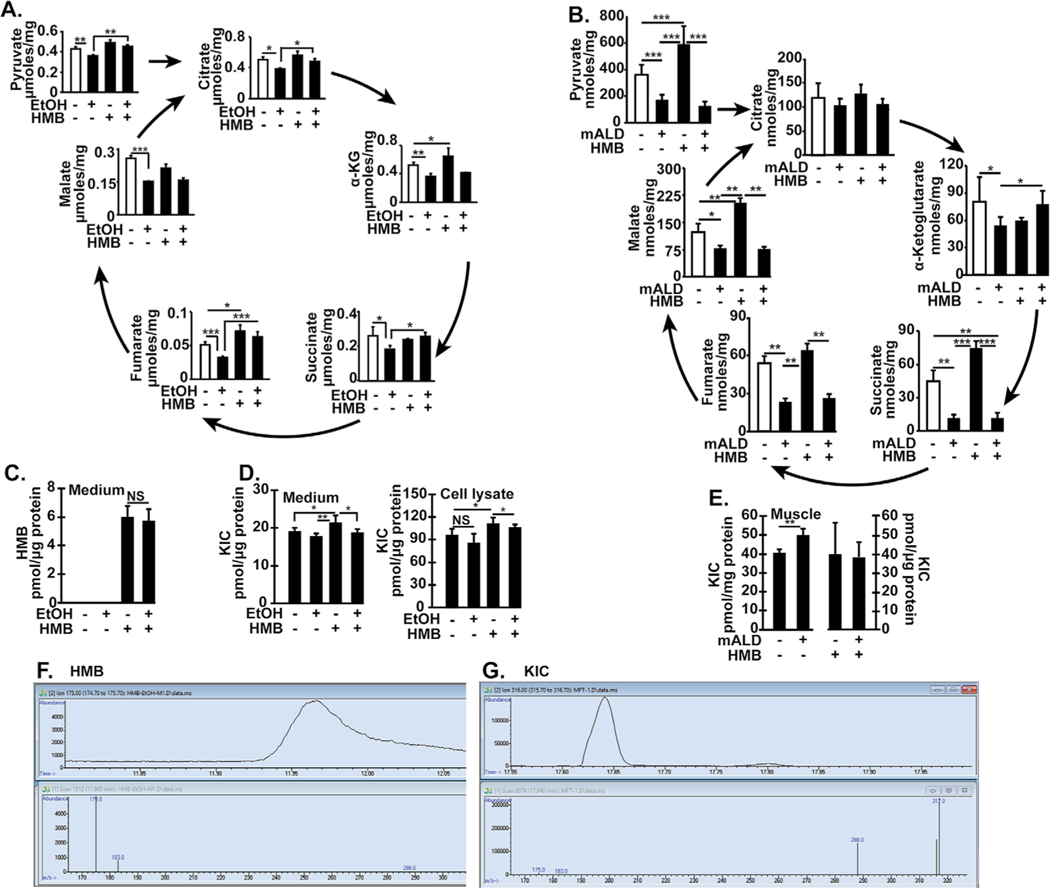
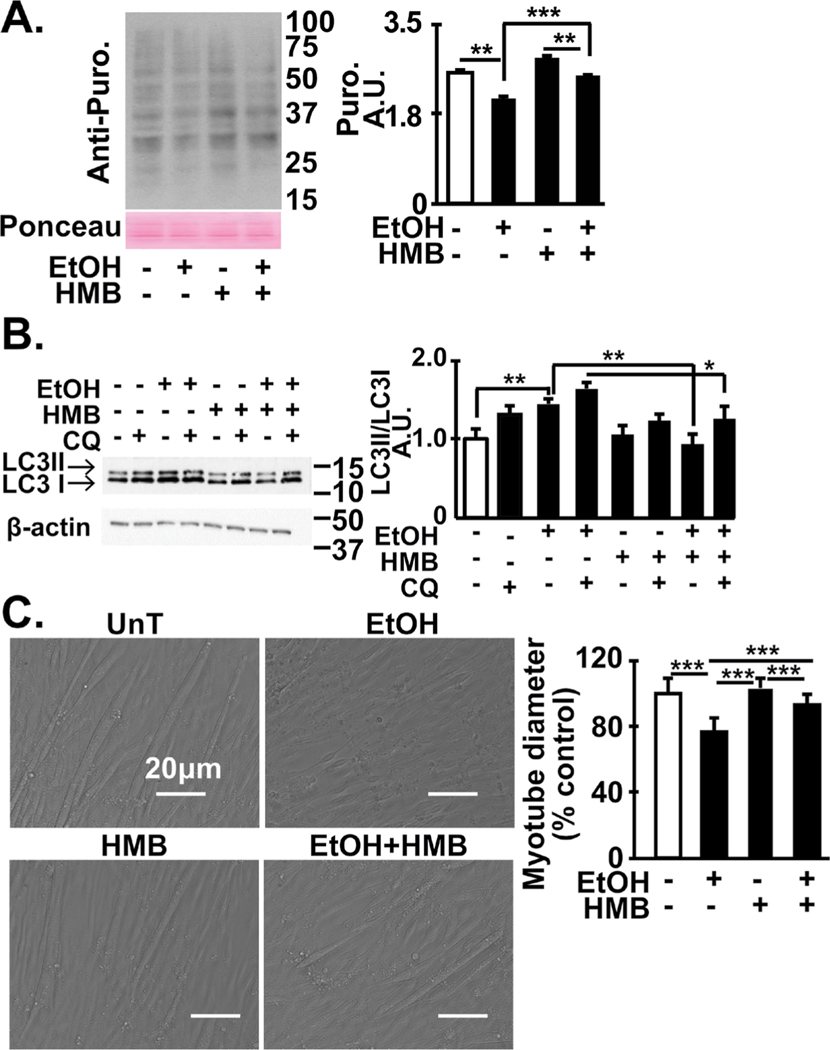
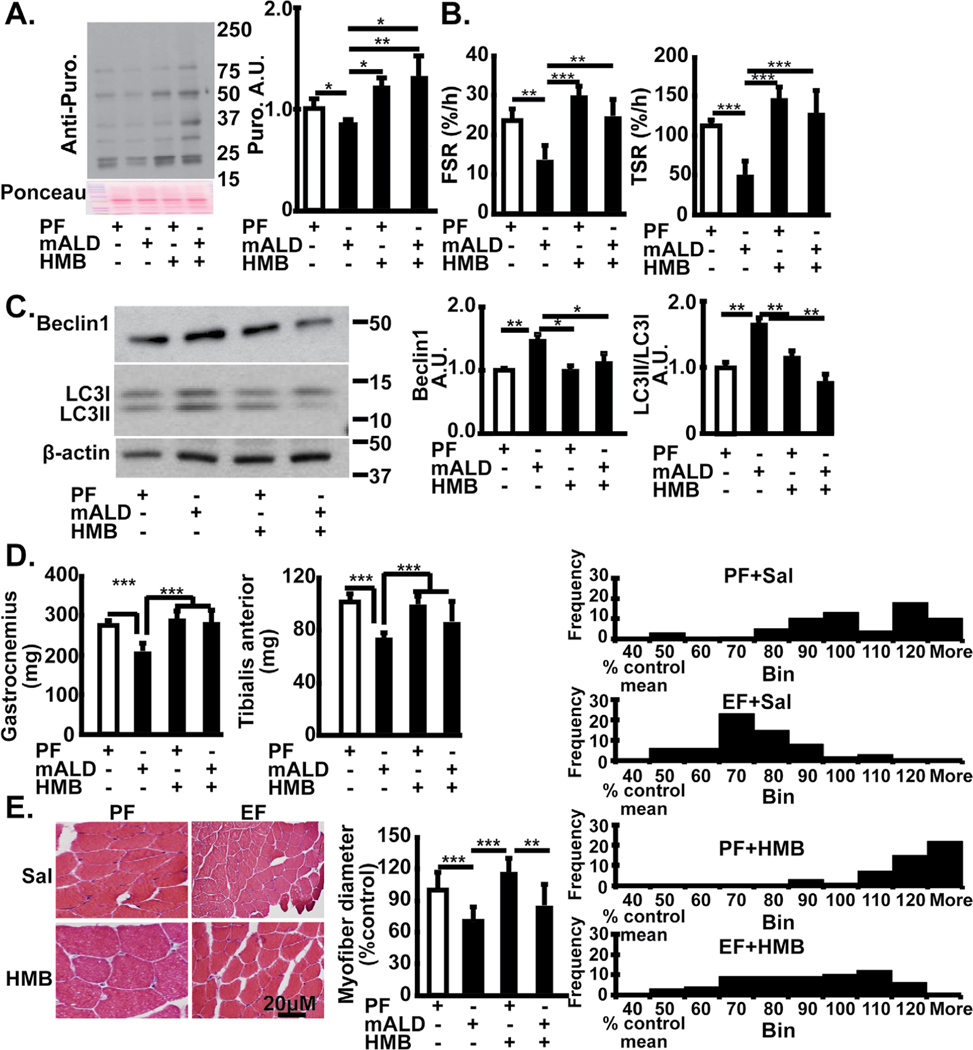
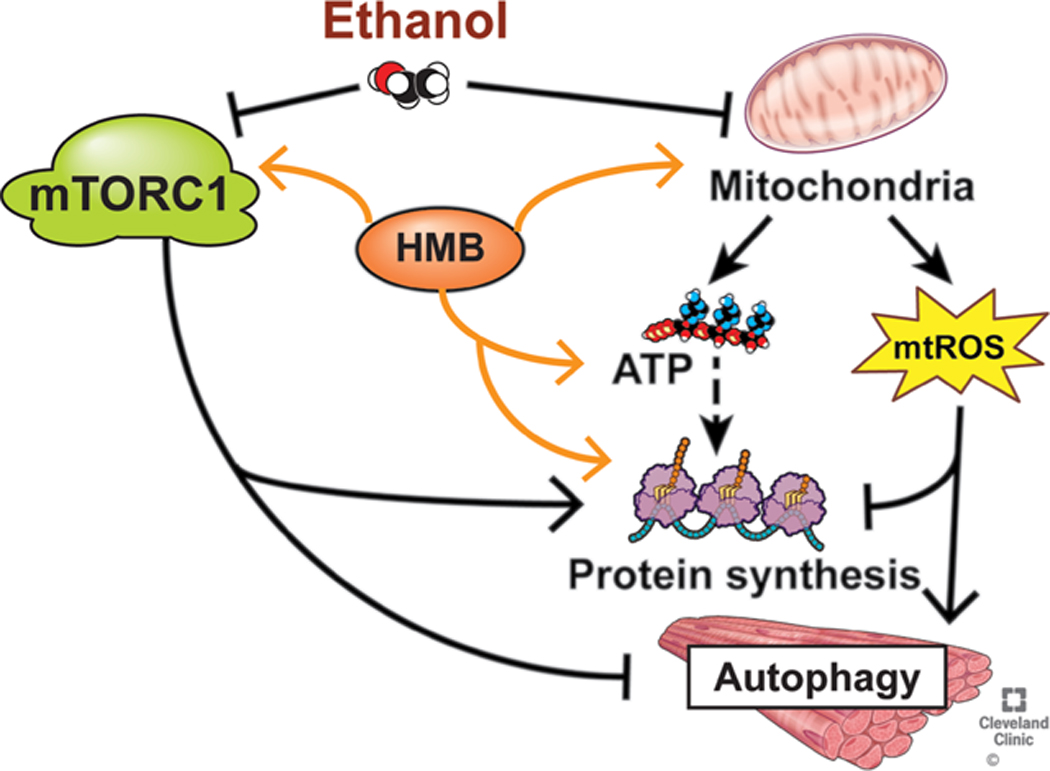
Results: Multiomics analyses showed that ethanol impaired skeletal muscle mTORC1 signaling, mitochondrial oxidative pathways, including intermediary metabolite regulatory genes, interleukin-6, and amino acid degradation pathways are β-hydroxymethyl-butyrate targets. Ethanol decreased mTORC1 signaling, increased autophagy flux, impaired mitochondrial oxidative function with decreased tricarboxylic acid cycle intermediary metabolites, ATP synthesis, protein synthesis and myotube diameter that were reversed by HMB. Consistently, skeletal muscle from mALD had decreased mTORC1 signaling, reduced fractional and total muscle protein synthesis rates, increased autophagy markers, lower intermediary metabolite concentrations, and lower muscle mass and fiber diameter that were reversed by β-hydroxymethyl-butyrate treatment.

Conclusion: An innovative multiomics approach followed by experimental validation showed that β-hydroxymethyl-butyrate restores muscle protein homeostasis in liver disease.

Keywords: Autophagy; Mitochondria; Pathway-analyses; Protein synthesis; Proteomics; Transcriptomics.


Conflict of interest statement

The authors have no conflicts to declare.

Figures

Fig. 1.
Fig. 1.
Multiomics analyses identified HMB responsive targets in ethanol-treated myotubes. (A). Differentially expressed genes on transcriptomics and proteomics in myotubes treated with 100 mM ethanol for different times compared with responses in untreated myotubes. (B). Integrated network of transcriptome from ethanol-treated myotubes of HMB targets- mTORC1 signaling with nodes including mitochondrial dysfunction, p70S6k signaling, AMPK signaling, and senescence pathways connected via shared molecules.
Fig. 2.
Fig. 2.
Regulatory networks in ethanol treated myotubes identify HMB targets. (A). Integrated network of the proteome from ethanol-treated myotubes of HMB targets- mTORC1 signaling with nodes including mitochondrial dysfunction, p70S6k signaling, AMPK signaling, and senescence pathways connected via shared molecules. (B). Integrated network of IGF-1 signaling pathway in ethanol treated myotubes. N= 3 biological replicates for untreated and ethanol-treated myotubes. Significance for proteomics and transcriptomics expression levels for cells was limited to p<0.05. Significance for pathway enrichment analysis was limited to -log(p-value)= > 1.3.
Fig. 3.
Fig. 3.
Ethanol induced transcriptome and proteome perturbations in ethanol-treated myotubes and mice with alcohol-related liver disease. (A). Heatmap of the transcriptome and proteome of the ubiquitination pathway in ethanol treated myotubes and muscle from mALD. (B). g:Profiler results for RNAseq data from differentially upregulated genes in 6h EtOH treated C2C12 myotubes compared to untreated myotubes. (C). Venn diagram of differentially expressed unique and shared HMB target genes on the transcriptome and proteome in ethanol-treated myotubes at different timepoints aligned with genes involved in sarcopenia on OpenTarget. (D). Differentially expressed genes regulating muscle protein homeostasis pathways in the transcriptome of mALD.
Fig. 4.
Fig. 4.
Ethanol induced alterations in amino acid metabolism enzyme expression. (A). Log fold change expression levels of BCAT1 and BCAT2 in the transcriptome and proteome in C2C12 myotubes and mALD versus untreated controls and PF mice. (B). Heatmap of differentially expressed genes regulating non-essential amino acid biosynthesis pathways. (C). Heatmap of differentially expressed genes regulating proteinogenic (essential and non-essential) amino acid degradation pathways. EtOH/E: ethanol; HMB: β-hydroxy-β-methyl butyrate; UnT: untreated controls; PF: pair-fed mice; mALD: mouse model of ALD; Prot, P.: proteomics; RNA, R.: RNAseq. N = 3 biological replicates for untreated and ethanol-treated myotubes; N = 4 mice in mALD and PF groups. Significance for proteomics and transcriptomics expression levels for cells and tissue (muscle and liver) was limited to p<0.05. Significance for pathway enrichment analysis was limited to -log(p-value)= ≥ 1.3.
Fig. 5.
Fig. 5.
HMB reversed impaired mTORC1 signaling in alcoholic liver disease. Representative immunoblots and densitometry of phosphorylated mTOR (Ser2448) and signaling response to mTORC1 activation (phosphorylation of P70S6 kinase and ribosomal S6 protein) shown. (A). Differentiated C2C12 myotubes that were untreated or treated with 100 mM ethanol, with or without 50 μM HMB. (B) Studies in gastrocnemius muscle from PF or mALD mice with or without HMB. All data expressed as mean±SD from at least three biological replicates for experiments in C2C12 myotubes; n=6 mALD and n=4 PF mice in each group. * p<0.05; ** p<0.01, *** p<0.001. EtOH: ethanol; HMB β-hydroxy-β-methyl butyrate; UnT: untreated controls; PF: pair-fed mice; mALD: mouse model of ALD.
Fig. 6.
Fig. 6.
Ethanol impairs and HMB restores mitochondrial respiration in differentiated C2C12 myotubes and ATP content in muscle from mice model of ALD. (A). Representative tracings of high-resolution respirometry to quantify intact cell respiration of differentiated C2C12 myotubes. After initial stabilization, ATP synthetase inhibitor, oligomycin (O) was added, and oxygen consumption quantified to determine the oligomycin-sensitive and -insensitive respiration. Uncoupler of oxidative phosphorylation, FCCP (U) at 0.5 μM increments was then added to quantify maximum respiratory capacity. This was followed by rotenone (R) 375 nM final concentration, to inhibit complex I of the ETC, and then 2.5 μM antimycin A (Aa), which inhibits complex III, was added to determine non-mitochondrial respiration. (B) Intact, non-permeabilized C2C12 myotubes in basal DMEM medium were either untreated or treated with 100 mM ethanol for 6h with and without 50μM HMB for 6h. Basal cell respiration, proton leak, ATP-linked respiration, maximum respiratory capacity (Max. Resp.) from the response to FCCP and reserve respiratory capacity (Reserve Resp.) were measured. (C) Representative tracings of high-resolution respirometry to quantify respiration of permeabilized differentiated C2C12 myotubes. After initial stabilization, 2 mM malate (M) and 2.5 mM pyruvate (P) were added. This was followed by 4.1 mM digitonin (Dig) to permeabilize the cell membrane without losing the integrity of cells or mitochondria for permitting entry of mitochondrial substrates inside the cells; 2.5 mM ADP (D); 10 mM glutamate (G); 10 mM succinate (S); 2 mM increments of FCCP (U) for measuring maximum respiration; 375 nM rotenone (R); 125 nM antimycin A (Aa); 2 mM ascorbate and 2 mM TMPD (tetramethyl p-phenylene diamine) (AT) to test complex IV activity; 50 mM sodium azide (Az) to inhibit complex IV activity. (D) Oxygen consumption was measured in intact non-permeabilized C2C12 myotubes treated with 100 mM ethanol with and without HMB in mitochondrial respiration buffer followed by digitonin permeabilization and ETC complex specific substrates and inhibitors sequentially in the concentrations as stated above. Intact cell respiration, oxidative phosphorylation (OXPHOS) in response to M, P, D, G and S, and Max. R and RR capacity (response to U) were quantified. Rotenone-sensitive and -insensitive respiration and complex II and IV function were measured. (E) Blue native gel electrophoresis of isolated mitochondria to evaluate mitochondrial supercomplex assembly. (F)Total ATP content in C2C12 myotubes either untreated or treated with 100mM ethanol for 6hours with and without 50 μM HMB. (G) ATP content in gastrocnemius muscle from mALD mice with and without HMB compared to that from PF mice with and without HMB. * p<0.05; ** p<0.01, *** p<0.001. EtOH: ethanol; HMB β-hydroxy-β-methyl butyrate; UnT: untreated controls; PF: pair-fed mice; mALD: mouse model of ALD.
Fig. 7.
Fig. 7.
Ethanol-induced increased in free radical generation is reversed by HMB. Studies in differentiated C2C12 myotubes treated with/without 100mM ethanol with/without 50 mM HMB for 6h. (A). Representative flow cytometry of myotubes gated for MitoSox fluorescence and percentage of MitoSox fluorescent cells. (B). Representative immunoblots of carbonylated proteins and densitometry, and TBARS in myotubes treated with/without 100mM ethanol with/without 50 mM HMB for 6h. (C) Representative immunoblots and densitometry of carbonylated proteins, and tissue concentration of TBARS in gastrocnemius muscle from mALD and PF mice treated with/without HMB. (D) Representative immunoblots and densitometry of voltage dependent anion channel (VDAC) and citrate synthase (CS) expression in myotubes as measures of mitochondrial mass. (E). Representative immunoblots of VDAC and CS in gastrocnemius muscle from PF mice and mALD and PF mice treated with and without HMB. All data expressed as mean±SD from at least three biological replicates for experiments in C2C12 myotubes and n=4 PF and n=6 mice. *p<0.05; **p<0.01; ***p<0.001. EtOH: ethanol, TBARS: thiobarbituric acid reactive substances; UnT: untreated controls; PF: pair-fed; mALD: mouse model of ALD.
Fig. 8.
Fig. 8.
Intermediary metabolites decreased in ethanol treated myotubes and skeletal muscle in mice with ALD reversed by HMB. (A). Pyruvate and TCA cycle intermediates were quantified by mass spectrometry in C2C12 myotubes that were either untreated or treated with 100 mM EtOH with/without 50 μM HMB for 6hours (B) Pyruvate and TCA cycle intermediates were quantified by mass spectrometry in gastrocnemius muscle from PF mice and mALD treated with and without HMB. (C) Concentration of HMB in medium from myotubes treated with/without HMB. (D) Concentration of KIC in medium and myotube lysates treated with and without HMB. (E) Concentration of KIC in gastrocnemius muscle from mALD and PF mice treated with/without HMB. (F) Representative chromatograms and mass spectra of HMB in medium. (G) Representative chromatograms and mass spectra of KIC in gastrocnemius muscle from mALD. All data expressed as mean±SD from at least 6 biological replicates for experiments in myotubes and n=4 for PF and n=6 for mALD in each group. * p<0.05; ** p<0.01, *** p<0.001. EtOH: ethanol; HMB β-hydroxy-β-methyl butyrate; UnT: KIC a-keto isocaproic acid; untreated controls; PF: pair-fed; mALD: mouse model of ALD; TCA:Tricarboxylic acid.
Fig. 9.
Fig. 9.
Skeletal muscle dysregulated proteostasis and ethanol-induced phenotype reversed by HMB. (A) Representative immuno- blots and densitometry (for the indicated conditions) for puromycin incorporation in C2C12 myotubes that were untreated or treated with 100 mM ethanol with or without 50 μM HMB. (B) Representative immunoblots and densitometry of LC3 lipidation in in differentiated C2C12 myotubes treated with 100 mM ethanol for 6h with and without 50 μM HMB. Chloroquine was used to determine autophagy flux. (C). Representative photomicrographs of C2C12 myotubes treated with and without ethanol and HMB. Mean diameter of at least 100 myotubes in each group. All data mean+SD from at least 3 biological replicates for myotubes and n=4 PF and n=6 mALD mice. *p<0.05; **p<0.01; ***p<0.001. EtOH: ethanol; HMB β-hydroxy-β-methyl butyrate; UnT: untreated controls; PF: pair-fed; mALD: mice with alcoholic liver disease.
Fig. 10.
Fig. 10.
Skeletal muscle responses to HMB in muscle from mice with ALD. (A). Representative immunoblots of incorporation of puromycin in ex vivo gastrocnemius muscle from PF mice and mALD treated with and without HMB. Densitometry of all blots in each lane. (B). Fractional and total synthesis rate of muscle protein in gastrocnemius muscle from PF mice and mALD above. (C). Representative immunoblots and densitometry of LC3 lipidation and Beclin 1 expression in mouse gastrocnemius muscle from mALD and PF mice with or without HMB. (D). Tissue weight (gm) of gastrocnemius and tibialis anterior muscles from mALD and PF mice treated with or without HMB. (E). Representative cross-sectional histological cryosections of gastrocnemius muscle oriented in the longitudinal direction from mALD and PF mice treated with or without HMB. All data expressed as mean±SD from n=4 PF mice and n= 6 mALD. * p<0.05; ** p<0.01, *** p<0.001. EtOH: ethanol; HMB β-hydroxy-β-methyl butyrate; UnT: untreated controls; PF: pair-fed; mALD: mouse model of ALD.
Fig. 11.
Fig. 11.
Ethanol induced perturbations in skeletal muscle that are responsive to HMB supplementation.

References

    1. Ferreira LLG, Andricopulo AD: ADMET modeling approaches in drug discovery. Drug Discov Today 2019;24:1157–1165. - PubMed
    1. Davuluri G, Welch N, Sekar J, Gangadhariah M, Alsabbagh Alchirazi K, Mohan ML, et al.: Activated protein phosphatase 2A disrupts nutrient sensing balance between mTORC1 and AMPK causing sarcopenia in alcoholic liver disease. Hepatology 2020; DOI: 10.1002/hep.31524. - DOI - PMC - PubMed
    1. Dasarathy J, McCullough AJ, Dasarathy S: Sarcopenia in Alcoholic Liver Disease: Clinical and Molecular Advances. Alcohol Clin Exp Res 2017;41:1419–1431. - PMC - PubMed
    1. Kimball SR, Lang CH: Mechanisms Underlying Muscle Protein Imbalance Induced by Alcohol. Annu Rev Nutr 2018;38:197–217. - PMC - PubMed
    1. Steiner JL, Lang CH: Dysregulation of skeletal muscle protein metabolism by alcohol. Am J Physiol Endocrinol Metab 2015;308:E699–712. - PMC - PubMed

MeSH terms