

Comparison of serum and plasma SDMA measured with point-of-care and reference laboratory analysers: implications for interpretation of SDMA in cats
- PMID: 33544013
- PMCID: PMC11197123
- DOI: 10.1177/1098612X20983260
Comparison of serum and plasma SDMA measured with point-of-care and reference laboratory analysers: implications for interpretation of SDMA in cats
Abstract
Objectives: Symmetric dimethylarginine (SDMA) reflects the glomerular filtration rate (GFR) in people, dogs and cats. Initial assays used a liquid chromatography-mass spectroscopy (LC-MS) technique. A veterinary immunoassay has been developed for use in commercial laboratories and point-of-care (POC) laboratory equipment. This study sought to: determine POC and commercial laboratory (CL) SDMA assay imprecision; determine any bias of the POC assay compared with the CL assay; calculate observed total error of the POC assay and compare with analytical performance goals; and calculate dispersion and sigma metrics (σ) for POC and CL SDMA methods.
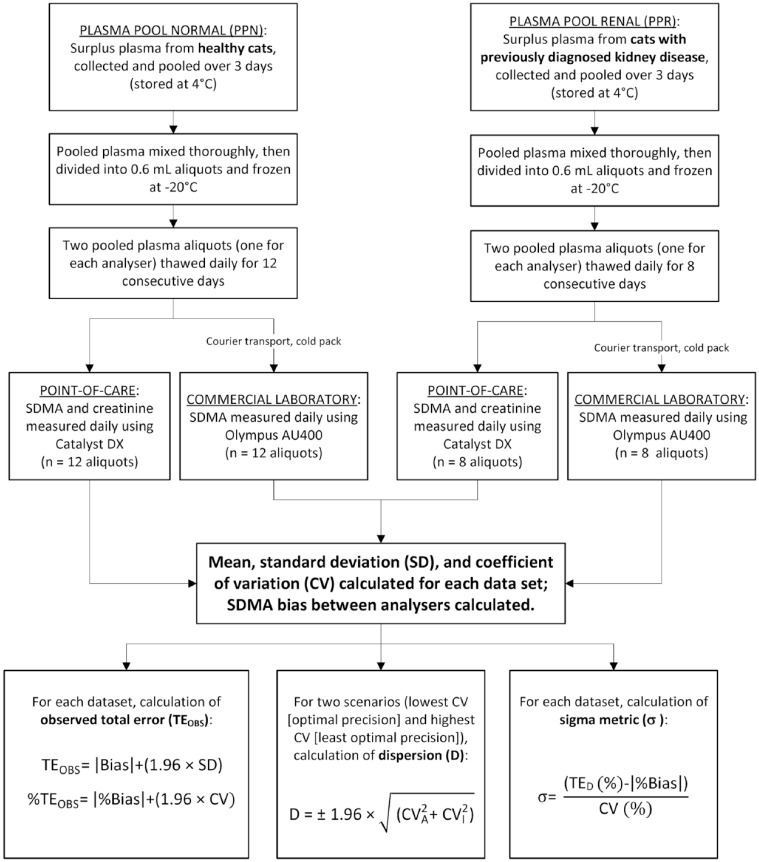
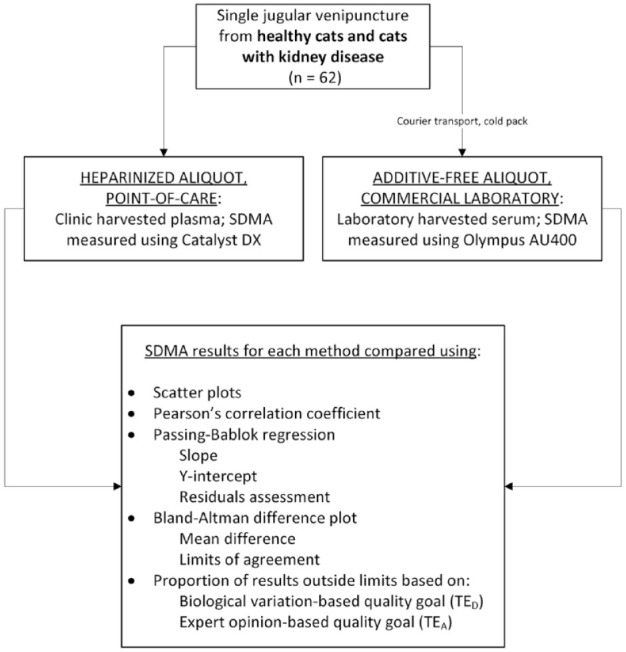
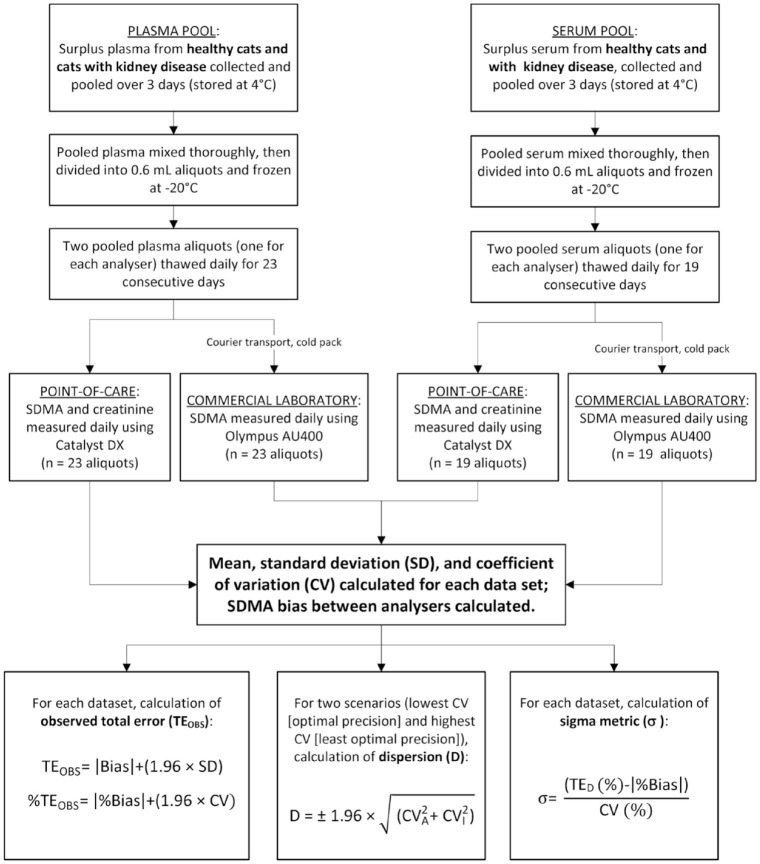
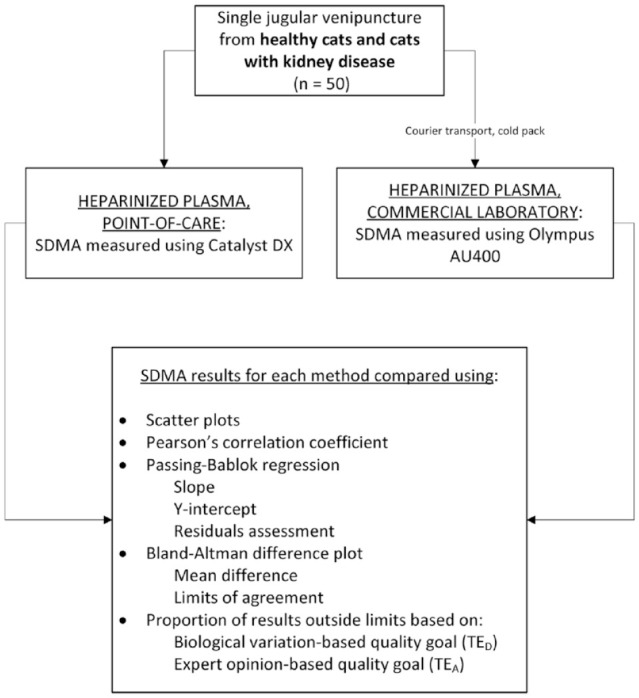
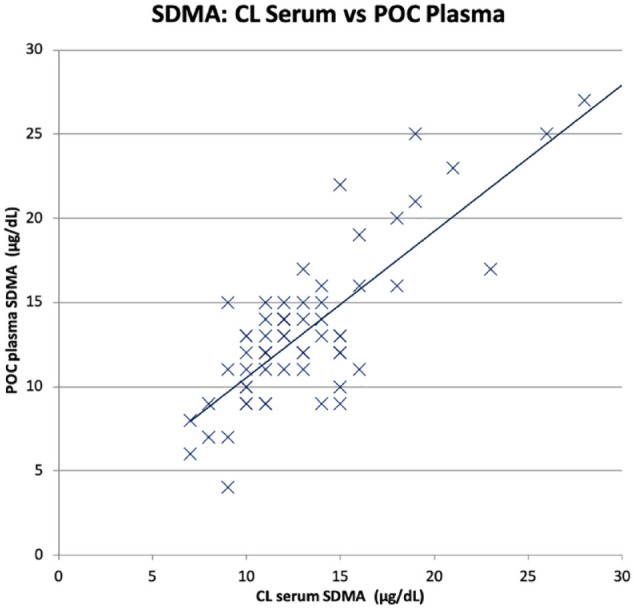
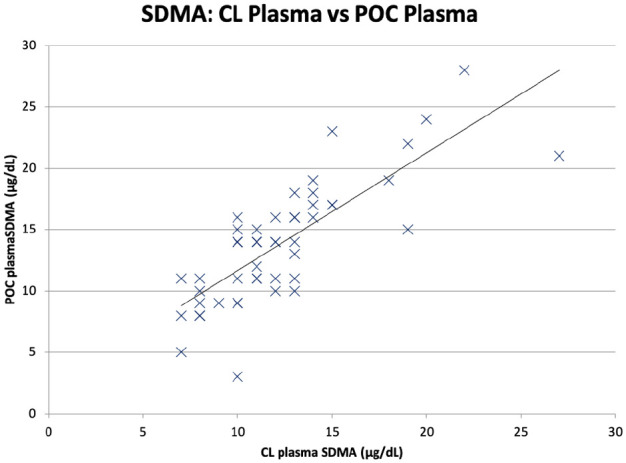
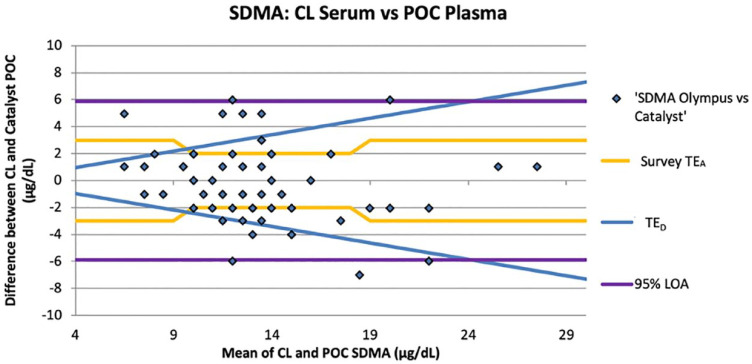
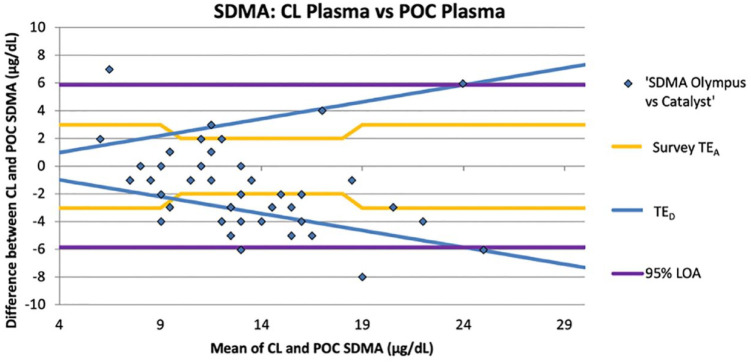
Methods: Two separate studies were performed that assessed: (1) imprecision, determined by evaluation of pooled feline plasma or serum; and (2) bias, assessed by comparing pooled plasma and serum results, as well as paired analyses of clinical samples from a single venepuncture measured using both analysers. Results were assessed in relation to performance goals. Dispersion and σ were calculated for both analysers.
Results: Bias between CL and POC analysers was consistent and high numbers of clinical results were outside performance goals across both studies. Imprecision was poor for both analysers for study 1 and improved to within quality goals for the CL analyser for study 2. Dispersion was at least 40%, meaning a measured result of 14 μg/dl represents a range of possible results from 8 μg/dl to 20 μg/dl.
Conclusions and relevance: Clinicians should be careful ascribing medical significance to small changes in SDMA concentration, as these may reflect analytical and biological variability. Analyser-specific reference intervals are likely required.
Keywords: Symmetric dimethylarginine; bias; dispersion; imprecision; method comparison; quality goal; sigma metrics; test interpretation.
Conflict of interest statement
The author(s) declared no potential conflicts of interest with respect to the research, authorship, and/or publication of this article.
Figures
Similar articles
-
Effect of storage temperature and time on measurement of serum symmetric dimethylarginine concentration using point-of-care and commercial laboratory analyzers in cats and dogs.J Vet Intern Med. 2023 Sep-Oct;37(5):1794-1805. doi: 10.1111/jvim.16811. Epub 2023 Aug 11. J Vet Intern Med. 2023. PMID: 37565515 Free PMC article.
-
Analytical quality performance goals for symmetric dimethylarginine in cats.Vet Clin Pathol. 2021 Mar;50(1):57-61. doi: 10.1111/vcp.12951. Epub 2021 Feb 1. Vet Clin Pathol. 2021. PMID: 33524207
-
Symmetric dimethylarginine and creatinine concentrations in serum of healthy draft horses.J Vet Intern Med. 2021 Mar;35(2):1147-1154. doi: 10.1111/jvim.16042. Epub 2021 Feb 5. J Vet Intern Med. 2021. PMID: 33543506 Free PMC article.
-
Symmetric Dimethylarginine: Improving the Diagnosis and Staging of Chronic Kidney Disease in Small Animals.Vet Clin North Am Small Anim Pract. 2016 Nov;46(6):941-60. doi: 10.1016/j.cvsm.2016.06.010. Epub 2016 Aug 5. Vet Clin North Am Small Anim Pract. 2016. PMID: 27499007 Review.
-
Symmetrical Dimethylarginine: Evaluating Chronic Kidney Disease in the Era of Multiple Kidney Biomarkers.Vet Clin North Am Small Anim Pract. 2022 May;52(3):609-629. doi: 10.1016/j.cvsm.2022.01.003. Epub 2022 Apr 1. Vet Clin North Am Small Anim Pract. 2022. PMID: 35379500 Review.
Cited by
-
Effect of storage temperature and time on measurement of serum symmetric dimethylarginine concentration using point-of-care and commercial laboratory analyzers in cats and dogs.J Vet Intern Med. 2023 Sep-Oct;37(5):1794-1805. doi: 10.1111/jvim.16811. Epub 2023 Aug 11. J Vet Intern Med. 2023. PMID: 37565515 Free PMC article.
-
Serum symmetric dimethylarginine in older dogs: Reference interval and comparison of a gold standard method with the ELISA.J Vet Intern Med. 2024 Mar-Apr;38(2):960-970. doi: 10.1111/jvim.16981. Epub 2024 Jan 19. J Vet Intern Med. 2024. PMID: 38240346 Free PMC article.
-
Impact of interlaboratory differences on the measurement of serum creatinine and symmetric dimethylarginine values: does this affect clinical decision-making?J Feline Med Surg. 2025 Apr;27(4):1098612X251320249. doi: 10.1177/1098612X251320249. Epub 2025 Apr 29. J Feline Med Surg. 2025. PMID: 40298305 Free PMC article.
-
Evaluation of symmetric dimethylarginine in cats with acute kidney injury and chronic kidney disease.J Vet Intern Med. 2022 Sep;36(5):1669-1676. doi: 10.1111/jvim.16497. Epub 2022 Jul 29. J Vet Intern Med. 2022. PMID: 35903963 Free PMC article.
-
Does intravenous contrast medium administration result in altered renal biomarkers? A study in clinically stable cats with and without azotemia.J Feline Med Surg. 2022 Jun;24(6):565-579. doi: 10.1177/1098612X211038535. Epub 2021 Sep 8. J Feline Med Surg. 2022. PMID: 34493101 Free PMC article.
References
-
- Kielstein JT, Salpeter SR, Bode-Boeger SM, et al.. Symmetric dimethylarginine (SDMA) as endogenous marker of renal function – a meta-analysis. Nephrol Dial Transplant 2006; 21: 2446–2451. - PubMed
-
- Baral RM. Assessment of renal disease in cats by SDMA, creatinine assessed by population reference interval and creatinine assessed by reference change value [abstract]. J Feline Med Surg 2016; 18: 935.
-
- Patch D, Obare E, Prusevich P, et al.. High throughput immunoassay for kidney function biomarker symmetric dimethylarginine (SDMA) [abstract]. Clin Chem 2015; 61: S135.
MeSH terms
Substances
LinkOut - more resources
Full Text Sources
Other Literature Sources
Miscellaneous
