. 2021 Feb 5:10:e64434.
doi: 10.7554/eLife.64434.

Dyshomeostatic modulation of Ca2+-activated K+ channels in a human neuronal model of KCNQ2 encephalopathy

Affiliations

Dyshomeostatic modulation of Ca2+-activated K+ channels in a human neuronal model of KCNQ2 encephalopathy

Dina Simkin et al. Elife. .

Abstract

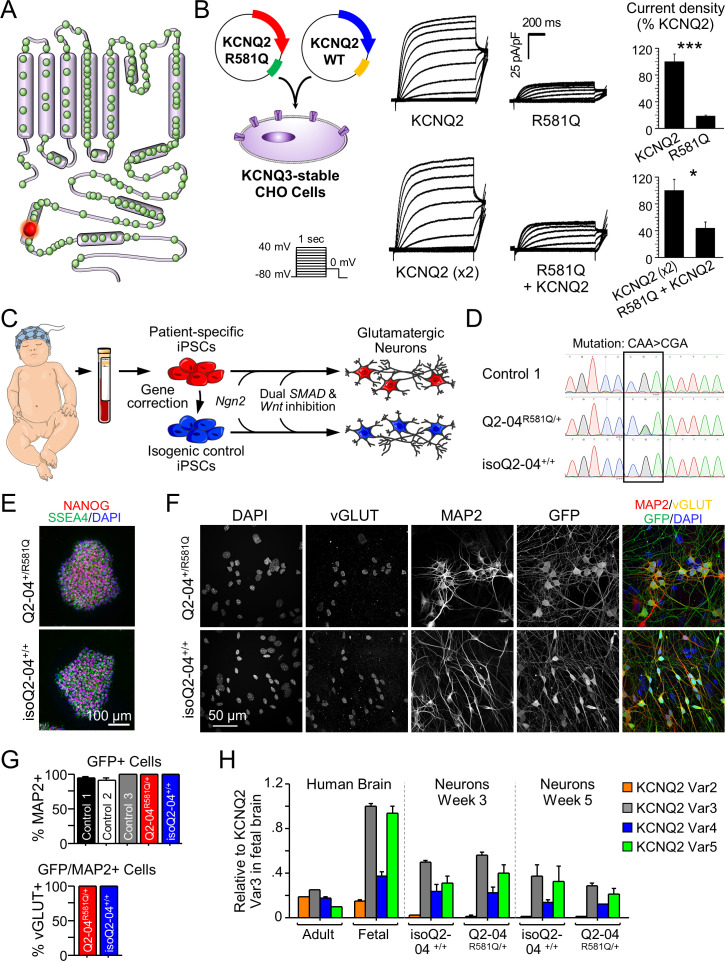
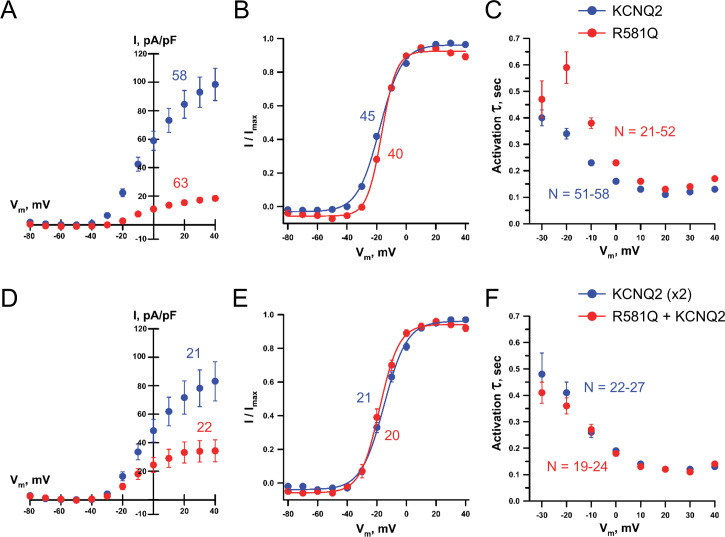
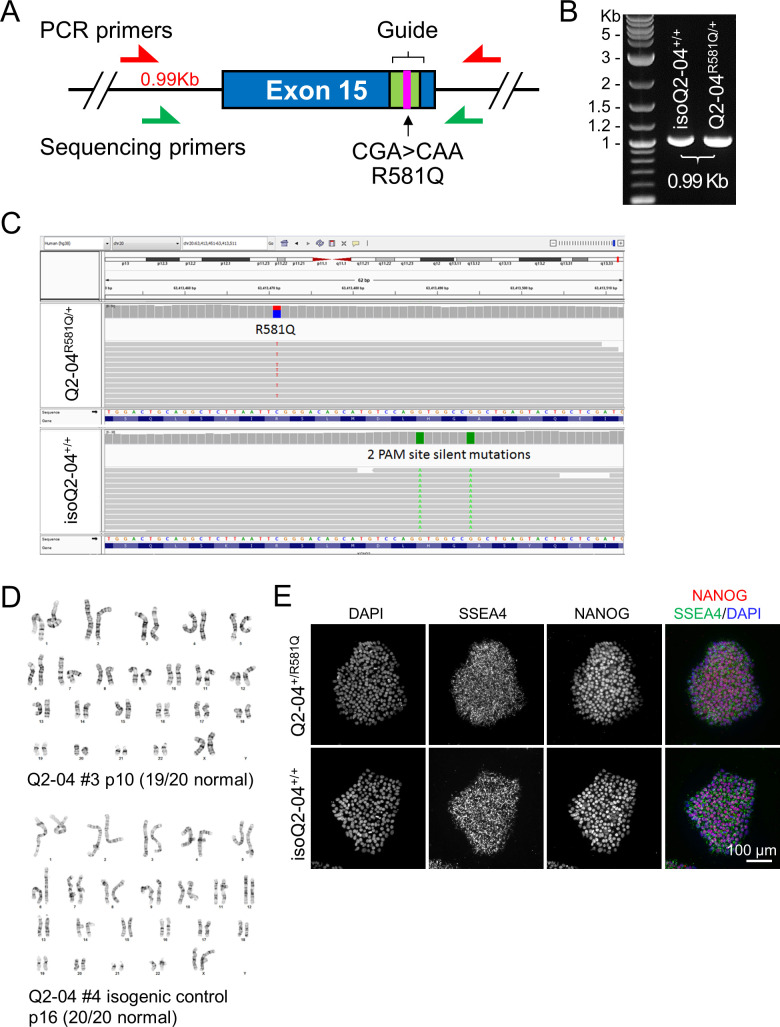
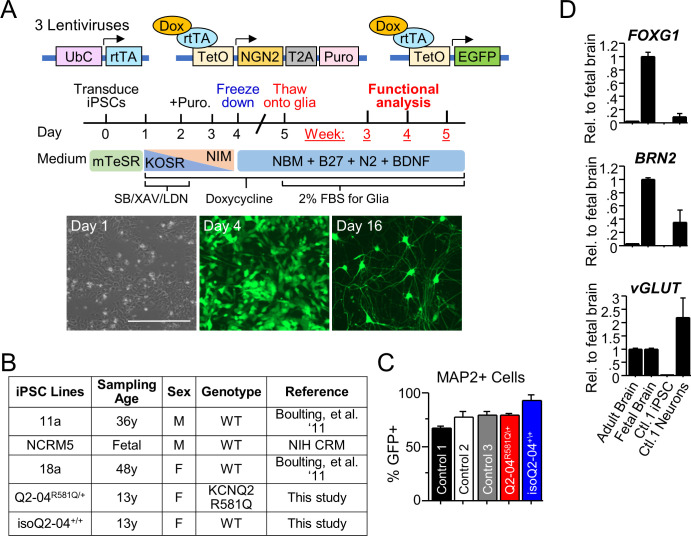
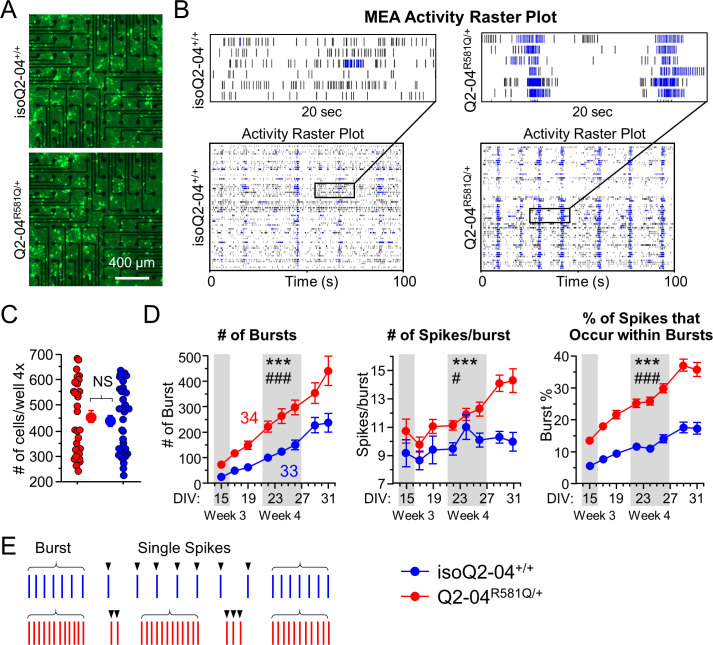
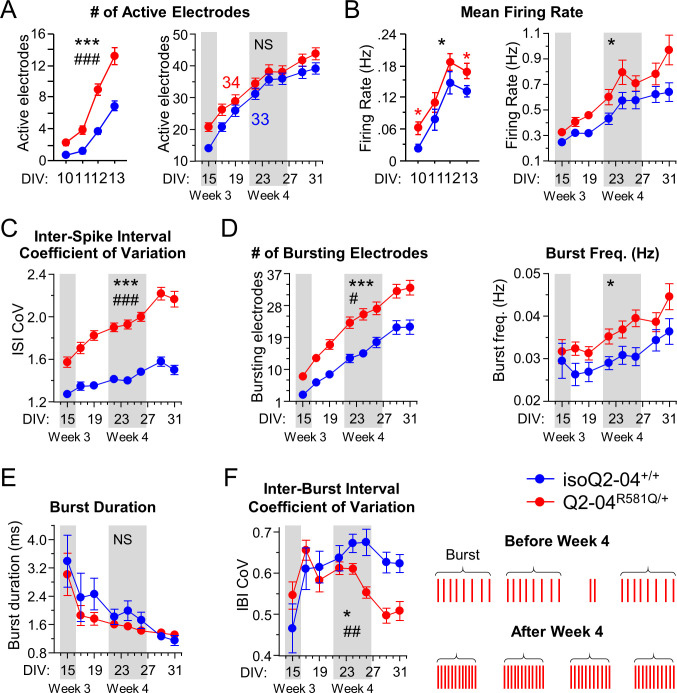
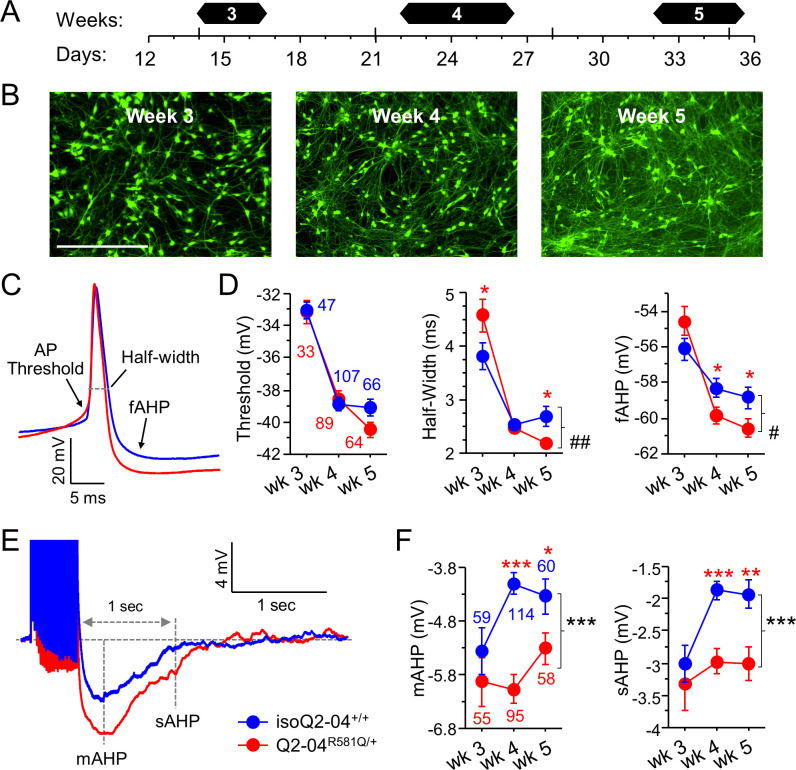
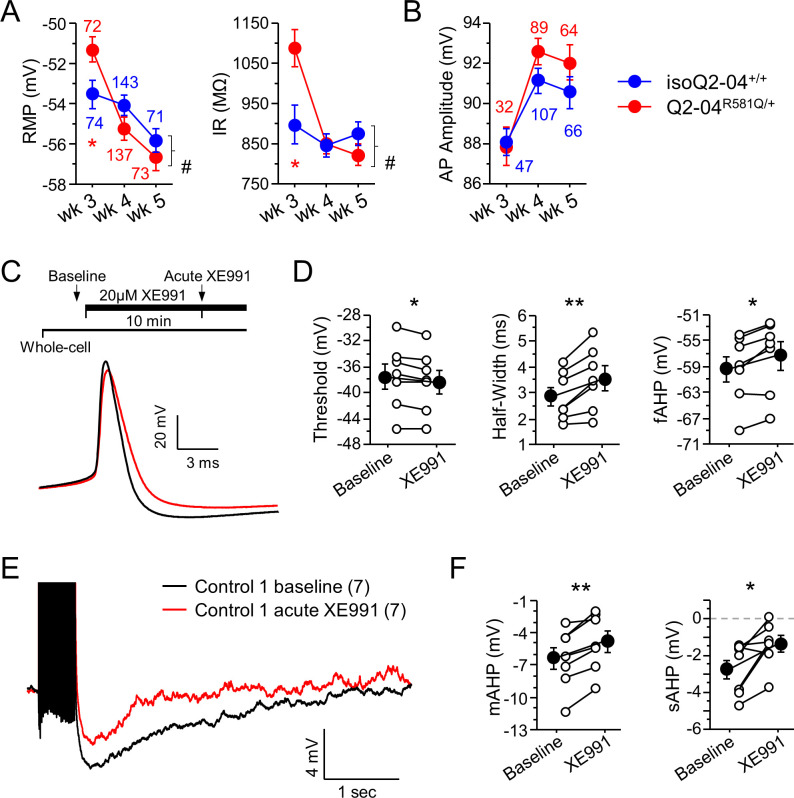
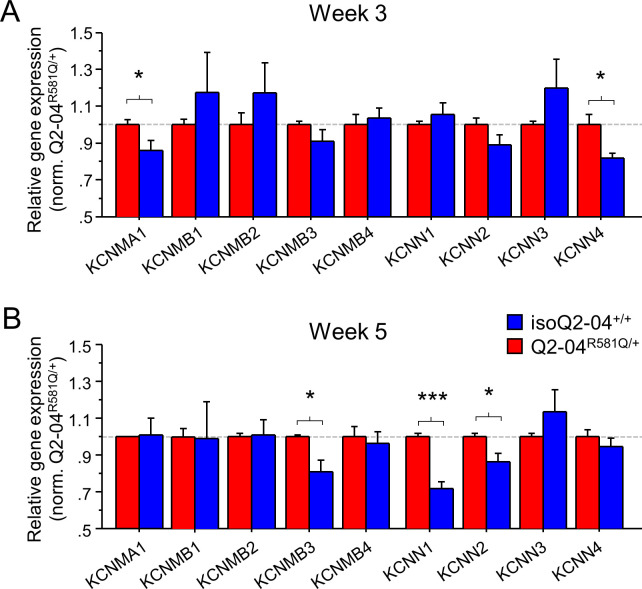
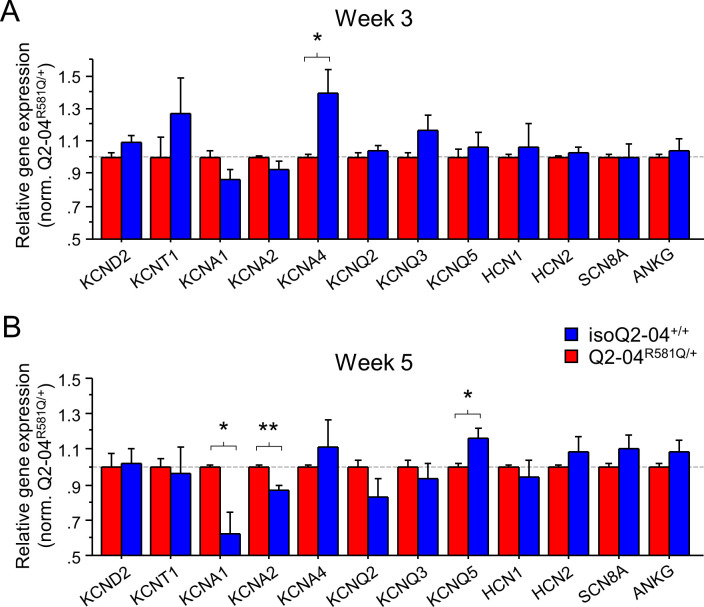
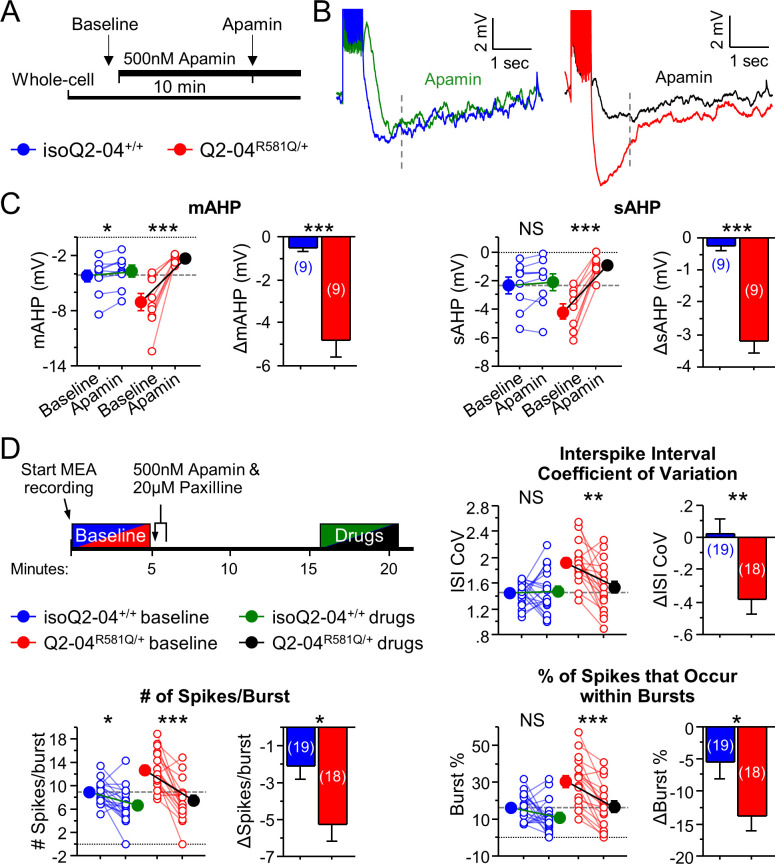
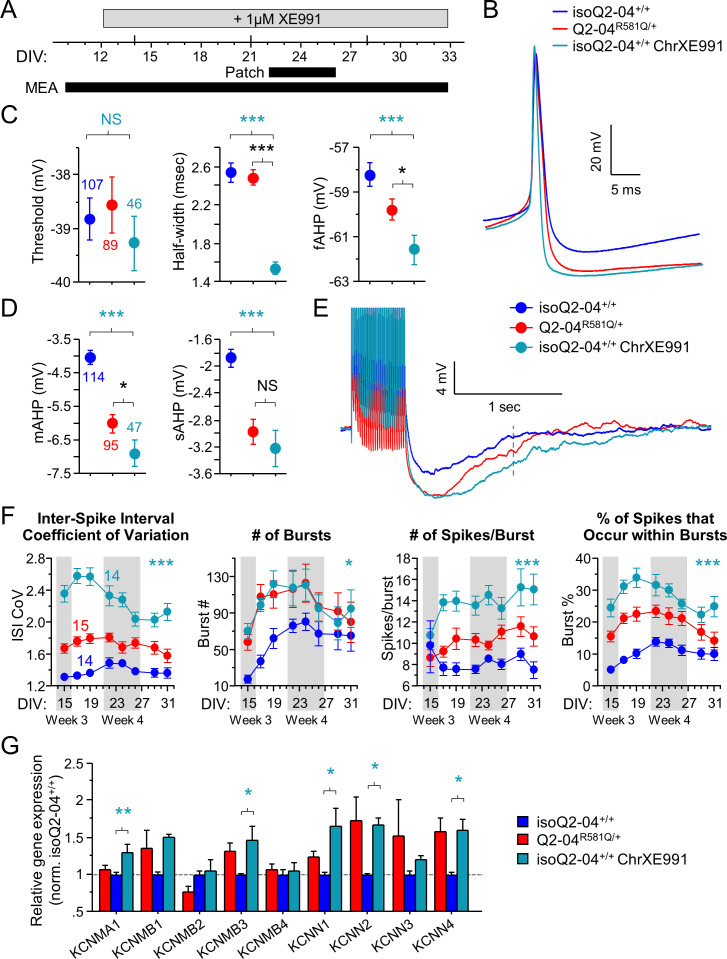
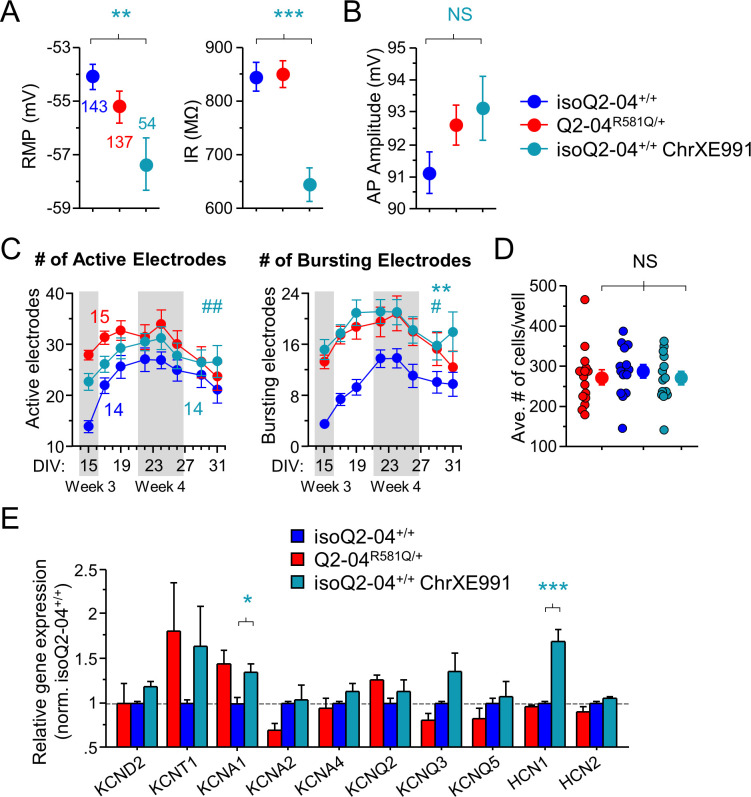
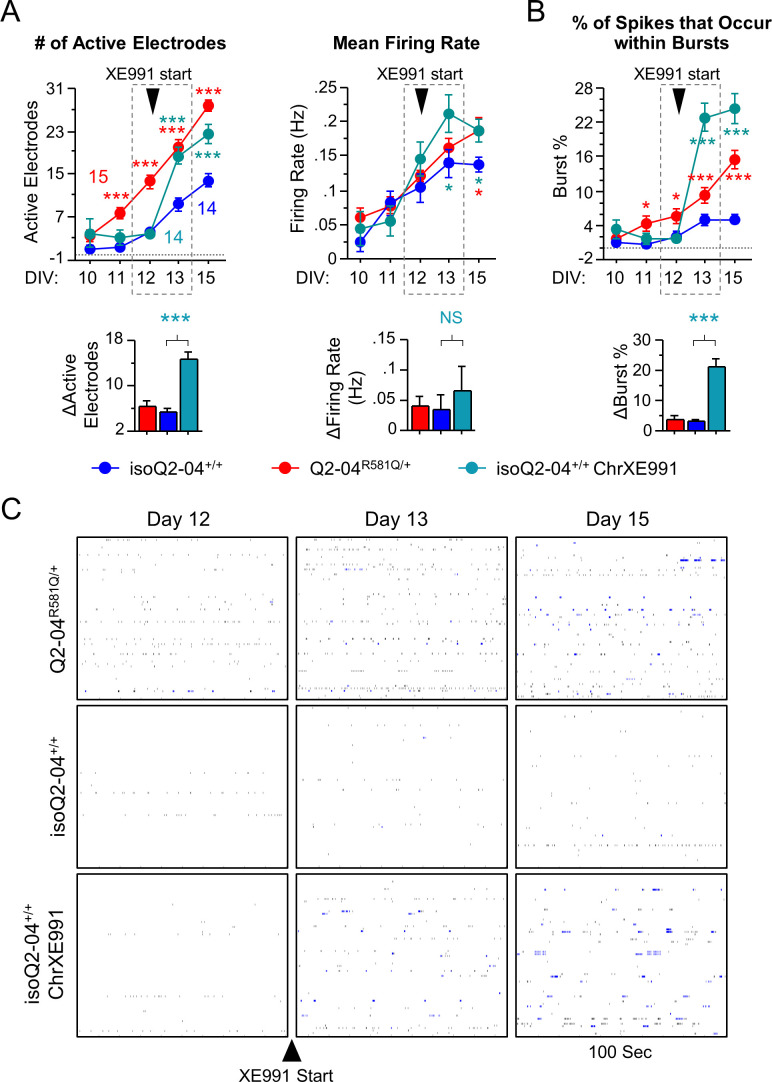
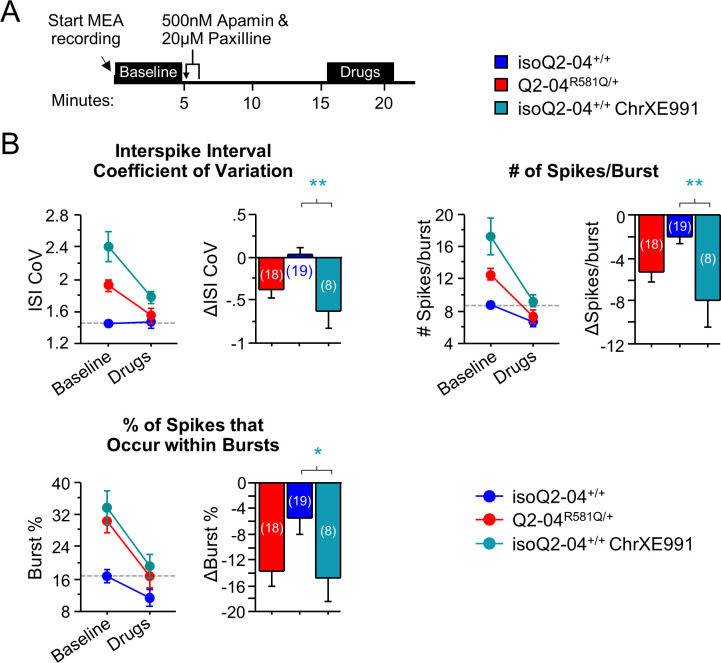
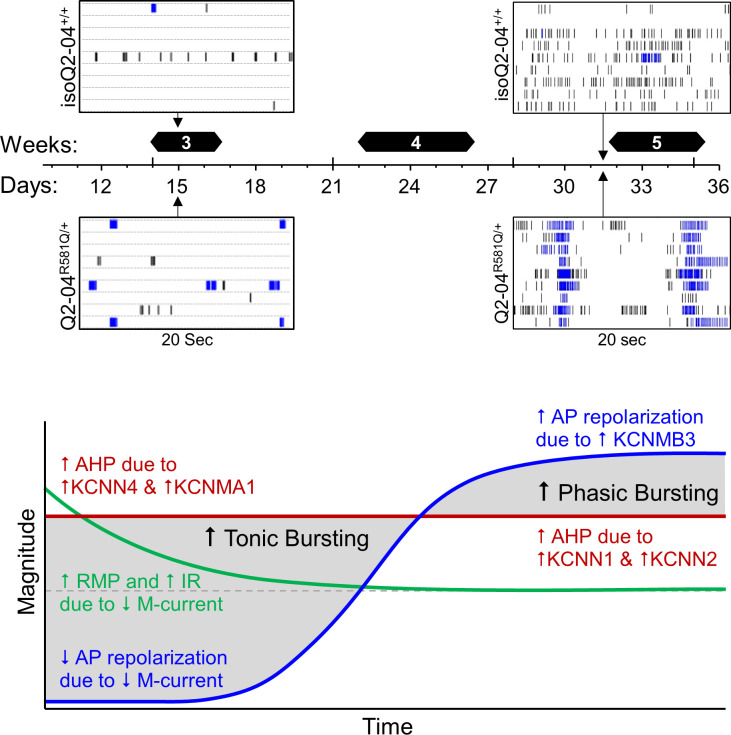
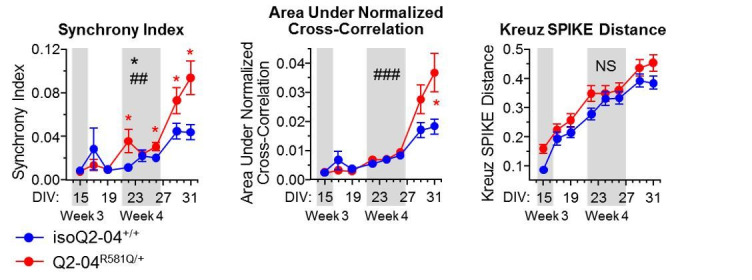
Mutations in KCNQ2, which encodes a pore-forming K+ channel subunit responsible for neuronal M-current, cause neonatal epileptic encephalopathy, a complex disorder presenting with severe early-onset seizures and impaired neurodevelopment. The condition is exceptionally difficult to treat, partially because the effects of KCNQ2 mutations on the development and function of human neurons are unknown. Here, we used induced pluripotent stem cells (iPSCs) and gene editing to establish a disease model and measured the functional properties of differentiated excitatory neurons. We find that patient iPSC-derived neurons exhibit faster action potential repolarization, larger post-burst afterhyperpolarization and a functional enhancement of Ca2+-activated K+ channels. These properties, which can be recapitulated by chronic inhibition of M-current in control neurons, facilitate a burst-suppression firing pattern that is reminiscent of the interictal electroencephalography pattern in patients. Our findings suggest that dyshomeostatic mechanisms compound KCNQ2 loss-of-function leading to alterations in the neurodevelopmental trajectory of patient iPSC-derived neurons.

Keywords: AHP; KCNQ2; M-current; burst-suppression; disease modeling; dyshomeostatic; epileptic encephalopathy; excitatory neurons; homeostatic plasticity; human; human iPSCs; neuroscience; potassium channel; regenerative medicine; stem cells.


Conflict of interest statement

DS, KM, CV, RD, BB, BP, JO, MF, GR, PP, LL, SL, JM, AG, EK No competing interests declared

Figures

Figure 1.
Figure 1.. Generation of KCNQ2-DEE patient-specific iPSC-derived neurons.
(A) Illustration of proposed structure of KCNQ2 channel subunit containing the mutation R581Q at the C-terminus (red) and other variants associated with KCNQ2-epileptic encephalopathy reported in ClinVar and (Goto et al., 2019) (green). (B) Heterologous expression of KCNQ2-R581Q. Left: transfection strategy and voltage pulse step protocol. Middle: Average XE-991-sensitive whole-cell currents normalized by membrane capacitance recorded using automated patch-clamp. KCNQ3-expressing CHO-K1 cells were transiently transfected with wild-type KCNQ2 (15 µg) or R581Q variant (15 µg) to recapitulate a homozygous state (top) or with R581Q (10 µg) plus wild-type KCNQ2 (10 µg) or wild-type KCNQ2 (x2; 20 µg) to mimic the heterozygous state (bottom). Right: Summary data (mean ± SEM) for average current density measured at +30 mV expressed as % of KCNQ2 WT values (KCNQ2: n = 58, R581Q: n = 63; KCNQ2 (x2): n = 21, R581Q + KCNQ2: n = 22). R581Q alone or combined with wild-type KCNQ2 produced 81.6 ± 10.7% (t test: ***p<0.0001) and 56.6 ± 14.9% (t test: *p=0.006) smaller current density, respectively, as compared to cells expressing wild-type channels. (C) Illustration of iPSC-derived cortical excitatory neuron platform. (D) DNA sequence electropherograms of KCNQ2 in control and patient iPSCs before and after gene editing, demonstrate the correction of the heterozygous (R581Q; c.1742G>A) mutation (See Figure 1—figure supplements 2 and 3 and Supplementary files 1–3). (E) Immunocytochemical labeling of KCNQ2-DEE patient-derived (Q2-04R581Q/+) and isogenic control (isoQ2-04+/+) iPSC lines with the pluripotency markers NANOG, SSEA4, and DAPI merged. Scale bar: 100 µm. (F) Immunocytochemical labeling with glutamatergic and neuronal markers vGLUT1 and MAP2 and GFP. Scale bar: 50 µm. (G) Quantification of GFP fluorescence coincident with MAP2 and vGLUT1 immuno-positive staining in three unrelated healthy controls and patient and isogenic control iPSC-derived neurons (See Figure 1—figure supplement 4). (H) RT-qPCR expression analysis of KCNQ2 splice variants in the differentiated neuronal cultures on weeks 3 and 5 using isoform-specific primers (See Supplementary file 4). All values are normalized to fetal brain KCNQ2 splice variant 3, as it is the highest expressing variant in all samples. Data from human adult and fetal brain are shown for comparison.
Figure 1—figure supplement 1.
Figure 1—figure supplement 1.. Whole-cell voltage-clamp analysis of KCNQ2 R581Q.
Whole-cell currents were recorded using automated patch clamp from KCNQ3-stably expressing CHO-K1 cells transiently transfected with either. (A–C) wild-type KCNQ2 or R581Q in the homozygous KCNQ2 configuration or (D–F) co-transfected with R581Q and wild type KCNQ2 (heterozygous KCNQ2 configuration). (A,D) Average XE-991-sensitive whole-cell current-voltage relationship, (B,E) voltage-dependence of activation V½ and (C,F) time-constant of activation (τ). In the homozygous configuration, compared to wild type KCNQ2, R581Q exhibited a 1.31 ± 0.4 mV shift (t test: p=0.049) in the voltage-dependence of activation V½ (B) and a slower activation time constant in the −20 to +20 mV range (t test: p-values<0.0001; C). In the heterozygous configuration, compared to wild type KCNQ2 (x2), R581Q + KCNQ2 exhibited a −3.45 ± 1.22 mV shift (t test: p=0.043) in the voltage-dependence of activation V½ (E) with no difference in the activation time constant (F). Number of cells analyzed is displayed within the figure. Values displayed are mean ± SEM.
Figure 1—figure supplement 2.
Figure 1—figure supplement 2.. Quality control studies of iPSC lines.
(A–B) Analysis of KCNQ2 targeted region after CRISPR/Cas9 gene correction. To validate the absence of large indels or mosaicism, a 0.99 Kb DNA fragment of genomic DNA around the targeted site was amplified and subjected to Sanger sequencing (Figure 1D). Products from both the parental and corrected iPSC lines exhibited one band of the expected size. (C) Karyotype analysis of patient and isogenic control iPSC lines. (E) Whole genome sequencing analysis of patient and isogenic control iPSCs. Integrated genomic viewer (IGV) showing 100 bp region around the patient mutation on exon 15 of KCNQ2 shows heterozygous R581Q mutation in the patient sample (top). Bottom: the mutation is corrected in the isogenic control sample. Also, two silent PAM site mutations were introduced in the isogenic control (in green). (G) Immunocytochemical labeling of Q2-04R581Q/+ and isogenic control (isoQ2-04+/+) iPSC lines with the pluripotency markers NANOG, SSEA4 and DAPI. Scale bar: 100 µm.
Figure 1—figure supplement 3.
Figure 1—figure supplement 3.. CRISPR off-target and whole genome sequencing analysis of iPSC lines.
(A) Analysis of potential CRISPR off-target sites. The top ten genomic regions of homology with the CRISPR/Cas9 targeted region (Supplementary file 1) were analyzed by a T7 endonuclease assay (Supplementary file 2). No mutations were identified. (B) Whole-genome distribution of variant mismatches between the sequenced samples shown in Circos plot. WGS analysis identified 3,343,903 single nucleotide variants (SNVs) and small indels with at least one alternative allele in either of the two samples. Genotype mismatches were found for 50,736 variants (outer track), corresponding to the 1.57% of the total number of comparable positions across common and rare variants based on gnomAD (Genome Aggregation Database Consortium et al., 2020) or 0.002% across the entire genome (assuming 3 billion nucleotides). After annotation and functional prediction, we found 400 potentially deleterious variants, with 4 (1 SNV and three indels in genes labeled in red) being homozygous reference for Q2-04R581Q/+ and heterozygous for isoQ2-04+/+ and the rest 396 (223 SNVs and 173 indels) were heterozygous for isoQ2-04+/+ and homozygous reference for Q2-04R581Q/+ (second track; Supplementary file 3). Genotype comparison with in-house unrelated whole-genome sequenced samples showed that the four above-mentioned variants are only observed in the isoQ2-04+/+ sample and the other 396 are only seen in the Q2-04R581Q/+ sample, indicating that the four are likely to be newly introduced variations in the isogenic line and the 396 are likely to be sequencing artifacts. Genes overlapping the depicted potentially deleterious variants are shown in red and predicted CRISPR off-target sites are shown as blue lines (the top 10 in dark blue and the rest 63 in light blue).
Figure 1—figure supplement 4.
Figure 1—figure supplement 4.. Quality control studies of iPSC-derived neurons.
(A) Top: Design of lentiviral vectors for Ngn2-mediated conversion of iPSCs to cortical excitatory neurons through tetracycline-inducible expression of exogenous proteins driven by a tetracycline-inducible promoter (TetO). Cells are transduced with (i) a virus expressing reverse tetracycline-controlled transactivator (M2rtTA) driven by the ubiquitin promoter, (ii) a virus expressing Ngn2 linked by T2A to a puromycin (puro) resistance gene driven by TetO, and (iii) EGFP driven by the TetO promoter. Middle: Protocol for generation of cortical excitatory neurons (See Materials and methods). Bottom: Representative images illustrating the time course of the conversion of iPSCs into neurons. Corresponding bright field and GFP fluorescence images on day 1 before addition of doxycycline, day 4 before cryopreservation, and day 16 after thawing onto a mouse glia monolayer (day 5). This protocol is modified from Zhang et al., 2013. Scale bar: 400 µm. (B) Table of iPSC lines used in this study. (C) Quantification of MAP2 immuno-positive staining with MAP2 antibody coincident with GFP fluorescence in iPSC-derived neurons. More than 65% of the MAP2-positive neurons were also positive for GFP in all iPSC lines as quantified by fluorescent microscopy (Figure 1C). (D) RNA expression analysis using quantitative RT-PCR of vGLUT2, FOXG1, and BRN2 that are characteristic of excitatory layer 2/3 cortical neurons in healthy control iPSC-derived neurons at week 4. Human adult and fetal brain were used for comparisons.
Figure 2.
Figure 2.. KCNQ2-DEE neurons exhibit enhanced spontaneous phasic bursting.
(A) Representative images at ×4 magnification of GFP-fluorescing KCNQ2-DEE and isogenic control neurons plated on MEA wells on day 24 in culture. Scale bar: 400 µm (B) Representative spike raster plots from a single MEA well of KCNQ2-DEE (Q2-04R581Q/+) and isogenic control (isoQ2-04+/+) neurons on day 31. Each row represents the signal detected by a single electrode; black ticks indicate single spikes and blue ticks spikes that occur within bursts. (C) Each MEA plate well was imaged on day 24 in culture using ×4 magnification. GFP-fluorescing neurons on the electrode field area were counted for each well of every plate. The average number of cells per well was not different between Q2-04R581Q/+ (459.2 ± 24.3 neurons/well) and isoQ2-04+/+ (438.8 ± 22.5 neurons/well) neurons (t test: p=0.5410, N = 34 and 33 wells, respectively). (D) Longitudinal analysis of MEA recordings from days 15 to 31 in culture. Compared to isogenic control neurons, Q2-04R581Q/+ neurons had increased average number of bursts detected on single electrodes (repeated measures ANOVA for genotype: F(1,455) = 17.31, ***p<0.0001; genotype/day interaction: F(7,455) = 3.88, ###p=0.0004); number of spikes within bursts (repeated measures ANOVA for genotype: F(1,455) = 17.31, ***p<0.0001; genotype/day interaction: F(7,455) = 2.24, #p=0.0301); and percentage of all detected spikes which were found to occur within bursts (repeated measures ANOVA for genotype: F(1,455) = 135.47, ***p<0.0001; genotype/day interaction: F(7,455) = 5.89, ###p<0.0001; See Figure 2—figure supplement 1). (E) Illustration of firing pattern showing increased phasic firing in bursts of Q2-04R581Q/+ neurons (red) as compared to isogenic control neurons (blue). Number of wells analyzed per cell line is displayed within the figure from three independent differentiations. Values displayed are mean ± SEM.
Figure 2—figure supplement 1.
Figure 2—figure supplement 1.. MEA quality control and bursting measurements.
(A) Left: Early MEA recordings from days 10 to 13. Q2-04R581Q/+ neurons exhibit a greater number of active electrodes compared to isoQ2-04+/+ early on (repeated measures ANOVA for genotype: F(1,195) = 47.02, ***p<0.0001; genotype/day interaction: F(3,195) = 11.32, ###p<0.0001). Right: MEA recordings from days 15 to 31 in culture. Longitudinal analysis of the number of active electrodes revealed no difference between patient-derived and isogenic control neurons at later time points (repeated measures ANOVA for genotype: F(1,455) = 2.97, p=0.0896; genotype/day interaction: F(7,455) = 1.87, p=0.0724). (B) Left: At early time points the mean firing frequency on active electrodes was higher in Q2-04R581Q/+ patient-derived neurons compared to isoQ2-04+/+ specifically on days 10 and 13 (repeated measures ANOVA: F(1,195) = 7.46, *p=0.0081; Fisher’s PLSD: red *p=0.0058, red *p=0.0384, respectively). Right: At later time points, the mean firing frequency was still higher in Q2-04R581Q/+ patient-derived neurons compared to isoQ2-04+/+ (repeated measures ANOVA for genotype: F(1,455) = 5.64, *p=0.0205; genotype/day interaction: F(7,455) = 1.89, p=0.0701). (C) The interspike interval coefficient of variation (ISI CoV) was significantly greater in patient-derived Q2-04R581Q/+ neurons (repeated measures ANOVA for genotype: F(1,455) = 181.52, ***p<0.0001; genotype/day interaction: F(7,455) = 4.97, ###p<0.0001). (D) The number of bursting electrodes was significantly greater in Q2-04R581Q/+ neurons (repeated measures ANOVA for genotype: F(1,455) = 28.05, ***p<0.0001; genotype/day interaction: F(7,455) = 2.93, #p=0.0052). The burst frequency on bursting electrodes was significantly higher in Q2-04R581Q/+ patient-derived neurons (repeated measures ANOVA for genotype: F(1,455) = 7.71, *p=0.0072). Although, the mean burst duration became significantly shorter over time in culture, it was not different between Q2-04R581Q/+ and isoQ2-04+/+ neurons (repeated measures ANOVA for genotype: F(1,455) = 1.28, p=0.2627). (E) The inter-burst interval coefficient of variation was significantly smaller in Q2-04R581Q/+ neurons (repeated measures ANOVA for genotype: F(1,455) = 6.02, *p=0.0169; genotype/day interaction: F(7,455) = 3.53, ##p=0.0011). Right: illustration of Q2-04R581Q/+ neuron burst firing phenotype over time in culture. Over time in culture, the Q2-04R581Q/+ neurons bursts became shorter with more spikes per burst and at more regular/phasic intervals (see Figure 2). NS: not significant. Number of neurons analyzed is displayed within the figure. Values displayed are mean ± SEM.
Figure 3.
Figure 3.. KCNQ2-DEE neurons exhibit progressive enhancement of AP repolarization and post-burst AHP.
(A) Experimental time line. (B) Representative images of GFP-fluorescing isogenic control neurons during weeks 3, 4, and 5. Scale bar: 400 µm. (C) Representative whole-cell current-clamp traces showing AP amplitude, threshold, half-width and fAHP at week 5. (D) Analysis of AP properties measured at weeks 3, 4, and 5. Q2-04R581Q/+ (red) neurons had no difference in AP threshold (two-way ANOVA for genotype: F (1,400)=0.82; p=0.37) but exhibited a progressive enhancement in AP repolarization over time with shorter AP half-widths (two-way ANOVA for genotype/weeks interaction: F(2,400) = 7.2; ##p=0.0008) and larger fAHPs (two-way ANOVA for genotype/weeks interaction: F(2,400) = 3.5; #p=0.022). Posthoc analysis using t-tests to compare each time point revealed longer half-widths on week 3 (*p=0.0383) but then shorter half-widths by week 5 (*p=0.0206) in Q2-04R581Q/+ neurons. fAHP was larger in Q2-04R581Q/+ neurons only at week 4 (*p=0.0298) and 5 (*p=0.0349), but was not significantly smaller at week 3 (p=0.0805). (E) Representative traces showing post-burst AHPs after 50 Hz train of 25 APs evoked by 2 ms/1.2 nA suprathreshold current stimuli. (F) Q2-04R581Q/+ neurons had enhanced mAHP (two-way ANOVA for genotype: F(1,435) = 19.99; ***p<0.0001; genotype/weeks interaction: F(2, 435)=2.94; p=0.054) and sAHP (two-way ANOVA for genotype: F(1,435) = 18.42; ***p<0.0001; genotype/weeks interaction: F(2, 435)=1.31; p=0.271). Posthoc analysis using t-tests to compare Q2-04R581Q/+ and isogenic control neurons at each time point revealed differences in mAHP and sAHP only at weeks 4 and 5, with no significant differences at week 3. Number of neurons analyzed is displayed within the figure and in Table 1 (Also see Figure 3—figure supplement 1). Red * indicate significance between Q2-04R581Q/+ and isoQ2-04+/+ neurons at each individual time point using posthoc t-tests. Values displayed are mean ± SEM.
Figure 3—figure supplement 1.
Figure 3—figure supplement 1.. Intrinsic excitability passive and active properties and effects of acute XE991 application.
(A) Passive membrane properties measured during weeks 3, 4, and 5. Time course of resting membrane potential (RMP) and input resistance (IR, measured at RMP) for iPSC-derived neurons in culture. As neurons matured over the 3-week period, the RMP became more hyperpolarized and IR became smaller. Two-way ANOVA revealed a significant genotype/weeks interaction for RMP (F(2,564) = 4.34, #p=0.014) and IR (F(2,564) = 5.29, #p=0.0053). However, posthoc analysis using t-tests to compare Q2-04R581Q/+ and isogenic control neurons at each time point revealed differences in these properties only on week 3 (RMP t test: *p=0.0163; IR t test: *p=0.0075). Red * indicate significance between Q2-04R581Q/+ and isoQ2-04+/+ neurons at each individual time point using posthoc t tests. (B) Action potential amplitudes increased over time in culture. There were no differences between cell lines. Number of neurons analyzed is displayed within the figure and in Table 1. (C) Top: Experimental protocol. Baseline measures were made after establishing the whole-cell configuration in current-clamp mode. After exactly 10 min of continuous perfusion of 20 µM XE991 in aCSF, the AP properties and post-burst AHP were remeasured. Bottom: Representative whole-cell current-clamp traces showing AP amplitude, threshold, half-width and fAHP before and after acute XE991 application in unrelated healthy control neurons. (D) Addition of M-current blocker XE991 significantly reduced the AP threshold, increased the AP half-width and reduced the fAHP (repeated measures ANOVA: AP threshold p=0.0104; HW p=0.0046; fAHP p=0.009) in control one neurons. (E) Representative whole-cell current-clamp traces showing post-burst AHP before and after XE991 application in control neurons. (F) Addition of XE991 reduced the post-burst AHP in control neurons (repeated measures ANOVA: mAHP p=0.0014; sAHP p=0.022). Number of neurons analyzed is displayed in the figure. Values displayed are mean ± SEM.
Figure 4.
Figure 4.. Enhanced expression of Ca2+-activated K+ channel genes in KCNQ2-DEE neurons.
(A) qPCR gene expression pattern of K+ channels and major β subunits involved in AP repolarization and post-burst AHP on week 3. KCNMA1 and KCNN4 expression was significantly higher in Q2-04R581Q/+ neurons (t-test: *p=0.0429 and *p=0.016, respectively). (B) At week 5, expression of KCNMB3, KCNN1 and KCNN2 was significantly higher in Q2-04R581Q/+ neurons (t test: *p=0.0081, ***p<0.0001 and *p=0.018, respectively). Values displayed are mean ± SEM from three independent differentiations normalized within each differentiation to Q2-04R581Q/+ of each time-point.
Figure 4—figure supplement 1.
Figure 4—figure supplement 1.. Expression of ion channel genes in KCNQ2-DEE neurons.
(A) qPCR gene expression pattern of ion channels at week 3. KCNA4 expression was significantly higher in Q2-04R581Q/+ neurons (t test: *p=0.0216). (B) At week 5, expression of KCNA1 and KCNA2 was significantly higher in Q2-04R581Q/+ neurons (t test: *p=0.0099, **p=0.0017, respectively). Expression of KCNQ5 was significantly lower in Q2-04R581Q/+ neurons (t test: *p=0.0198). Values displayed are mean ± SEM from three independent differentiations normalized within each differentiation to Q2-04R581Q/+ of each time-point.
Figure 5.
Figure 5.. KCNQ2-DEE neurons exhibit a dyshomeostatic increase in SK and BK channel function.
(A) Experimental protocol. Baseline measures were made after establishing the whole-cell configuration in current-clamp mode. After exactly 10 min of continuous perfusion of 500 nM apamin in aCSF, the AP properties and post-burst AHP were measured. (B) Representative traces showing post-burst AHPs before and after apamin application. (C) Acute application of apamin significantly reduced mAHP (***p=0.0004) and sAHP (***p<0.0001) in Q2-04R581Q/+ neurons and reduced mAHP in isogenic control neurons (mAHP: *p=0.0114) but not sAHP (sAHP p=0.132). However, the magnitude by which apamin reduced both mAHP and sAHP was significantly larger in Q2-04R581Q/+ neurons (t-test: ***p=0.0001, ***p<0.0001, respectively). (D) Right: Experimental protocol. Apamin (500 nM) and paxilline (20 µM) were added to MEAs after 5 min of baseline spontaneous recordings. The effect of drugs was measured after 10 min of continuous recording for 5 min. These K+ channel inhibitors reduced ISI CoV (**p=0.0015), spikes/burst (***p<0.0001) and % of all spikes that occur in bursts (***p<0.0001) in Q2-04R581Q/+ neurons. The number of spikes per burst were reduced in isoQ2-04+/+ neurons (*p=0.0051) but ISI CoV and burst % were not changed (p=0.796, p=0.0687, respectively). The magnitude by which apamin and paxilline reduced ISI CoV, spikes/burst and burst % was significantly larger in Q2-04R581Q/+ neurons (t-test: **p=0.0048, *p=0.0087 and *p=0.0254, respectively). Repeated measures ANOVA was used to compare drug effects and posthoc t-tests were used where the interaction of before/after drug and genotype was significant. A dotted line is drawn through the mean baseline values measured for isoQ2-04+/+ neurons before acute application of apamin and paxilline. Number of neurons analyzed is displayed within the figure; values displayed are mean ± SEM.
Figure 6.
Figure 6.. Chronic inhibition of M-current in control neurons phenocopies KCNQ2-DEE.
(A) Experimental time line. (B) Representative AP traces from Q2-04R581Q/+, untreated isoQ2-04+/+ and isoQ2-04+/+ neurons chronically treated with 1 µM XE991 (isoQ2-04+/+ChrXE991). (C) Chronic XE991 treatment did not change the AP threshold but AP half-width and fAHP of isoQ2-04+/+ChrXE991 were significantly different from untreated isogenic control neurons (ANOVA, Fisher’s PLSD posthoc test for AP half-width: ***p<0.0001; fAHP: ***p=0.0001), and also from Q2-04R581Q/+ patient-derived neurons (ANOVA, Fisher’s PLSD posthoc test for AP half-width: p<0.0001; fAHP: *p=0.047). (D) The post-burst AHP is enhanced after chronic XE991 treatment in isoQ2-04+/+ neurons (ANOVA, Fisher’s PLSD posthoc test for mAHP: ***p<0.0001; sAHP: ***p<0.0001), to levels slightly larger or similar to Q2-04R581Q/+ patient-derived neurons (mAHP: *p=0.038; sAHP: p=0.405). (E) Representative traces showing post-burst AHPs of Q2-04R581Q/+, untreated isoQ2-04+/+ and chronically XE991-treated isoQ2-04+/+ neurons. Number of neurons analyzed is displayed within the figure and in Tables 1 and 2 (also see Figure 6—figure supplement 1). NS: not significant. (F) MEA recordings from days 15 to 31 in culture recorded from Q2-04R581Q/+, untreated isoQ2-04+/+ and chronically XE991-treated isoQ2-04+/+ neurons. Chronic XE991 treatment increased the ISI CoV, number of bursts, number of spikes/burst and burst % in chronically XE991-treated isoQ2-04+/+ neurons compared to untreated isoQ2-04+/+ (repeated measures ANOVA, Fisher’s PLSD posthoc test: ***p<0.0001; *p=0.0275; ***p<0.0001; ***p<0.0001, respectively). Teal * indicate difference between chronically XE991-treated isoQ2-04+/+ and untreated isoQ2-04+/+ neurons. IsoQ2-04+/+ chrXE991 neurons exhibited a similar or significantly greater bursting phenotype compared to untreated Q2-04R581Q/+ neurons (repeated measures ANOVA, Fisher’s PLSD posthoc test for ISI CoV: ***p<0.0001; number of bursts: p=0.9208; number of spikes/burst: ***p<0.0001; burst %: **p=0.0005). Fourteen to 15 wells were analyzed per group from two independent differentiations (see Figure 6—figure supplements 1 and 2). Repeated measures ANOVA was used to compare the three groups of neurons over the time course and Fisher’s PLSD posthoc test was used only where there was significance between the groups. (G) Comparison of qPCR gene expression pattern of K+ channels and major β subunits involved in AP repolarization and post-burst AHP among Q2-04R581Q/+, untreated isoQ2-04+/+ and chronically XE991-treated isoQ2-04+/+ neurons at week 5. Expression of KCNMA1, KCNMB3, KCNN1, KCNN2 and KCNN4 was significantly higher in chronically XE991-treated isoQ2-04+/+ neurons compared to untreated isoQ2-04+/+ (ANOVA, Fisher’s PLSD posthoc test: **p=0.0038, *p=0.0148, *p=0.0179, *p=0.0307 and *p=0.0175, respectively). Values displayed are from two independent differentiations normalized within each differentiation to isoQ2-04+/+. Teal * and # indicate significance between chronically XE991-treated and untreated isoQ2-04+/+ neurons. Values displayed are mean ± SEM.
Figure 6—figure supplement 1.
Figure 6—figure supplement 1.. Intrinsic membrane properties and MEA recordings in chronically XE991-treated control neurons.
(A) Passive membrane properties. RMP was more hyperpolarized and input resistance was significantly reduced with chronic XE991 treatment (isoQ2-04+/+ ChrXE991) in isogenic control neurons as compared to untreated isoQ2-04+/+ and Q2-04R581Q/+ neurons (ANOVA, Fisher’s PLSD posthoc test for RMP: **p=0.0014, *p=0.0383; Input resistance: ***p<0.0001, ***p<0.0001, respectively). Number of neurons analyzed is displayed within the figure and in Tables 1 and 2. (B) Action potential amplitudes were not different between cell lines and after chronic treatment with XE991 (See Figure 6C). (C) Longitudinal analysis of MEA recordings from days 15 to 31 in culture recorded from Q2-04R581Q/+, untreated isoQ2-04+/+ and chronically XE991-treated isoQ2-04+/+ neurons. There was no difference in the number of active electrodes between the three groups of neurons (repeated measures ANOVA for genotype group: F(2,280) = 3.22, p=0.0504; genotype groups/day interaction: F(7,280) = 2.61, ##p=0.0015). The number of bursting electrodes was significantly greater in chronically XE991-treated isoQ2-04+/+ neurons as compared to untreated isoQ2-04+/+ neurons (repeated measures ANOVA: F(2,280) = 7.15, **p=0.0011; Fisher’s PLSD: **p=0.0005) but no different from Q2-04R581Q/+ neurons (repeated measures ANOVA, Fisher’s PLSD: p=0.4806). Fourteen to 15 wells, displayed within the figure, were analyzed per genotype treatment group from two independent differentiations. Teal * or # indicate difference between chronically XE991-treated isoQ2-04+/+ and untreated isoQ2-04+/+ neurons. (D) Each MEA plate well was imaged during week 4 in culture. GFP-fluorescing neurons on the electrode field area were counted for each well of every plate. The average number of cells per well counted was not different between Q2-04R581Q/+ neurons (271.8 ± 18.5 neurons/well), isoQ2-04+/+ neurons (287.3 ± 17.2 neurons/well) and chronically XE991-treated isoQ2-04+/+ neurons (271.3 ± 16.1 neurons/well) (p=0.7645). NS: not significant. (E) Comparison of qPCR gene expression pattern of K+ channels between Q2-04R581Q/+, untreated isoQ2-04+/+ and chronically XE991-treated isoQ2-04+/+ at week 5. The was no difference in expression of KCND2, KCNT1, KCNA2, KCNA4, KCNQ2, KCNQ3, KCNQ5 or HCN2 between the three groups of neurons. KCNA1 and HCN1 were upregulated in chronically XE991-treated isoQ2-04+/+ neurons compared to untreated isoQ2-04+/+ neurons (t test: *p=0.0443, ***p=0.0002, respectively). Values displayed are from two independent differentiations normalized within each differentiation to Q2-04+/+. Values displayed are mean ± SEM.
Figure 6—figure supplement 2.
Figure 6—figure supplement 2.. Early effects of chronic XE991 treatment on control neurons.
(A) Early MEA recordings from days 10 to 15 in culture. Q2-04R581Q/+ neurons exhibit a greater number of electrodes that became active (≥1 spike/min) earlier on in differentiation compared to isoQ2-04+/+, indicating more neurons could fire spontaneously earlier (Also see Figure 2—figure supplement 1A). Within 24 hr of XE991 treatment, isoQ2-04+/+ neurons (isoQ2-04+/+ ChrXE991) exhibited a threefold increase in the number of active electrodes relative to untreated isoQ2-04+/+ neurons (ΔActive Electrodes, t test: p<0.0001). Although there was a significant genotype group difference in the mean firing rate (repeated measures ANOVA for genotype group: F(2,160) = 3.73, p=0.0327), there was no differences between the groups on individual days 10–12 (Fisher’s PLSD posthoc test). Also, the mean firing rate increased, from day 12 to day 13, equally between the groups (ΔFiring Rate, t test: p=0.7136). (B) The percentage of spikes that occur in bursts (burst %) was higher in Q2-04R581Q/+ neurons compared to isoQ2-04+/+ beginning on day 11. After application of XE991, isoQ2-04+/+ neurons exhibited a sevenfold increase in burst % relative to untreated isoQ2-04+/+ neurons (ΔBurst %, t test: p<0.0001). Red * indicate significant difference between Q2-04R581Q/+ and untreated isoQ2-04+/+ neurons and teal * indicate significant difference between chronically XE991-treated isoQ2-04+/+ and untreated isoQ2-04+/+ neurons at each time point. (C) Representative spike raster plots from 100 s of a single MEA well of Q2-04R581Q/+, isoQ2-04+/+ and isoQ2-04+/+chronic XE991 neurons before (Day 12) and after (Day 13–15) XE991 treatment. Each row represents the signal detected by a single electrode; black ticks indicate single spikes and blue ticks spikes that occur within bursts. Values displayed are mean ± SEM.
Figure 6—figure supplement 3.
Figure 6—figure supplement 3.. Effects of acute paxilline/apamin treatment on chronically XE991-treated control neurons.
(A) Experimental protocol. On day 32, apamin (500 nM) and paxilline (20 µM) were added to MEAs after 5 min of baseline spontaneous recordings. The effect of drugs was measured after 10 min of continuous recording for 5 min. (B) The magnitude by which apamin and paxilline reduced ISI CoV, spikes/burst and burst % was significantly larger in chronically XE991-treated isoQ2-04+/+ neurons compared to untreated isoQ2-04+/+ neurons (t-test: **p=0.0019, **p=0.0011 and *p=0.0482, respectively). A dotted line is drawn through the mean baseline values measured for isoQ2-04+/+ neurons before acute application of apamin and paxilline. Teal * indicate significant difference between chronically XE991-treated isoQ2-04+/+ and untreated isoQ2-04+/+ neurons. Values displayed are mean ± SEM.
Figure 6—figure supplement 4.
Figure 6—figure supplement 4.. Diagram of proposed temporal homeostatic consequences of loss of M-current.
Developmental time course of differences in Q2-04R581Q/+ patient-specific iPSC-derived neurons as compared to mutation corrected isogenic controls isoQ2-04+/+. Top: Days 15 and 31 MEA raster plots showing 20 s on nine electrodes. Q2-04R581Q/+ have higher number of active neurons and can burst fire earlier. Over time in culture tonic bursting becomes more phasic. Bottom: Time course of intrinsic neuronal changes suggested by our study to participate in the burst firing phenotype of Q2-04R581Q/+ neurons.
Author response image 1.
Author response image 1.. Synchrony metrics assessed by MEA experiments.

Similar articles

Cited by

References

    1. 1000 Genomes Project Analysis Group. Danecek P, Auton A, Abecasis G, Albers CA, Banks E, DePristo MA, Handsaker RE, Lunter G, Marth GT, Sherry ST, McVean G, Durbin R. The variant call format and VCFtools. Bioinformatics. 2011;27:2156–2158. doi: 10.1093/bioinformatics/btr330. - DOI - PMC - PubMed
    1. Afawi Z, Oliver KL, Kivity S, Mazarib A, Blatt I, Neufeld MY, Helbig KL, Goldberg-Stern H, Misk AJ, Straussberg R, Walid S, Mahajnah M, Lerman-Sagie T, Ben-Zeev B, Kahana E, Masalha R, Kramer U, Ekstein D, Shorer Z, Wallace RH, Mangelsdorf M, MacPherson JN, Carvill GL, Mefford HC, Jackson GD, Scheffer IE, Bahlo M, Gecz J, Heron SE, Corbett M, Mulley JC, Dibbens LM, Korczyn AD, Berkovic SF. Multiplex families with epilepsy: success of clinical and molecular genetic characterization. Neurology. 2016;86:713–722. doi: 10.1212/WNL.0000000000002404. - DOI - PMC - PubMed
    1. Auvin S, Cilio MR, Vezzani A. Current understanding and neurobiology of epileptic encephalopathies. Neurobiology of Disease. 2016;92:72–89. doi: 10.1016/j.nbd.2016.03.007. - DOI - PubMed
    1. Bardy C, van den Hurk M, Kakaradov B, Erwin JA, Jaeger BN, Hernandez RV, Eames T, Paucar AA, Gorris M, Marchand C, Jappelli R, Barron J, Bryant AK, Kellogg M, Lasken RS, Rutten BP, Steinbusch HW, Yeo GW, Gage FH. Predicting the functional states of human iPSC-derived neurons with single-cell RNA-seq and electrophysiology. Molecular Psychiatry. 2016;21:1573–1588. doi: 10.1038/mp.2016.158. - DOI - PMC - PubMed
    1. Battefeld A, Tran BT, Gavrilis J, Cooper EC, Kole MH. Heteromeric Kv7.2/7.3 channels differentially regulate action potential initiation and conduction in neocortical myelinated axons. Journal of Neuroscience. 2014;34:3719–3732. doi: 10.1523/JNEUROSCI.4206-13.2014. - DOI - PMC - PubMed

Publication types

Substances