. 2021 Feb 5:10:e59067.
doi: 10.7554/eLife.59067.

Pancreatic progenitor epigenome maps prioritize type 2 diabetes risk genes with roles in development

Affiliations

Pancreatic progenitor epigenome maps prioritize type 2 diabetes risk genes with roles in development

Ryan J Geusz et al. Elife. .

Abstract

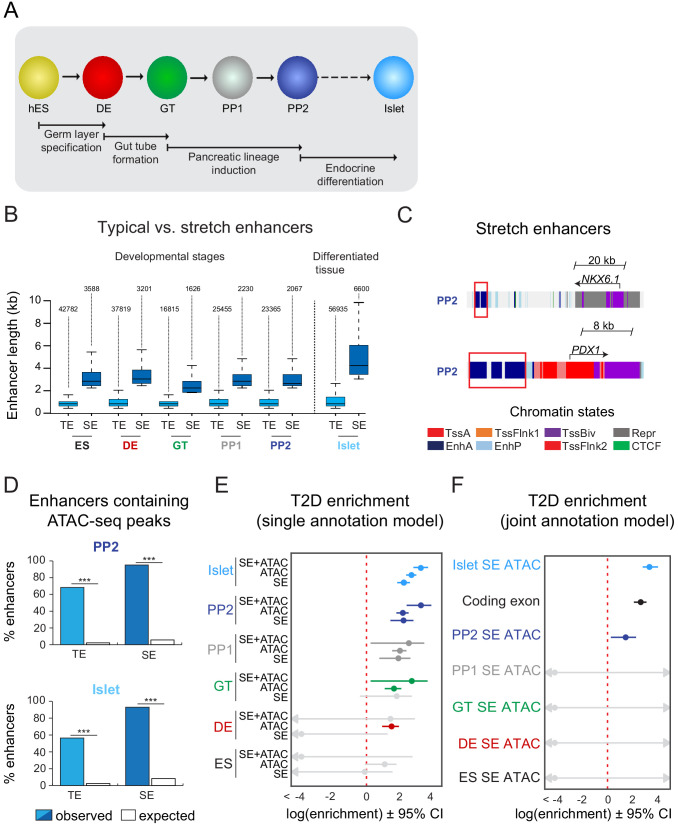
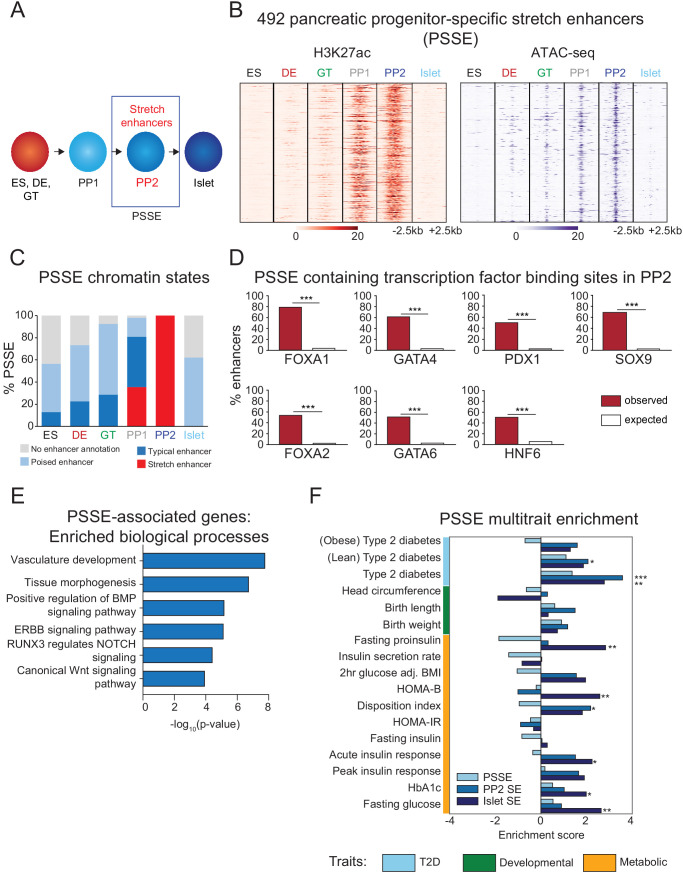
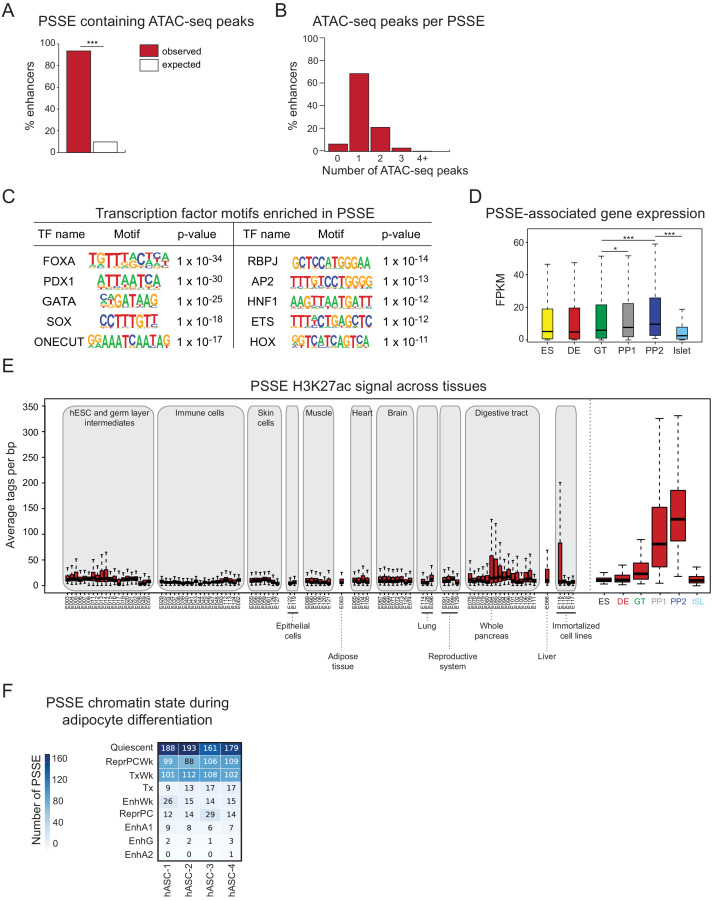
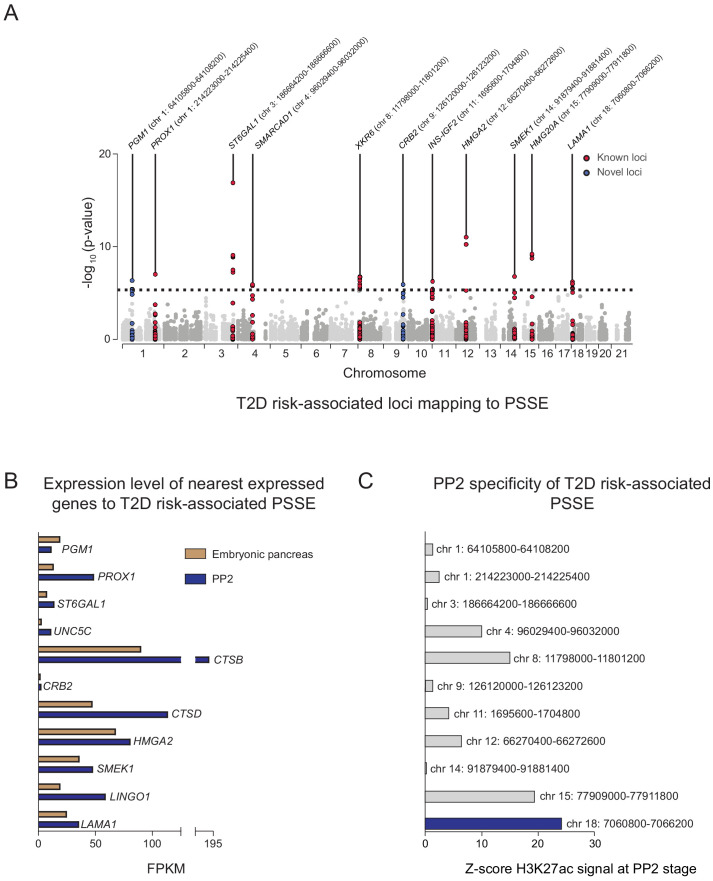
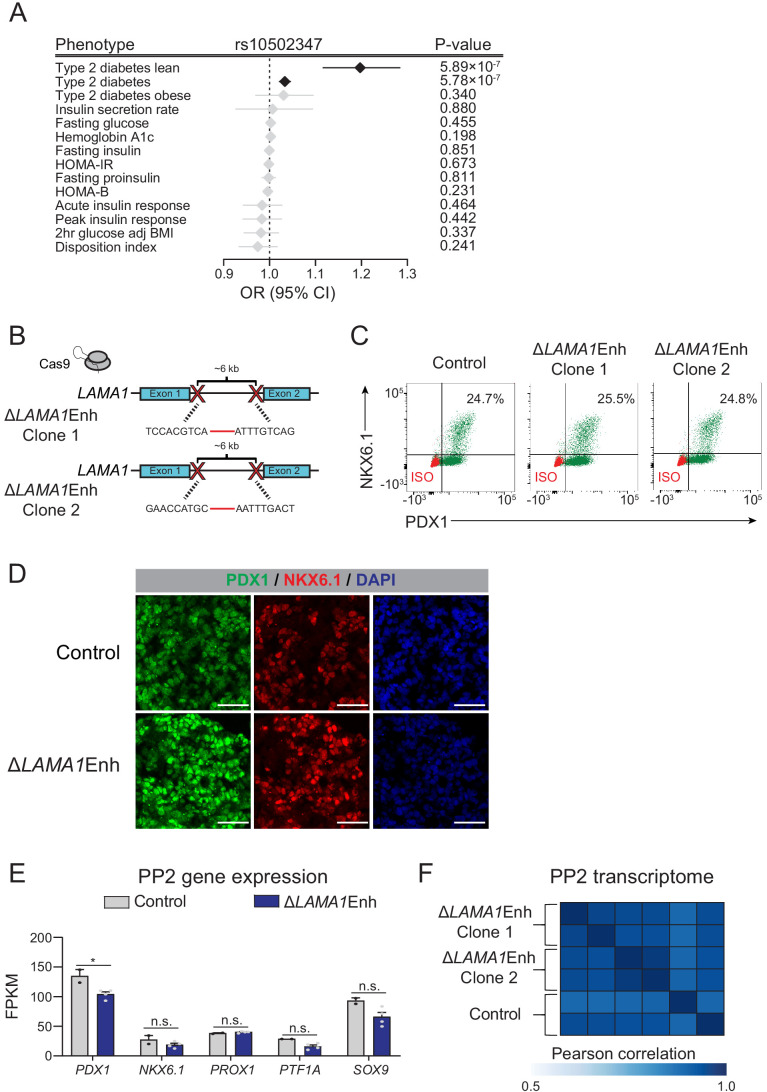
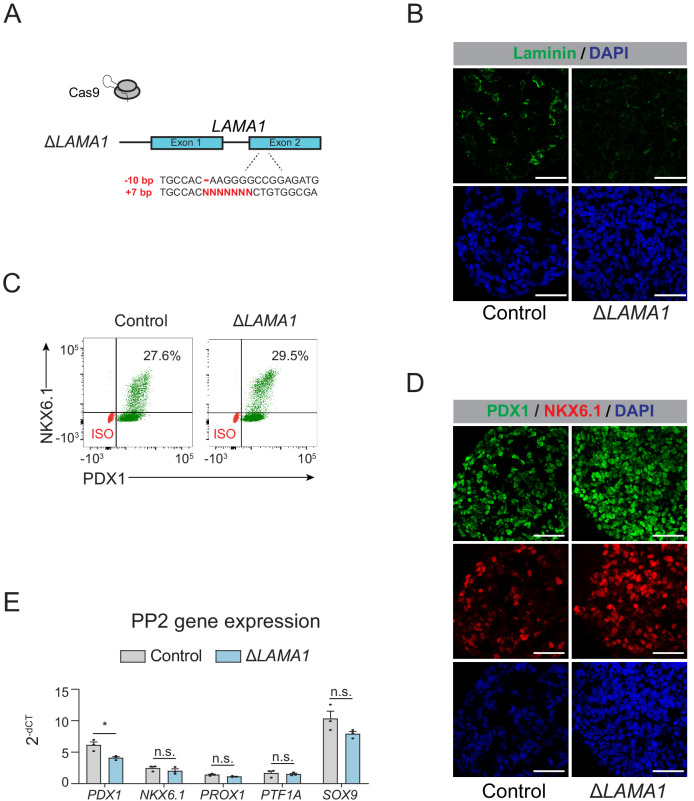
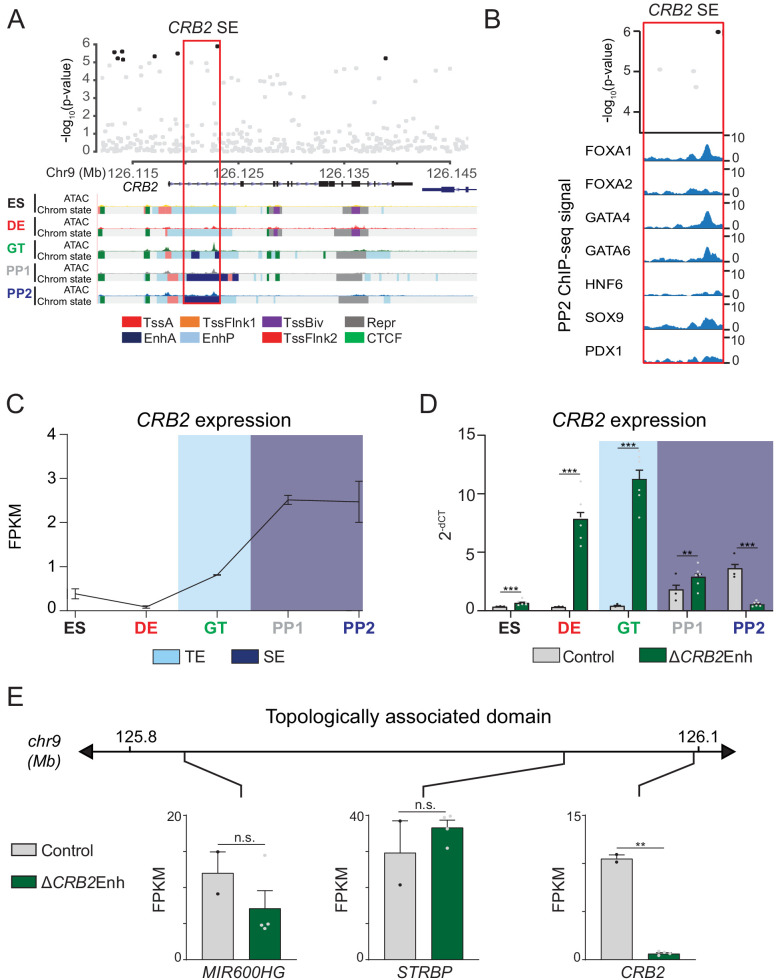
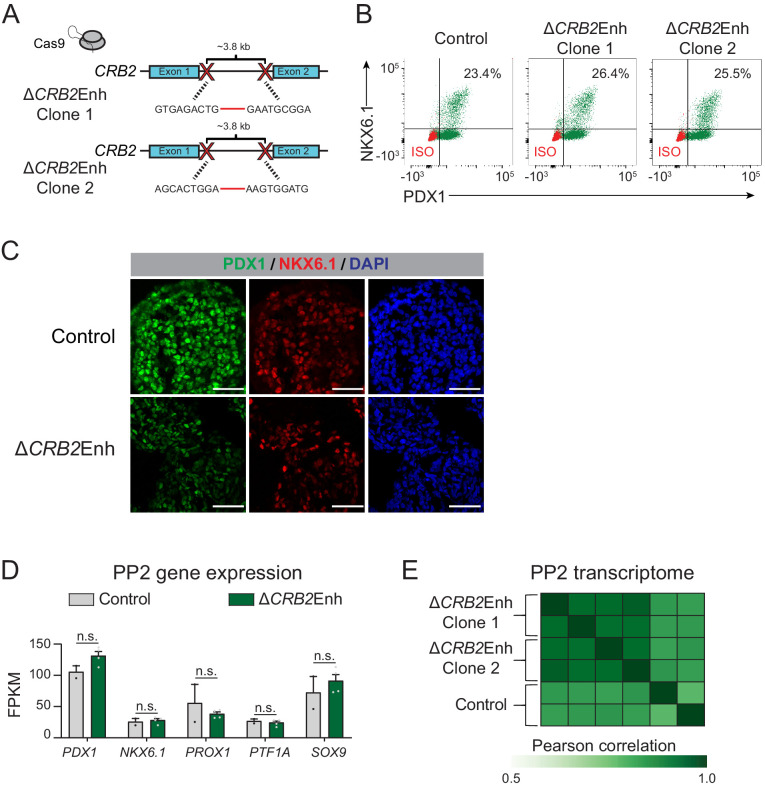
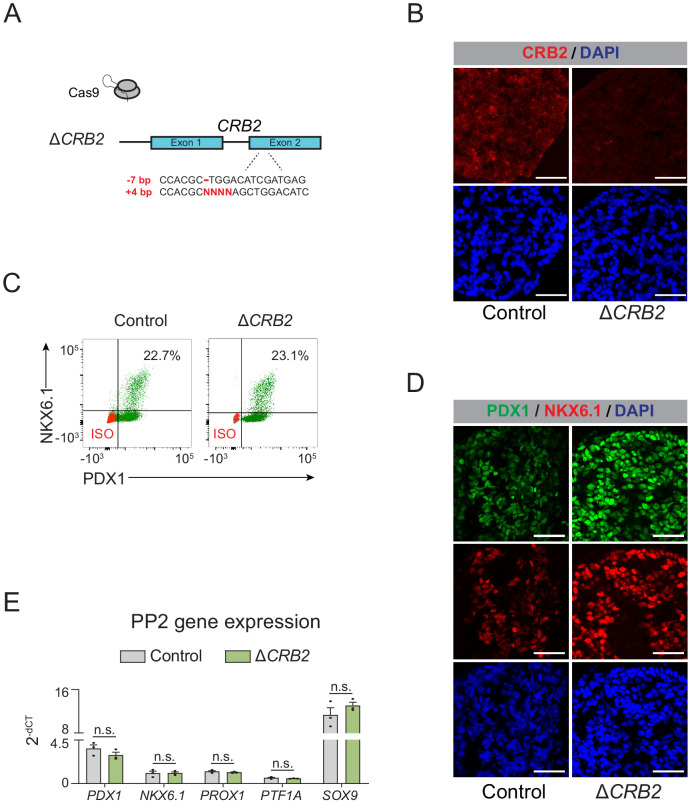
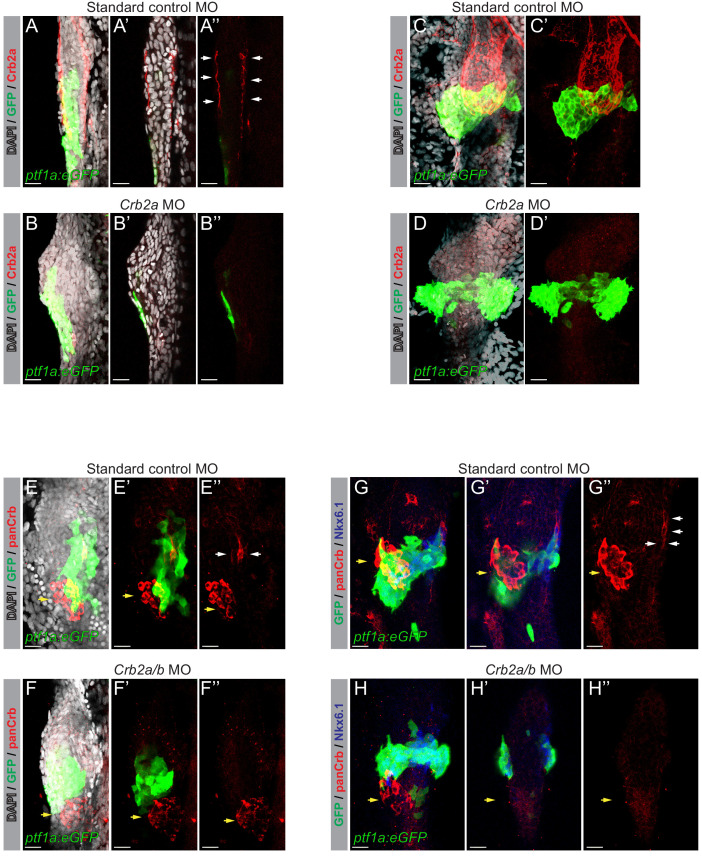
Genetic variants associated with type 2 diabetes (T2D) risk affect gene regulation in metabolically relevant tissues, such as pancreatic islets. Here, we investigated contributions of regulatory programs active during pancreatic development to T2D risk. Generation of chromatin maps from developmental precursors throughout pancreatic differentiation of human embryonic stem cells (hESCs) identifies enrichment of T2D variants in pancreatic progenitor-specific stretch enhancers that are not active in islets. Genes associated with progenitor-specific stretch enhancers are predicted to regulate developmental processes, most notably tissue morphogenesis. Through gene editing in hESCs, we demonstrate that progenitor-specific enhancers harboring T2D-associated variants regulate cell polarity genes LAMA1 and CRB2. Knockdown of lama1 or crb2 in zebrafish embryos causes a defect in pancreas morphogenesis and impairs islet cell development. Together, our findings reveal that a subset of T2D risk variants specifically affects pancreatic developmental programs, suggesting that dysregulation of developmental processes can predispose to T2D.

Keywords: GWAS; Type 2 diabetes; Zebrafish; chromatin; developmental biology; genetics; genomics; hESC; human; pancreas; zebrafish.


Conflict of interest statement

RG, AW, JC, JL, NW, SK, JW, YQ, JY, AA, BR, PD, MS No competing interests declared, KG This author consults for Genentech.

Figures

Figure 1.
Figure 1.. T2D-associated risk variants are enriched in stretch enhancers of pancreatic progenitors independent of islet stretch enhancers.
(A) Schematic illustrating the stepwise differentiation of human embryonic stem cells (hES) into pancreatic progenitors (solid arrows) and lineage relationship to islets (dotted arrow). Developmental intermediates include definitive endoderm (DE), gut tube (GT), early pancreatic progenitor (PP1), and late pancreatic progenitor (PP2) cells. (B) Box plots depicting length of typical enhancers (TE) and stretch enhancers (SE) at each developmental stage and in primary human islets. Plots are centered on median, with box encompassing 25–75th percentile and whiskers extending up to 1.5 interquartile range. Total numbers of enhancers are shown above each box plot. (C) Examples of stretch enhancers (denoted with red boxes) near the genes encoding the pancreatic lineage-determining transcription factors NKX6.1 and PDX1, respectively. Chromatin states are based on ChromHMM classifications: TssA, active promoter; TssFlnk, flanking transcription start site; TssBiv, bivalent promoter; Repr, repressed; EnhA, active enhancer; EnhP, poised enhancer. (D) Percentage of TE and SE overlapping with at least one ATAC-seq peak at PP2 or in islets. Enrichment analysis comparing observed and expected overlap based on random genomic regions of the same size and located on the same chromosome averaged over 10,000 iterations (***p<1 × 10−4; permutation test). ATAC-seq peaks were merged from two independent differentiations for PP2 stage cells and four donors for primary islets. (E) Genome-wide enrichment of T2D-associated variants (minor allele frequency >0.0025) in stretch enhancers, ATAC-seq peaks, and ATAC-seq peaks within stretch enhancers for all developmental stages when modeling each annotation separately. Points and lines represent log-scaled enrichment estimates and 95% confidence intervals from functional genome wide association analysis (fgwas), respectively. ATAC-seq peaks were merged from two independent differentiations for ES, DE, GT, PP1, and PP2 stage cells and from four donors for primary islets. (F) Genome-wide enrichment of T2D-associated variants (minor allele frequency >0.0025) in ATAC-seq peaks within stretch enhancers for all developmental stages and coding exons when considering all annotations in a joint model. Points and lines represent log-scaled enrichment estimates and 95% confidence intervals from fgwas, respectively. ATAC-seq peaks were merged from two independent differentiations for ES, DE, GT, PP1, and PP2 stage cells and from four donors for primary islets. See also Figure 1—figure supplement 1.
Figure 1—figure supplement 1.
Figure 1—figure supplement 1.. Characterization of typical and stretch enhancers in pancreatic developmental intermediates and islets.
(A) Diagram illustrating incorporation of histone modification and CTCF ChIP-seq data to generate chromatin state calls via ChromHMM. (B) Percentage of the genome covered by defined chromatin states at each developmental stage and in primary human islets. Chromatin states are based on ChromHMM classifications: TssA, active promoter; TssFlnk, flanking transcription start site; TssBiv, bivalent promoter; Repr, repressed; EnhA, active enhancer; EnhP, poised enhancer. (C) Percentage of typical (TE) and stretch enhancers (SE) relative to all enhancers at each developmental stage and in islets. (D) Box plots showing mRNA levels based on RNA-seq of nearest expressed genes (fragments per kilobase per million fragments mapped (FPKM) ≥1) for TE and SE at each developmental stage and in islets (***p=4.68 × 10−7, 4.64 × 10−11, 1.31 × 10−5, 8.85 × 10−9, 5.34 × 10−6, and <2.2 × 10−16 for TE vs SE comparisons in ES, DE, GT, PP1, PP2, and islets, respectively; Wilcoxon rank sum test, two sided). Plots are centered on median, with box encompassing 25-75th percentile and whiskers extending up to 1.5 interquartile range. n = 3 replicates from independent differentiations at ES, DE, GT, PP1, and PP2, respectively; n = 3 islet replicates. (E) Percentage of TE and SE overlapping with at least one ATAC-seq peak in ES, DE, GT, or PP1. Enrichment analysis comparing observed and expected overlap based on random genomic regions of the same size and located on the same chromosome averaged over 10,000 iterations (***p<1 × 10−4; permutation test). ATAC-seq peaks were merged from two independent differentiations. (F) Percentage of TE and SE overlapping 0, 1, 2, 3, or 4+ ATAC-seq peaks at each developmental stage and in islets. ATAC-seq peaks were merged from two independent differentiations for ES, DE, GT, PP1, and PP2 stage cells and from four donors for primary islets.
Figure 2.
Figure 2.. Candidate target genes of pancreatic progenitor-specific stretch enhancers regulate developmental processes.
(A) Schematic illustrating identification of pancreatic progenitor-specific stretch enhancers (PSSE). (B) Heatmap showing density of H3K27ac ChIP-seq and ATAC-seq reads at PSSE, centered on overlapping H3K27ac and ATAC-seq peaks, respectively, and spanning 5 kb in ES, DE, GT, PP1, PP2, and islets. PSSE coordinates in Figure 2—source data 1. (C) Percentage of PSSE exhibiting indicated chromatin states at defined developmental stages and in islets. (D) Percentage of PSSE overlapping with at least one ChIP-seq peak at PP2 for the indicated transcription factors. Enrichment analysis comparing observed and expected overlap based on random genomic regions of the same size and located on the same chromosome averaged over 10,000 iterations (***p<1×10⁻⁴; permutation test). (E) Gene ontology analysis for nearest expressed genes (fragments per kilobase per million fragments mapped (FPKM) ≥1 at PP2) to the 492 PSSE. See also Figure 2—source data 2. (F) Enrichment (LD score regression coefficient z-scores) of T2D, developmental, and metabolic GWAS trait-associated variants at accessible chromatin sites in PSSE as compared with PP2 and islet stretch enhancers. Significant enrichment was identified within accessible chromatin at PP2 stretch enhancers for lean type 2 diabetes (Z = 2.06, *p=3.94 × 10−2), at PP2 stretch enhancers for type 2 diabetes (Z = 3.57, ***p=3.52 × 10−4), at islet stretch enhancers for type 2 diabetes (Z = 2.78, **p=5.46 × 10−3), at islet stretch enhancers for fasting proinsulin levels (Z = 2.83, **p=4.61 × 10−3), at islet stretch enhancers for HOMA-B (Z = 2.58, **p=9.85 × 10−3), at PP2 stretch enhancers for disposition index (Z = 2.18, *p=2.94 × 10−2), at islet stretch enhancers for acute insulin response (Z = 2.24, *p=2.51 × 10−2), at islet stretch enhancers for HbA1c (Z = 1.98, *p=4.72 × 10−2), and at islet stretch enhancers for fasting glucose levels (Z = 2.64, **p=8.31 × 10−3). See also Figure 2—source data 3 and Figure 2—figure supplement 1.
Figure 2—figure supplement 1.
Figure 2—figure supplement 1.. Characterization of pancreatic progenitor-specific stretch enhancers.
(A) Percentage of PSSE overlapping with at least one ATAC-seq peak at PP2. Enrichment analysis comparing observed and expected overlap based on random genomic regions of the same size and located on the same chromosome averaged over 10,000 iterations (***p<1 × 10−4; permutation test). (B) Percentage of PSSE overlapping 0, 1, 2, 3, or 4+ ATAC-seq peaks at PP2. (C) Enriched transcription factor (TF) binding motifs with associated p-values at ATAC-seq peaks at PP2 intersecting PSSE. Fisher’s exact test, two sided, corrected for multiple comparisons. (D) Box plots showing mRNA levels based on RNA-seq of nearest expressed genes (fragments per kilobase per million fragments mapped (FPKM) ≥1 at PP2) for PSSE at each developmental stage and in islets (*p=1.10 × 10−2 for GT vs PP1; ***p=1.80 × 10−8 for GT vs PP2, p<2.2 × 10−16 for PP2 vs islet; Wilcoxon rank sum test, two sided). Plots are centered on median, with box encompassing 25-75th percentile and whiskers extending up to 1.5 interquartile range. n = 3 replicates from independent differentiations at ES, DE, GT, PP1, and PP2, respectively; n = 3 islet replicates. (E) Box plots showing H3K27ac signal at PSSE in tissues and cell lines from the ENCODE and Epigenome Roadmap projects as well as in developmental intermediates and islets (ISL). Plots are centered on median, with box encompassing 25-75th percentile and whiskers extending up to 1.5 interquartile range. See also Figure 2—source data 4. (F) Number of PSSE overlapping defined chromatin states in human adipose stromal cells from preadipose (hASC1) to mature adipose state (hASC4) (from Varshney et al., 2017). ChromHMM classifications: Quiescent; ReprPCWk, Weak Repressed PolyComb; TxWk, Weak Transcription; Tx, Strong Transcription; EnhWk, Weak Enhancer; ReprPC, Repressed Polycomb; EnhA1, Active Enhancer 1; EnhG, Genic Enhancer; EnhA2, Active Enhancer 2.
Figure 3.
Figure 3.. Identification of T2D risk variants associated with pancreatic progenitor-specific stretch enhancers.
(A) Manhattan plot showing T2D association p-values (from Mahajan et al., 2018) for 10,738 variants mapping within PSSE. The dotted line shows the threshold for Bonferroni correction (p=4.66 × 10−6). Novel loci identified with this threshold and mapping at least 500 kb away from a known locus are highlighted in blue. Chromosomal coordinates of T2D-associated PSSE are indicated. (B) mRNA levels (measured in fragments per kilobase per million fragments mapped [FPKM]) at PP2 (blue) and in human embryonic pancreas (54 and 58 days gestation, gold) of nearest expressed (FPMK ≥1) gene at PP2 for PSSE harboring T2D variants identified in A. (C) PP2 specificity of H3K27ac signal at PSSE harboring T2D variants identified in A. Z-score comparing H3K27ac signal at PP2 to H3K27ac signal in tissues and cell lines from the ENCODE and Epigenome Roadmap projects. See also Figure 3—figure supplement 1.
Figure 3—figure supplement 1.
Figure 3—figure supplement 1.. Activity of T2D risk-associated pancreatic progenitor-specific stretch enhancers across human tissues.
(A) mRNA levels (measured in fragments per kilobase per million fragments mapped [FPKM]) at PP2 and in human embryonic pancreas (54 and 58 days gestation, Emb Pan) of all genes expressed (FPKM ≥1) at PP2 and located within topologically associated domains (TADs) containing indicated PSSE harboring T2D variants identified in Figure 3A. (B) Heatmap showing H3K27ac signal at PSSE harboring T2D variants identified in Figure 3A. Quantification in tissues and cell lines from the ENCODE and Epigenome Roadmap projects (tissues) as well as in developmental intermediates and islets (ISL) is shown. (C) H3K27ac signal at LAMA1-associated PSSE in tissues and cell lines from the ENCODE and Epigenome Roadmap projects as well as in developmental intermediates and islets.
Figure 4.
Figure 4.. A T2D risk-associated LAMA1 pancreatic progenitor-specific stretch enhancer regulates LAMA1 expression specifically in pancreatic progenitors.
(A) (Top) Locus plots showing T2D association p-values for variants in a 35 kb window (hg19 chr18:7,050,000–7,085,000) at the LAMA1 locus and LAMA1 PSSE (red box). Fine mapped variants within the 99% credible set for the LAMA1 locus are colored black. All other variants are colored light gray. (Bottom) Chromatin states and ATAC-seq signal in ES, DE, GT, PP1, and PP2. TssA, active promoter; TssFlnk, flanking transcription start site; TssBiv, bivalent promoter; Repr, repressed; EnhA, active enhancer; EnhP, poised enhancer. (B) FOXA1, FOXA2, GATA4, GATA6, HNF6, SOX9, and PDX1 ChIP-seq profiles at the LAMA1 PSSE in PP2. The variant rs10502347 (red) overlaps transcription factor binding sites and a predicted ATAC-seq footprint for the SOX9 sequence motif. Purple dotted lines indicate the core binding profile of the average SOX9 footprint genome-wide and the blue dotted line indicates the position of rs10502347 within the SOX9 motif. (C) LAMA1 mRNA expression at each developmental stage determined by RNA-seq, measured in fragments per kilobase per million fragments mapped (FPKM). Data shown as mean ± S.E.M. (n = 3 replicates from independent differentiations). Light blue and purple indicate classification of the LAMA1 PSSE as typical enhancer (TE) and stretch enhancer (SE), respectively. (D) LAMA1 mRNA expression at each developmental stage determined by qPCR in control and ∆LAMA1Enh cells. Data are shown as mean ± S.E.M. (n = 3 replicates from independent differentiations for control cells. ∆LAMA1Enh cells represent combined data from two clonal lines with three replicates for each line from independent differentiations. n = 3 technical replicates for each sample; p=0.319, 0.594, 0.945, 0.290, and <1 × 10−6 for comparisons in ES, DE, GT, PP1, and PP2, respectively; student’s t-test, two sided; ***p<0.001, n.s., not significant). Light blue and purple indicate classification of the LAMA1 PSSE as TE and SE, respectively. Each plotted point represents the average of technical replicates for each differentiation. (E) mRNA expression determined by RNA-seq at PP2 of genes expressed in either control or ∆LAMA1Enh cells (FPKM ≥ 1 at PP2) and located within the same topologically associated domain as LAMA1. Data are shown as mean FPKM ± S.E.M. (n = 2 replicates from independent differentiations for control cells. ∆LAMA1Enh cells represent combined data from two clonal lines with two replicates for each line from independent differentiations. p adj. = 0.389 and 8.11 × 10−3 for ARHGAP28 and LAMA1, respectively; DESeq2). See also Figure 4—figure supplements 1 and 2.
Figure 4—figure supplement 1.
Figure 4—figure supplement 1.. Deletion of the LAMA1-associated pancreatic progenitor-specific enhancer does not affect pancreatic lineage specification.
(A) Odds ratio estimates (points) and 95% CIs (lines) for rs10502347 association with T2D and metabolic GWAS traits. Significant associations are colored black, non-significant are colored light grey. (B) Schematic illustrating CRISPR-Cas9-mediated deletion strategy of LAMA1-associated PSSE to generate independent ∆LAMA1Enh hESC clones with different DNA cleavage products. (C) Flow cytometry analysis for NKX6.1 and PDX1 comparing control and ∆LAMA1Enh PP2 cells. Isotype control (ISO) for each antibody is shown in red and target protein staining in green. Percentage of cells expressing each protein is indicated (representative experiment, n = 3 independent differentiations). (D) Immunofluorescent staining for NKX6.1 and PDX1 in control and ∆LAMA1Enh PP2 cells (representative images, n = 2 slides). Scale bar, 50 μm. (E) mRNA expression of pancreatic transcription factors determined by RNA-seq in control and ∆LAMA1Enh PP2 cells. Data are shown as mean of fragments per kilobase per million fragments mapped (FPKM) ± S.E.M. (n = 2 replicates from independent differentiations for control cells. ∆LAMA1Enh cells represent combined data from two clonal lines with two replicates for each line from independent differentiations. p adj. = 3.56 × 10−2, 0.224, 0.829, 8.14 × 10−2, and 0.142, for comparisons of PDX1, NKX6.1, PROX1, PTF1A, and SOX9, respectively; DESeq2; * p adj. <0.05, n.s., not significant). (F) Similarity matrix showing Pearson correlations for normalized transcriptomes (log transformed expression for genes with FPKM ≥1 in ≥1 replicates) in control and ∆LAMA1Enh PP2 cells (n = 2 independent differentiations for control cells and for each ∆LAMA1Enh clone). See also Figure 4—source datas 1 and 2.
Figure 4—figure supplement 2.
Figure 4—figure supplement 2.. Deletion of LAMA1 does not affect pancreatic lineage specification.
(A) Schematic illustrating CRISPR-Cas9-mediated deletion strategy of LAMA1 to generate ∆LAMA1 hESC clonal line. (B) Immunofluorescent staining for Laminin in control and ∆LAMA1 PP2 cells (representative images, n = 2 independent slides). Scale bar, 50 μm. (C) Flow cytometry analysis for NKX6.1 and PDX1 comparing control and ∆LAMA1 PP2 cells. Isotype control (ISO) for each antibody is shown in red and target protein staining in green. Percentage of cells expressing each protein is indicated. (D) Immunofluorescent staining for NKX6.1 and PDX1 in control and ∆LAMA1 PP2 cells (representative images, n = 2 independent slides). Scale bar, 50 μm. (E) mRNA expression of pancreatic transcription factors determined by qPCR in control and ∆LAMA1 PP2 cells. Data are shown as mean ± S.E.M. (n = 3 replicates from independent differentiations. n = 3 technical replicates for each sample; p=2.19 × 10−2, 0.360, 6.25 × 10−2, 0.710, and 0.122 for comparisons of PDX1, NKX6.1, PROX1, PTF1A, and SOX9 expression in control compared to ∆LAMA1 PP2 cells, respectively; student’s t-test, two sided; n.s., not significant, *p<0.01). Each plotted point represents the average of technical replicates for each differentiation.
Figure 5.
Figure 5.. A T2D risk-associated CRB2 pancreatic progenitor-specific stretch enhancer regulates CRB2 expression specifically in pancreatic progenitors.
(A) (Top) Locus plots showing T2D association p-values for variants in a 35 kb window (hg19 chr9:126,112,000–126,147,000) at the CRB2 locus and CRB2 PSSE (red box). Fine mapped variants within the 99% credible set for the novel CRB2 locus are colored black. All other variants are colored light gray. (Bottom) Chromatin states and ATAC-seq signal in ES, DE, GT, PP1, and PP2. TssA, active promoter; TssFlnk, flanking transcription start site; TssBiv, bivalent promoter; Repr, repressed; EnhA, active enhancer; EnhP, poised enhancer. (B) FOXA1, FOXA2, GATA4, GATA6, HNF6, SOX9, and PDX1 ChIP-seq profiles at the CRB2 PSSE in PP2. The variant rs2491353 (black) overlaps with transcription factor binding sites. (C) CRB2 mRNA expression at each developmental stage determined by RNA-seq, measured in fragments per kilobase per million fragments mapped (FPKM). Data shown as mean ± S.E.M. (n = 3 replicates from independent differentiations). Light blue and purple indicate classification of the CRB2 PSSE as typical enhancer (TE) and stretch enhancer (SE), respectively. Plotted points represent average of technical replicates for each differentiation. (D) CRB2 mRNA expression at each developmental stage determined by qPCR in control and ∆CRB2Enh cells. Data are shown as mean ± S.E.M. (n = 3 replicates from independent differentiations for control cells. ∆CRB2Enh cells represent combined data from two clonal lines with three replicates for each line from independent differentiations. n = 3 technical replicates for each sample; p=7.03 × 10−4,<1 × 10−6,<1 × 10−6, 1.46 × 10−2, and <1 × 10−6 for comparisons in ES, DE, GT, PP1, and PP2, respectively; student’s t-test, two sided; ***p<0.001 **p<0.01). Light blue and purple indicate classification of the CRB2 PSSE as TE and SE, respectively. Each plotted point represents the average of technical replicates for each differentiation. (E) mRNA expression determined by RNA-seq at PP2 of genes expressed in either control or ∆CRB2Enh cells (FPKM ≥ 1 at PP2) and located within the same topologically associated domain as CRB2. Data are shown as mean FPKM ± S.E.M. (n = 2 replicates from independent differentiations for control cells. ∆CRB2Enh cells represent combined data from two clonal lines with two replicates for each line from independent differentiations. p adj. = 0.158, 1.00, and 3.51 × 10−3, for MIR600HG, STRBP, and CRB2, respectively; DESeq2; **p<0.01, n.s., not significant). See also Figure 5—figure supplements 1–3.
Figure 5—figure supplement 1.
Figure 5—figure supplement 1.. Activity of CRB2- and PGM1-associated pancreatic progenitor-specific stretch enhancers across human tissues.
(A) (Top) Locus plots showing T2D association p-values for variants in a 43 kb window (hg19 chr1:64,084,000–64,127,000) at the PGM1 locus and PGM1 PSSE (red box). Fine mapped variants within the 99% credible set for the novel PGM1 locus are colored black. All other variants are colored light gray. (Bottom) Chromatin states and ATAC-seq signal in ES, DE, GT, PP1, and PP2. TssA, active promoter; TssFlnk, flanking transcription start site; TssBiv, bivalent promoter; Repr, repressed; EnhA, active enhancer; EnhP, poised enhancer. (B) FOXA1, FOXA2, GATA4, GATA6, HNF6, SOX9, and PDX1 ChIP-seq profiles at the PGM1 PSSE in PP2 cells. The variants rs2269247, rs2301055, rs2301054, and rs2269246 (black) overlap with transcription factor binding sites. (C) H3K27ac signal at CRB2-associated PSSE in tissues and cell lines from the ENCODE and Epigenome Roadmap projects as well as in developmental intermediates and islets (ISL). (D) H3K27ac signal at PGM1-associated PSSE in tissues and cell lines from the ENCODE and Epigenome Roadmap projects as well as in developmental intermediates and islets.
Figure 5—figure supplement 2.
Figure 5—figure supplement 2.. Deletion of the CRB2-associated pancreatic progenitor-specific enhancer does not affect pancreatic lineage specification.
(A) Schematic illustrating CRISPR-Cas9-mediated deletion strategy of CRB2-associated PSSE to generate independent ∆CRB2Enh hESC clones with different DNA cleavage products. (B) Flow cytometry analysis for NKX6.1 and PDX1 comparing control and ∆CRB2Enh PP2 cells. Isotype control (ISO) for each antibody is shown in red and target protein staining in green. Percentage of cells expressing each protein is indicated (representative experiment, n = 3 independent differentiations). (C) Immunofluorescent staining for NKX6.1 and PDX1 in control and ∆CRB2Enh PP2 cells (representative images, n = 2 independent slides). Scale bar, 50 μm. (D) mRNA expression of pancreatic transcription factors determined by RNA-seq in control and ∆CRB2Enh PP2 cells. Data are shown as mean of fragments per kilobase per million fragments mapped (FPKM) ± S.E.M. (n = 2 replicates from independent differentiations for control cells ∆CRB2Enh cells represent combined data from two clonal lines with two replicates for each line from independent differentiations. p adj. = 1.00, 1.00, 1.00, 1.00, and 1.00, for comparisons of PDX1, NKX6.1, PROX1, PTF1A, and SOX9, respectively; DESeq2; n.s., not significant). (E) Similarity matrix showing Pearson correlations for normalized transcriptomes (log transformed expression for genes with FPKM ≥1 in ≥1 replicates) in control and ∆CRB2Enh PP2 cells (n = 2 independent differentiations for control cells and for each ∆CRB2Enh clone). See also Figure 5—source data 1.
Figure 5—figure supplement 3.
Figure 5—figure supplement 3.. Deletion of CRB2 does not affect pancreatic lineage specification.
(A) Schematic illustrating CRISPR-Cas9-mediated deletion strategy of CRB2 to generate ∆CRB2 hESC clonal line. (B) Immunofluorescent staining for CRB2 in control and ∆CRB2 PP2 cells (representative images, n = 2 independent slides). Scale bar, 50 μm. (C) Flow cytometry analysis for NKX6.1 and PDX1 comparing control and ∆CRB2 PP2 cells. Isotype control (ISO) for each antibody is shown in red and target protein staining in green. Percentage of cells expressing each protein is indicated. (D) Immunofluorescent staining for NKX6.1 and PDX1 in control and ∆CRB2 PP2 cells (representative images, n = 2 independent slides). Scale bar, 50 μm. (E) mRNA expression of pancreatic transcription factors determined by qPCR in control and ∆CRB2 PP2 cells. Data are shown as mean ± S.E.M. (n = 3 replicates from independent differentiations. n = 3 technical replicates for each sample; p=0.241, 0.971, 0.397, 0.374, and 0.311 for comparisons of PDX1, NKX6.1, PROX1, PTF1A, and SOX9 expression in control compared to ∆CRB2 PP2 cells, respectively; student’s t-test, two sided; n.s., not significant). Each plotted point represents the average of technical replicates for each differentiation.
Figure 6.
Figure 6.. lama1 and crb2 regulate pancreas morphogenesis and beta cell differentiation.
(A,B) Representative 3D renderings of Tg(ptf1a:eGFP)jh1 control zebrafish embryos (A,A’) and lama1 morphants (B,B’) stained with DAPI (nuclei, blue) and antibody against insulin (red); n ≥ 15 embryos per condition. To account for reduced acinar pancreas size in lama1 morphants, control embryos were imaged at 50 hr post fertilization (hpf) and lama1 morphants at 78 hpf. 15 out of 34 lama1 morphants displayed an annular pancreas with two acinar pancreas domains (green) connected behind the presumptive intestine (B’, white arrow). Scale bar, 40 µM. (C,D) Representative 3D renderings of 78 hpf Tg(ptf1a:eGFP)jh1 control zebrafish embryos (C,C’) and crb2a/b morphants (D,D’) stained with DAPI (nuclei, blue) and antibodies against insulin (red); n ≥ 15 embryos per condition. Twenty-seven out of 69 crb2a/b morphants displayed an annular pancreas with the acinar pancreas (green) completely surrounding the presumptive intestine. Scale bar, 40 µM. (E) Representative 3D renderings of Tg(ptf1a:eGFP)jh1 control zebrafish embryos and crb2a/b, lama1, or crb2a/b + lama1 morphants stained with DAPI (nuclei, blue) and antibody against insulin (red). All embryos were imaged at 78 hpf except for controls to lama1 and crb2a/b + lama1 morphants, which were imaged at 50 hpf to account for reduced acinar pancreas size of lama1 morphants. Scale bar, 20 µM. (F) Quantification of beta (insulin+) cell nuclei per embryo from experiment in (E). p adj. = 4.0 × 10−3, 8.0 × 10−3, and 2.0 × 10−4 for comparison of hfp 78 control (n = 7 embryos) to hfp 78 crb2a/b (n = 8), hpf 50 control (n = 12) to hpf 78 lama1 (n = 10), or crb2a/b + lama1 (n = 12) morphants, respectively; ANOVA-Dunnett’s multiple comparison test; ***p<0.001 **p<0.01. 5 out of 8 crb2a/b, 3 out of 10 lama1, and 9 out of 12 crb2a/b + lama1 morphants displayed an annular pancreas. MO, morpholino; Control, standard control morpholino. See also Figure 6—figure supplements 1–4.
Figure 6—figure supplement 1.
Figure 6—figure supplement 1.. Laminin and Crb are expressed in zebrafish pancreas progenitors.
(A,B) Confocal images of 36 hr post fertilization (hpf) Tg(ptf1a:eGFP)jh1 zebrafish foregut endoderm labeled with DAPI (nuclei, grey) and antibodies against Nkx6.1 (blue; pancreatic progenitors) and Laminin (A, red) or panCrb (B, red); n = 10 embryos stained. (A–A”’’) Z-focal plane image showing pancreatic progenitor cells marked by Nkx6.1 (blue) and low level ptf1a:eGFP, labeled with anti-Laminin antibodies (red). (B–B”’’) Pancreatic progenitors labeled with anti-panCrb antibodies (red). Scale bar, 20 µM.
Figure 6—figure supplement 2.
Figure 6—figure supplement 2.. Validation of morpholinos targeting lama1.
Confocal images (3D rendered) of 32–34 hpf Tg(ptf1a:eGFP)jh1 zebrafish foregut endoderm labeled with DAPI (nuclei, grey) and anti-Laminin antibodies (red). (A–A’’) Z-focal plane image of pancreatic progenitors marked by ptf1a:eGFP (green) and labeled with anti-Laminin antibodies (red) from embryos injected with non-targeting standard control morpholinos (n = 6). (B–B’’) Z-focal plane image showing loss of Laminin staining (red) in pancreatic progenitors marked by ptf1a:eGFP (green) from embryos injected with morpholinos targeting lama1 (n = 5/6). (C,D) 3D renderings of 45 hpf Tg(ptf1a:eGFP)jh1 zebrafish foregut endoderm labeled with antibodies against Nkx6.1 (blue) and Laminin (red). (C–C’’) Z-focal plane image of pancreatic progenitors marked by ptf1a:eGFP (green) and labeled with anti-Nkx6.1 (blue) and anti-Laminin (red) antibodies from embryos injected with standard control morpholinos (n = 4/4). (D–D’’) Z-focal plane image showing loss of Laminin staining (red) in pancreatic progenitors marked by ptf1:eGFP and labeled with anti-Nkx6.1 antibodies (blue) from embryos injected with morpholinos targeting lama1 (n = 3/4). Scale bar, 20 µM. Arrows highlight pancreatic progenitors marked by Laminin (red), Nkx6.1 (blue) and ptf1a:eGFP. MO, morpholino.
Figure 6—figure supplement 3.
Figure 6—figure supplement 3.. Validation of morpholinos targeting crb2a and crb2b.
(A,B) 3D renderings of 32–34 hpf Tg(ptf1a:eGFP)jh1 zebrafish foregut endoderm labeled with DAPI (nuclei, grey) and anti-Crb2a antibodies (red). (A–A’’) Z-focal plane image showing Crb2a labeled (red) foregut endoderm from embryos injected with standard control morpholinos (n = 6). (B–B’’) Z-focal plane image showing loss of Crb2a staining (red) in the foregut endoderm from embryos injected with morpholinos targeting crb2a (n = 6/6). (C,D) 3D renderings of 45 hpf Tg(ptf1a:eGFP)jh1 zebrafish foregut endoderm labeled with DAPI (nuclei, grey) and anti-Crb2a antibodies (red). (C–C’) Z-focal plane image showing Crb2a-labeled (red) embryos injected with standard control morpholinos (n = 3). (D–D’) Z-focal plane image showing loss of Crb2a staining (red) in embryos injected with morpholinos targeting crb2a (n = 3/3).(E,F) 3D renderings of 32–34 hpf Tg(ptf1a:eGFP)jh1 zebrafish foregut endoderm labeled with DAPI (nuclei, grey) and anti-panCrb antibodies (red). (E–E’’) Z-focal plane image showing pancreatic progenitors marked by ptf1a:eGFP (green) and labeled with anti-panCrb antibodies (red; white arrows) from embryos injected with standard control morpholinos (n = 8). (F–F’’) Z-focal plane image showing reduced panCrb (red) staining in pancreatic progenitors marked by ptf1a:eGFP (green) from embryos injected with morpholinos targeting both crb2a and crb2b (n = 4/5). (G,H) 3D renderings of 45 hpf Tg(ptf1a:eGFP)jh1 zebrafish foregut endoderm labeled with anti-Nkx6.1 (blue) and anti-panCrb (red) antibodies. (G–G’’) Z-focal plane image showing pancreatic progenitors marked by ptf1a:eGFP (green) and labeled with anti-Nkx6.1 (blue) and anti-panCrb (red; white arrows) antibodies from embryos injected with standard control morpholinos (n = 4). (H–H’’) Z-focal plane image showing reduced panCrb (red) staining in pancreatic progenitors marked by ptf1a:eGFP and labeled with anti-Nkx6.1 antibodies (blue) from embryos injected with morpholinos targeting both crb2a and crb2b (n = 3/4). Yellow arrows denote dorsal pancreas where panCrb labeling remains in control injected embryos, possibly due to expression of alternate Crb proteins present within the dorsal pancreas. Scale bar, 20 µM. MO, morpholino.
Figure 6—figure supplement 4.
Figure 6—figure supplement 4.. crb2b but not crb2a regulates pancreatic beta cell differentiation.
Quantification of beta (insulin+) cell nuclei per embryo in Tg(ptf1a:eGFP)jh1 control zebrafish embryos and crb2a or crb2b morphants at 78 hr post fertilization (hpf). p adj. = 0.91 and 4.4 × 10−2 for comparison of control (n = 7 embryos) to crb2a (n = 8) or crb2b (n = 8) morphants, respectively; ANOVA-Dunnett’s multiple comparison test; **p<0.01, n.s., not significant. 0 out of 8 crb2a, 0 out of 8 crb2b morphants displayed an annular pancreas. MO, morpholino; Control, standard control morpholino.

Similar articles

Cited by

References

    1. Ahnfelt-Rønne J, Ravassard P, Pardanaud-Glavieux C, Scharfmann R, Serup P. Mesenchymal bone morphogenetic protein signaling is required for normal pancreas development. Diabetes. 2010;59:1948–1956. doi: 10.2337/db09-1010. - DOI - PMC - PubMed
    1. Alves CH, Bossers K, Vos RM, Essing AH, Swagemakers S, van der Spek PJ, Verhaagen J, Wijnholds J. Microarray and morphological analysis of early postnatal CRB2 mutant retinas on a pure C57BL/6J genetic background. PLOS ONE. 2013;8:e82532. doi: 10.1371/journal.pone.0082532. - DOI - PMC - PubMed
    1. Aylward A, Chiou J, Okino M-L, Kadakia N, Gaulton KJ. Shared genetic risk contributes to type 1 and type 2 diabetes etiology. Human Molecular Genetics. 2018;7:314. doi: 10.1093/hmg/ddy314. - DOI - PubMed
    1. Bhandare R, Schug J, Le Lay J, Fox A, Smirnova O, Liu C, Naji A, Kaestner KH. Genome-wide analysis of histone modifications in human pancreatic islets. Genome Research. 2010;20:428–433. doi: 10.1101/gr.102038.109. - DOI - PMC - PubMed
    1. Buenrostro JD, Giresi PG, Zaba LC, Chang HY, Greenleaf WJ. Transposition of native chromatin for fast and sensitive epigenomic profiling of open chromatin, DNA-binding proteins and nucleosome position. Nature Methods. 2013;10:1213–1218. doi: 10.1038/nmeth.2688. - DOI - PMC - PubMed

Publication types

MeSH terms

Substances