. 2021 Sep;42(13):4155-4172.
doi: 10.1002/hbm.25330. Epub 2021 Feb 5.

Personalized connectivity-guided DLPFC-TMS for depression: Advancing computational feasibility, precision and reproducibility

Affiliations

Personalized connectivity-guided DLPFC-TMS for depression: Advancing computational feasibility, precision and reproducibility

Robin F H Cash et al. Hum Brain Mapp. 2021 Sep.

Abstract

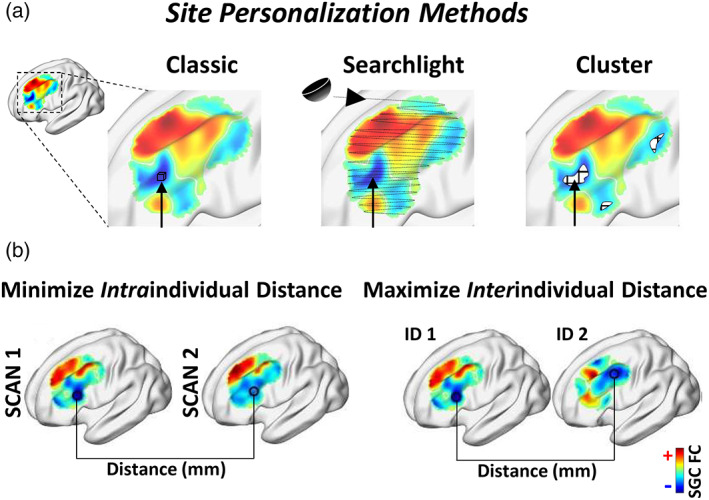
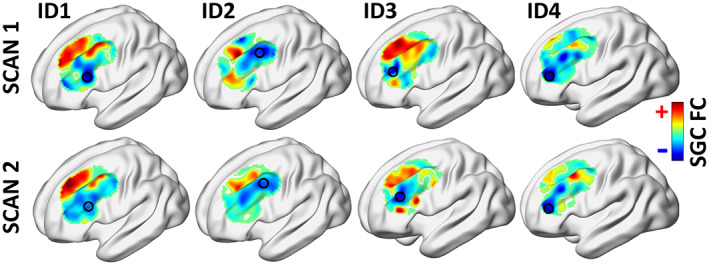
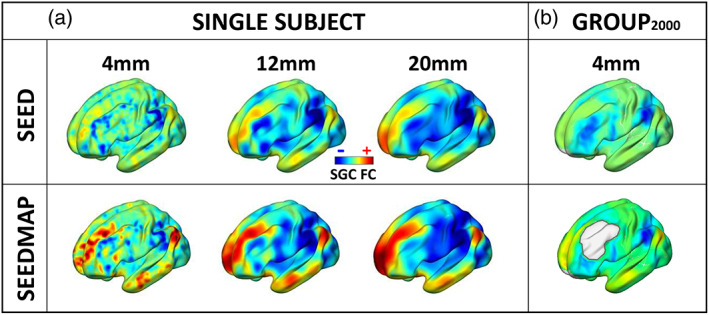
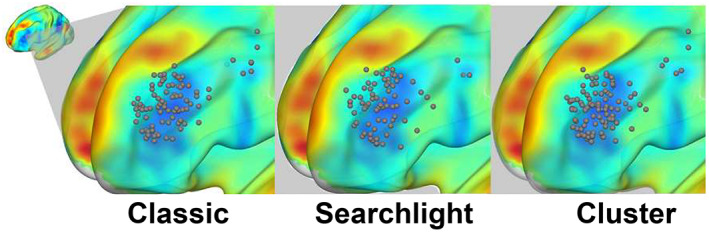
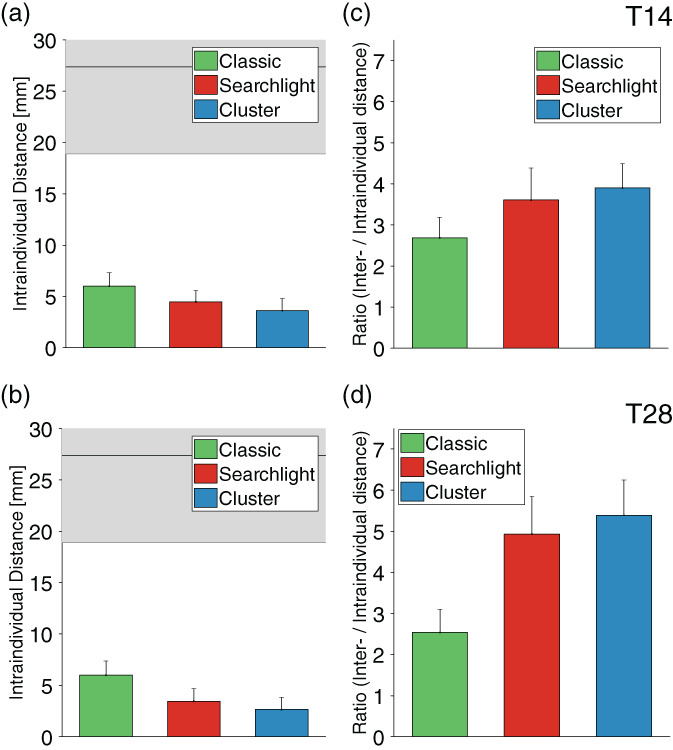
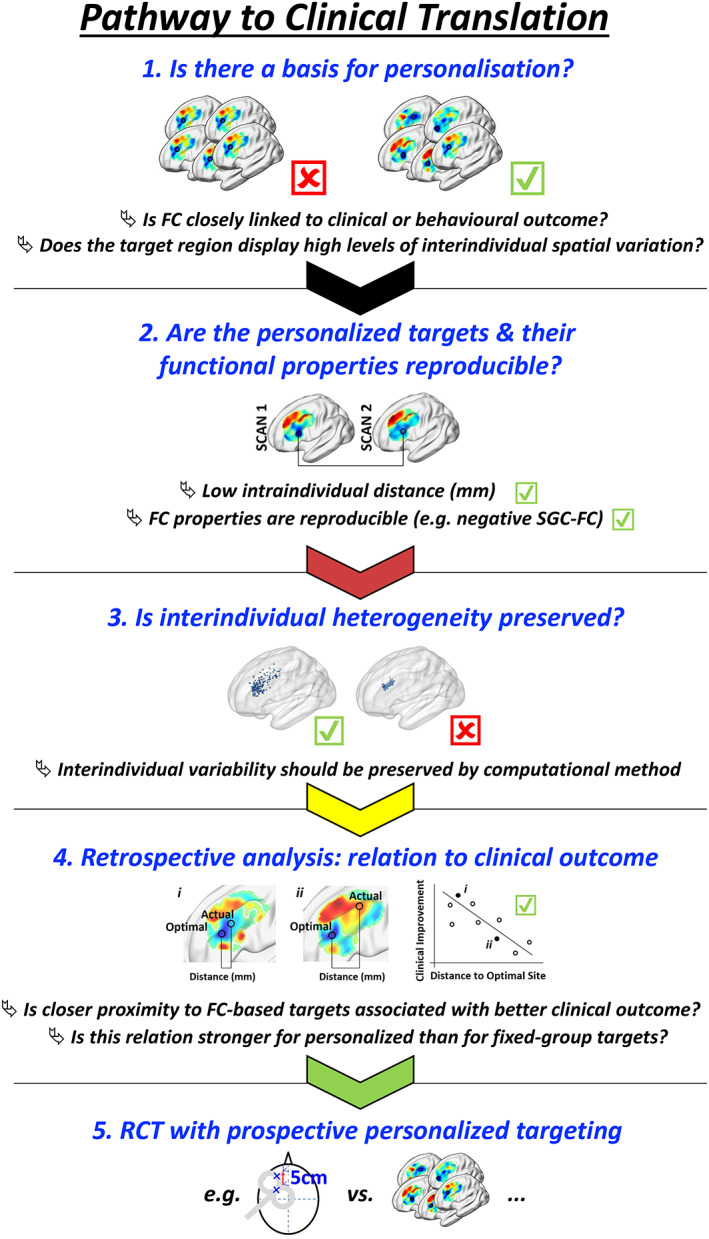
Repetitive transcranial magnetic stimulation (rTMS) of the dorsolateral prefrontal cortex (DLPFC) is an established treatment for refractory depression, however, therapeutic outcomes vary. Mounting evidence suggests that clinical response relates to functional connectivity with the subgenual cingulate cortex (SGC) at the precise DLPFC stimulation site. Critically, SGC-related network architecture shows considerable interindividual variation across the spatial extent of the DLPFC, indicating that connectivity-based target personalization could potentially be necessary to improve treatment outcomes. However, to date accurate personalization has not appeared feasible, with recent work indicating that the intraindividual reproducibility of optimal targets is limited to 3.5 cm. Here we developed reliable and accurate methodologies to compute individualized connectivity-guided stimulation targets. In resting-state functional MRI scans acquired across 1,000 healthy adults, we demonstrate that, using this approach, personalized targets can be reliably and robustly pinpointed, with a median accuracy of ~2 mm between scans repeated across separate days. These targets remained highly stable, even after 1 year, with a median intraindividual distance between coordinates of only 2.7 mm. Interindividual spatial variation in personalized targets exceeded intraindividual variation by a factor of up to 6.85, suggesting that personalized targets did not trivially converge to a group-average site. Moreover, personalized targets were heritable, suggesting that connectivity-guided rTMS personalization is stable over time and under genetic control. This computational framework provides capacity for personalized connectivity-guided TMS targets to be robustly computed with high precision and has the flexibly to advance research in other basic research and clinical applications.

Keywords: connectivity; depression; neuroimaging; personalization; precision psychiatry; transcranial magnetic stimulation.


Conflict of interest statement

The authors report no competing interests.

Figures

FIGURE 1
FIGURE 1
Schematic of experimental design, including personalization methodologies and evaluation metrics. (a) Illustration of the “classic”, “searchlight” and “cluster” based approaches for identifying the personalized stimulation target. The 'classic' method involves selecting the single most anticorrelated voxel within the DLPFC. The 'searchlight' method involves computing SGC FC within half‐spheres centerd at each voxel within the DLPFC. These half‐spheres are weighted by their proximity to the cortical surface and the most anticorrelated site is selected. The cluster approach involves retaining only a specified portion (between 0.1 and 50%) of the most negative voxels; these are then spatially clustered and the center‐of‐gravity of the largest cluster is defined as the target coordinate. (b) Measures quantifying the reliability of each personalization methodology. Intraindividual distance refers to the Euclidean distance between the target coordinate identified using two separate rfMRI scans from the same individual. Interindividual distance is defined as the distance between target coordinates from distinct individuals. Ideally, personalized targets should show high intraindividual precision while retaining a high degree of interindividual variation
FIGURE 2
FIGURE 2
Functional connectivity between subgenual cingulate cortex and dorsolateral prefrontal cortex (DLPFC) displayed across the spatial extent of DLPFC for four representative individuals. Personalized target sites (circled) were computed based on the cluster and seedmap method. Target sites are highly variable between individuals but are consistent within individuals across separate days. Red and blue denote DLPFC regions of positive or negative SGC functional connectivity, respectively
FIGURE 3
FIGURE 3
Influence of smoothing and comparison of SGC FC maps generated using seed and seedmap methodologies. (a) SGC FC maps are shown for a single representative participant, computed using either a conventional seed‐based approach (top row) or seedmap methodology (bottom row). The seedmap method generates a faithful representation of the conventional seed‐based SGC FC map. Finer details of the SGC FC map become evident when the seedmap method is utilized, likely because this enhances the signal‐to‐noise ratio of the SGC. Moving left to right, increasing the width of smoothing kernels (FWHM 4–20 mm) results in a pronounced loss of spatial information. (b) The group‐average SGC FC map (top row) derived from 2,000 brain scans (session 1 and 2 from 1,000 individuals). The seedmap method can be used to compute an individual's SGC time series as a weighted spatial average of the fMRI data across all gray matter voxels excluding the DLPFC
FIGURE 4
FIGURE 4
Precision of rTMS personalization. Intraindividual distances between personalized targets (illustrated in the inset, a) are displayed for different methodologies and acquisition times of (a) 14 and (b) 28 min, that is, half and full scan duration (T14, T28). Overall, individual target site coordinates were most reproducible when using the combination of cluster and seedmap methodologies. Notably, when generating the SGC FC map using a conventional seed approach, the classic and searchlight methods did not perform better than selecting two points at random within the DLPFC, even at an acquisition time of 28 min. The intraindividual distance was approximately halved using the cluster approach. The horizontal line reflects the average distance obtained if two points are selected at random within the DLPFC (n = 1,000). The lower edge of gray shading represents the lower bound of the 95% confidence interval when two points are selected at random within the DLPFC (denoted as “Chance”). The red arrow on the y‐axis indicates the most recent benchmark for intraindividual accuracy (3.5 cm) for pinpointing individualized targets across two successive scans (Ning et al., 2019). Intraindividual distance was further reduced to the range of millimeters using the seedmap approach, and was again lowest for the cluster‐based method. (c) Beyond the quantitative reduction in median intraindividual distance (shown in a and b), the consistency of accurately identifying reproducible targets across the population was substantially enhanced when using the combined cluster and seedmap methodologies. This is illustrated here by the tighter distribution, lower median and much lower maximum intraindividual distance between scans. Other methods are shown to generate highly divergent targets between repeat scans for some individuals. (d, e) Ratio between interindividual and intraindividual distance. This ratio provides a summary measure of the capacity to identify unique individual targets (interindividual distance) while also reproducibly identifying each target with high intraindividual precision (intraindividual variation). This ratio reached a maximum of 6.85 for the cluster combined with seedmap approach
FIGURE 5
FIGURE 5
Distribution of personalized targets across the spatial extent of the DLPFC. These are shown for 100 individuals, as computed using the classic, searchlight, and cluster methodologies combined with the seedmap approach
FIGURE 6
FIGURE 6
Reproducibility of targets after 1 year. These figures are derived from data for 45 individuals who underwent a repeat scan 365 days after their initial scan. All data were computed using seedmap methodology. (a, b) Target sites remained highly stable with acquisition times of 14 and 28 min, as indicated by a median intraindividual distance between scans that was as low as 2.7 mm for the cluster method at T28. (c, d) The ratio between interindividual and intraindividual distance remained high after 1 year reaching a maximum of 5.39 when the cluster method was applied to compute personalized targets
FIGURE 7
FIGURE 7
Personalized treatment sites are under genetic control. The genetic impact of personalized stimulation sites in the dorsolateral prefrontal cortex is indicated by increasing median interindividual distance with diverging familial status. The optimal stimulation target was most similar for monozygotic twins (MZ), and diverged increasingly for dizygotic twins (DZ), non‐twin siblings (NT) and unrelated individuals. Symbols represent significance values: *p = .008; # p = 3.2 × 10−5, Ψ p = 1.3 × 10−19
FIGURE 8
FIGURE 8
Ideal pathway to clinical translation. Important aspects for adoption of target site personalization are indicated. First, functional connectivity of the proposed target should be closely linked to relevant clinical or behavioral outcomes. Personalized targeting is most readily justified when there is substantial interindividual variation in relevant FC spatial topography. Second, personalized targets should be stable over time in terms of position and functional fidelity. Third, it is critical that any personalization methodology has the capacity to preserve underlying differences in interindividual FC topography—personalized targets should show a relatively broad spatial distribution. The result of ineffective personalization parameters is illustrated on the right: if the cluster threshold is too high, larger clusters were formed resulting in individualized coordinates gravitating toward the center of the DLPFC. Fourth, if possible retrospective analysis should be undertaken in an existing dataset to determine whether closer proximity between actual clinically implemented and proposed individualized targets relates to better treatment or behavioral outcomes. At this stage, it is also critical to demonstrate that personalization is warranted based on an analysis of personalized versus group consensus targets. Finally, the expense of target site personalization should be confirmed in a prospective randomized clinical trial. Note that each of these aspects will fail if MRI scan duration is too short

Comment in

References

    1. Barbour, T., Lee, E., Ellard, K., & Camprodon, J. (2019). Individualized TMS target selection for MDD: Clinical outcomes, mechanisms of action and predictors of response. Brain Stimulation: Basic, Translational, and Clinical Research in Neuromodulation, 12(2), 516.
    1. Barcia, J. A., Avecillas‐Chasin, J. M., Nombela, C., Arza, R., Garcia‐Albea, J., Pineda‐Pardo, J. A., … Strange, B. A. (2019). Personalized striatal targets for deep brain stimulation in obsessive‐compulsive disorder. Brain Stimulation, 12(3), 724–734. 10.1016/j.brs.2018.12.226 - DOI - PubMed
    1. Beam, W., Borckardt, J. J., Reeves, S. T., & George, M. S. (2009). An efficient and accurate new method for locating the F3 position for prefrontal TMS applications. Brain Stimulation, 2(1), 50–54. 10.1016/j.brs.2008.09.006 - DOI - PMC - PubMed
    1. Berlim, M. T., van den Eynde, F., Tovar‐Perdomo, S., & Daskalakis, Z. J. (2014). Response, remission and drop‐out rates following high‐frequency repetitive transcranial magnetic stimulation (rTMS) for treating major depression: A systematic review and meta‐analysis of randomized, double‐blind and sham‐controlled trials. Psychological Medicine, 44(2), 225–239.S0033291713000512. 10.1017/S0033291713000512 - DOI - PubMed
    1. Blumberger, D. M., Vila‐Rodriguez, F., Thorpe, K. E., Feffer, K., Noda, Y., Giacobbe, P., … Downar, J. (2018). Effectiveness of theta burst versus high‐frequency repetitive transcranial magnetic stimulation in patients with depression (THREE‐D): A randomised non‐inferiority trial. Lancet, 391(10131), 1683–1692. 10.1016/S0140-6736(18)30295-2 - DOI - PubMed

Publication types

MeSH terms

LinkOut - more resources