. 2021 May;42(7):1952-1968.
doi: 10.1002/hbm.25352. Epub 2021 Feb 5.

Resting cerebral oxygen metabolism exhibits archetypal network features

Affiliations

Resting cerebral oxygen metabolism exhibits archetypal network features

Nicholas A Hubbard et al. Hum Brain Mapp. 2021 May.

Abstract

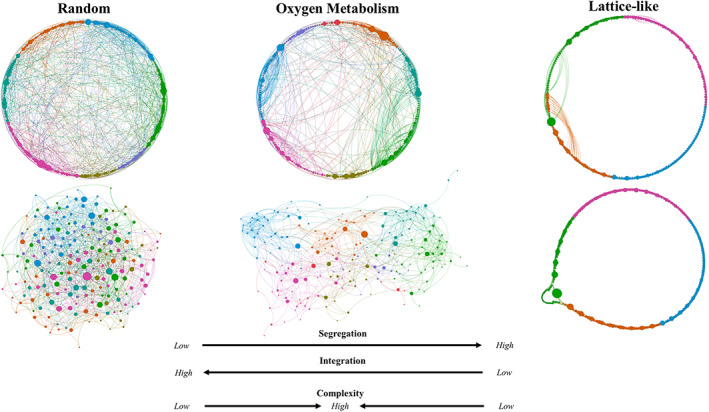
Standard magnetic resonance imaging approaches offer high-resolution but indirect measures of neural activity, limiting understanding of the physiological processes associated with imaging findings. Here, we used calibrated functional magnetic resonance imaging during the resting state to recover low-frequency fluctuations of the cerebral metabolic rate of oxygen (CMRO2 ). We tested whether functional connections derived from these fluctuations exhibited organization properties similar to those established by previous standard functional and anatomical connectivity studies. Seventeen participants underwent 20 min of resting imaging during dual-echo, pseudocontinuous arterial spin labeling, and blood-oxygen-level dependent (BOLD) signal acquisition. Participants also underwent a 10 min normocapnic and hypercapnic procedure. Brain-wide, CMRO2 low-frequency fluctuations were subjected to graph-based and voxel-wise functional connectivity analyses. Results demonstrated that connections derived from resting CMRO2 fluctuations exhibited complex, small-world topological properties (i.e., high integration and segregation, cost efficiency) consistent with those observed in previous studies using functional and anatomical connectivity approaches. Voxel-wise CMRO2 connectivity also exhibited spatial patterns consistent with four targeted resting-state subnetworks: two association (i.e., frontoparietal and default mode) and two perceptual (i.e., auditory and occipital-visual). These are the first findings to support the use of calibration-derived CMRO2 low-frequency fluctuations for detecting brain-wide organizational properties typical of healthy participants. We discuss interpretations, advantages, and challenges in using calibration-derived oxygen metabolism signals for examining the intrinsic organization of the human brain.

Keywords: fMRI; functional connectivity; oxygen metabolism; resting state.


Conflict of interest statement

The authors declare no known competing interests.

Figures

FIGURE 1
FIGURE 1
Diagram of spontaneous breathing circuit and CO2‐challenge procedure. Before the gurney entered the bore of the magnet, a pulse‐oximetry sensor was placed on the participant's index finger, and participants were fitted with a two‐way non‐rebreathing valve/mouthpiece (2,600 series, by Hans Rudolph, KS, USA) and nose‐clip. The two‐way, non‐rebreathing valve, emitted exhaled air and also allowed room air or the CO2‐solution (depending on challenge phase) to flow inward. During scanning, portions of expired gases were sampled through accessory tubing that flowed to a capnograph (sampling End‐tidal CO2 [EtCO2] and breath rate [BR]) and heart rate (HR) and peripheral oxygen saturation (SpO2) were sampled using pulse oximetry. EtCO2, SpO2, BR, and HR measures were collected using capnography (Capnogard, Model 1,265, by Novametrix Medical Systems, CT, USA) and pulse‐oximetry (MEDRAD, PA, USA). Normocapnic conditions occurred for 4 min wherein a valve attached to a hose on the two‐way mouthpiece remained open so that the participant received room air. After 4 min of room‐air breathing the three‐way valve was opened, blocking room air, and allowing the 5% CO2‐solution to flow in from a 200 L Douglas Bag for 6 min
FIGURE 2
FIGURE 2
Low‐frequency fluctuations in cerebral oxygen metabolism and oxygen metabolism network nodes. (a) Low‐frequency fluctuations of CMRO2 were recovered from BOLD and CBF, as demonstrated here with data from a participant's posterior cingulate region. (b) Correlations between low‐frequency fluctuations of CMRO2 in spatially‐proximal voxels were used to create nodes of the OMN via the spatially‐constrained spectral clustering of approach (see Node Workflow; Craddock et al., 2012). One‐hundred and ninety‐four nodes are displayed here which were derived from participants' low‐frequency fluctuations of CMRO2
FIGURE 3
FIGURE 3
Oxygen metabolism and canonical network topologies. Illustration of the complex topology of a randomly‐selected participant's oxygen metabolism network (OMN) at r t = .25. Random, lattice‐like, and oxygen metabolism networks had identical numbers of nodes and a similar number of connections. Circular (top) and force‐directed (bottom) algorithms were applied. Colors = node neighborhoods, sizes = node betweenness centrality. Graphs were created using Gephi (Bastian, Heymann, & Jacomy, 2009). In circular graphs, random and OMN were sorted by neighborhood, but the lattice‐like network was sorted by row number to demonstrate connections primarily between nearest‐neighbors. In force‐directed graphs, scaling factors were increased to illustrate the effects
FIGURE 4
FIGURE 4
Comparative analyses of oxygen metabolism network segregation and integration properties. (a) Biplot of segregation (C) and integration (1/L) measurements. Large circles reflect network average coordinates, smaller dots reflect coordinates from individual networks for each r t. Contour lines reflect nonparametric cluster densities. (b) Distributions of C and 1/L across participants. Average distribution presented across study correlation thresholds (r t). Significance does not change at individual r t nor when using nonparametric tests (all ps < .001). d = Cohen's d effect size. *** = parametric and nonparametric p < .001
FIGURE 5
FIGURE 5
Comparison of seed‐based connectivity weights using calibration‐derived CMRO2 (top) and resting BOLD from Neurosynth database (bottom). Here, Neurosynth images were warped to Colin space but kept in their original resolution to illustrate spatial resolution differences. Opacities were decreased on reference images to emphasize anatomical features
FIGURE 6
FIGURE 6
Voxel‐to‐voxel relationships between seed‐based functional connectivity weights using calibration‐derived CMRO2 and Neurosynth BOLD
FIGURE 7
FIGURE 7
Spatial overlap of thresholded (top 10%) functional connectivity weights from calibration‐derived CMRO2 and Neurosynth BOLD maps using each subnetwork seed. Displays top 10% of positive correlations with each subnetwork seed for CMRO2 overlaid upon top 10% of positive correlations with each subnetwork seed for Neurosynth BOLD. ϕ= phi coefficient of binary association. RAI coordinates and anatomical labels for overlapping voxel clusters are found in Table 3

References

    1. Abdelkarim, D. , Zhao, Y. , Turner, M. P. , Sivakolundu, D. K. , Lu, H. , & Rypma, B. (2019). A neural‐vascular complex of age‐related changes in the human brain: Anatomy, physiology, and implications for neurocognitive aging. Neuroscience and Biobehavioral Reviews, 107, 927–944. 10.1016/j.neubiorev.2019.09.005 - DOI - PubMed
    1. Achard, S. , & Bullmore, E. (2007). Efficiency and cost of economical brain functional networks. Computational biology, 3, 174–183. - PMC - PubMed
    1. Achard, S. , Salvador, R. , Witcher, B. , Suckling, J. , & Bullmore, E. (2006). A resilient, low‐frequency, small‐world human brain functional network with highly connected association cortical hubs. The Journal of Neuroscience, 26, 63–72. - PMC - PubMed
    1. Ances, B. , Vaida, F. , Ellis, R. , & Buxton, R. B. (2011). Test–retest stability of calibrated BOLD‐fMRI in HIV− and HIV subjects. NeuroImage, 54, 2156–2162. 10.1016/j.neuroimage.2010.09.081 - DOI - PMC - PubMed
    1. Ances, B. M. , Liang, C. L. , Leontiev, O. , Perthen, J. E. , Fleisher, A. S. , Lansing, A. E. , & Buxton, R. B. (2009). Effects of aging on cerebral blood flow, oxygen metabolism, and blood oxygenation level dependent responses to visual stimulation. Human Brain Mapping, 30(4), 1120–1132. 10.1002/hbm.20574 - DOI - PMC - PubMed

Publication types

LinkOut - more resources