. 2021 Feb 5;16(2):e0244180.
doi: 10.1371/journal.pone.0244180. eCollection 2021.

Resting state EEG biomarkers of cognitive decline associated with Alzheimer's disease and mild cognitive impairment

Affiliations

Resting state EEG biomarkers of cognitive decline associated with Alzheimer's disease and mild cognitive impairment

Amir H Meghdadi et al. PLoS One. .

Abstract

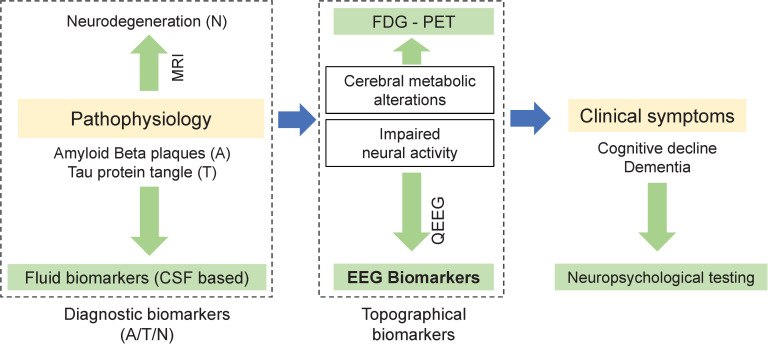
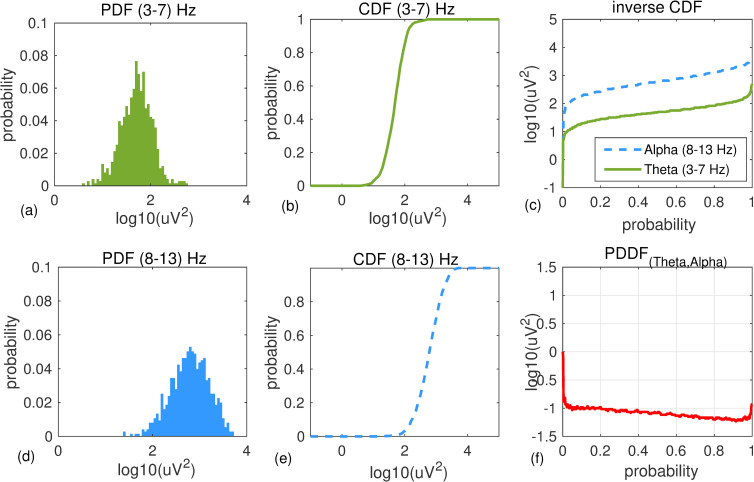
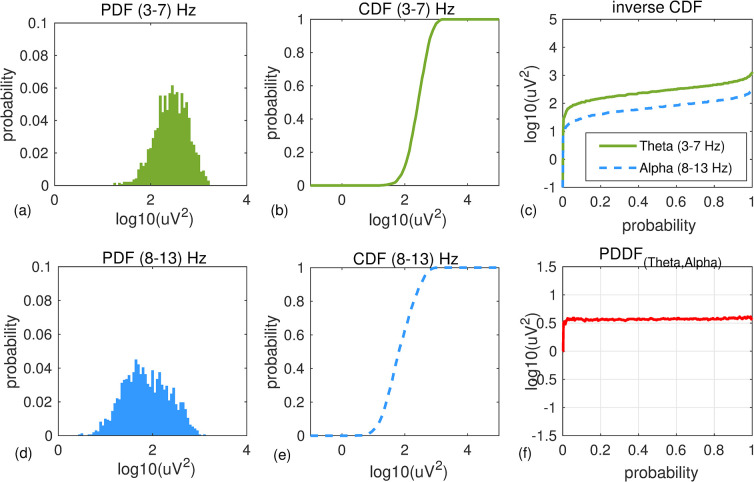
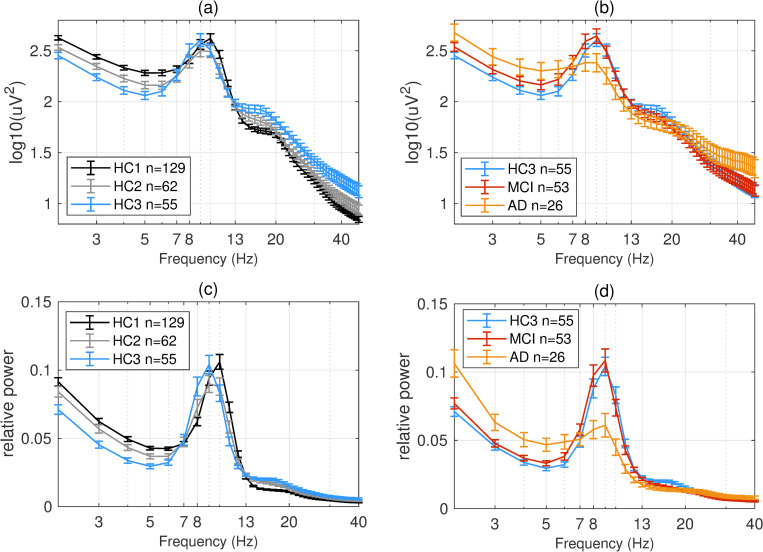
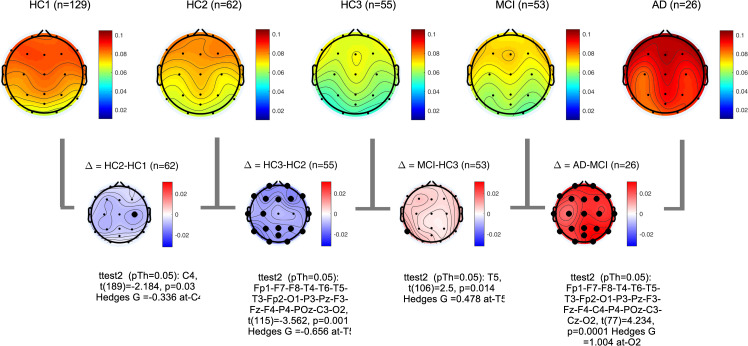
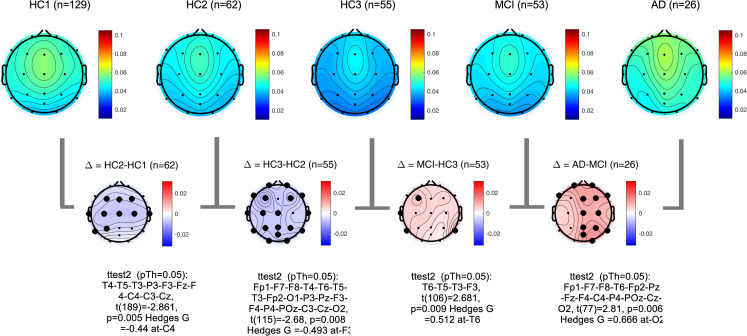
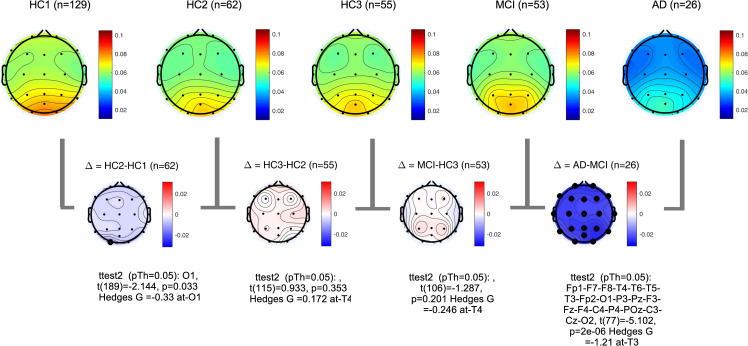
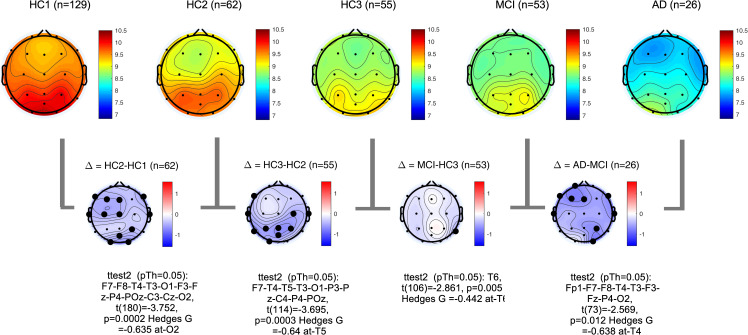
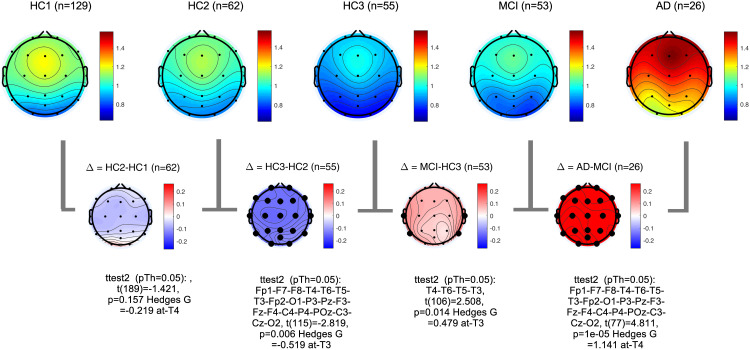
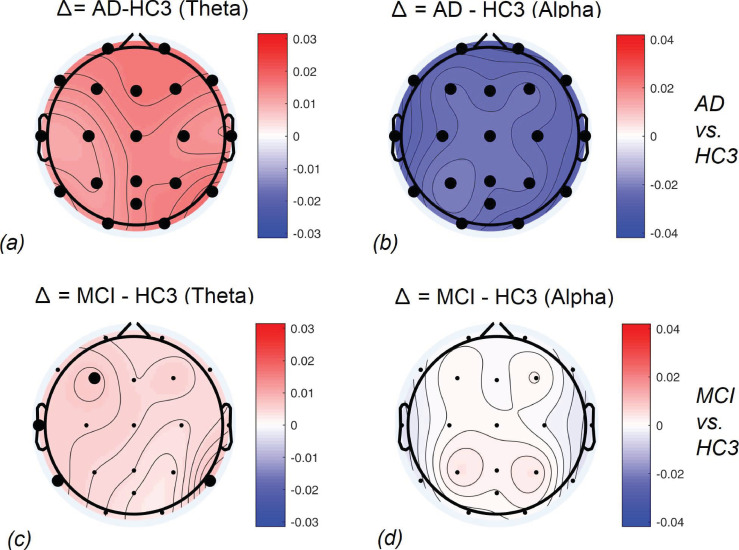
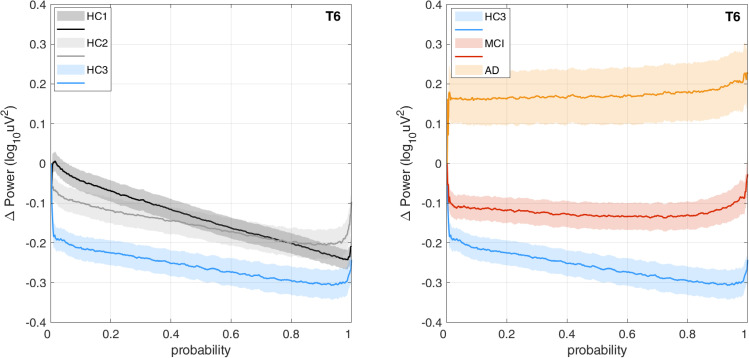
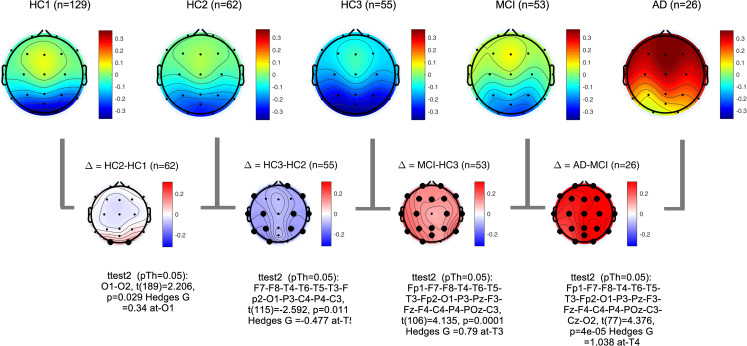
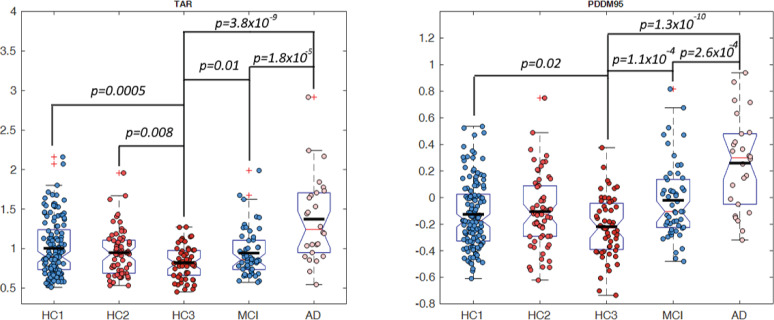
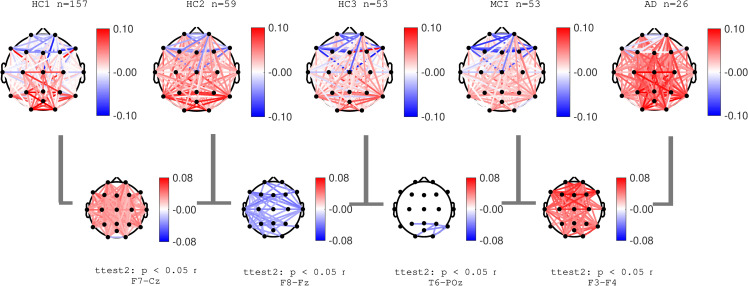
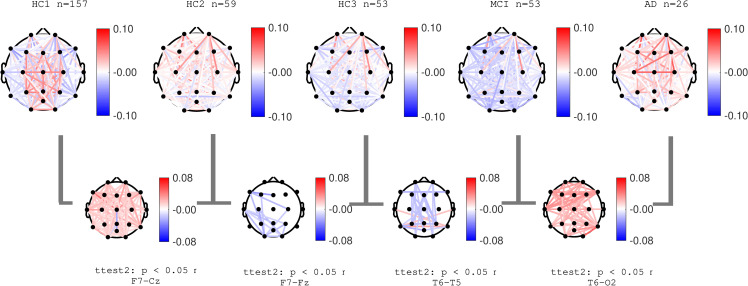
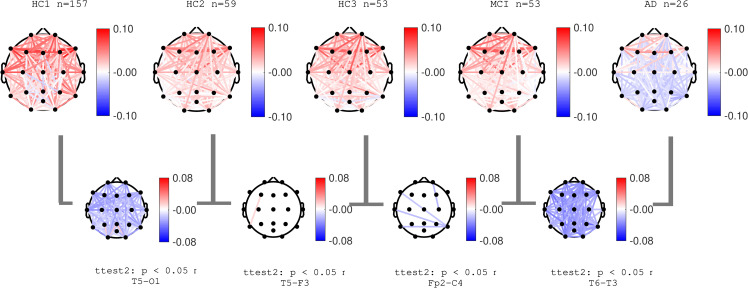
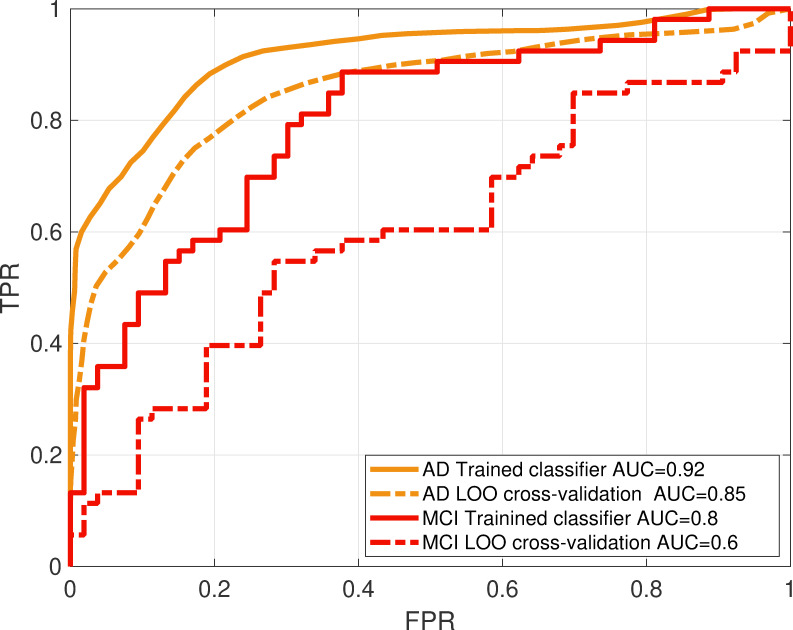
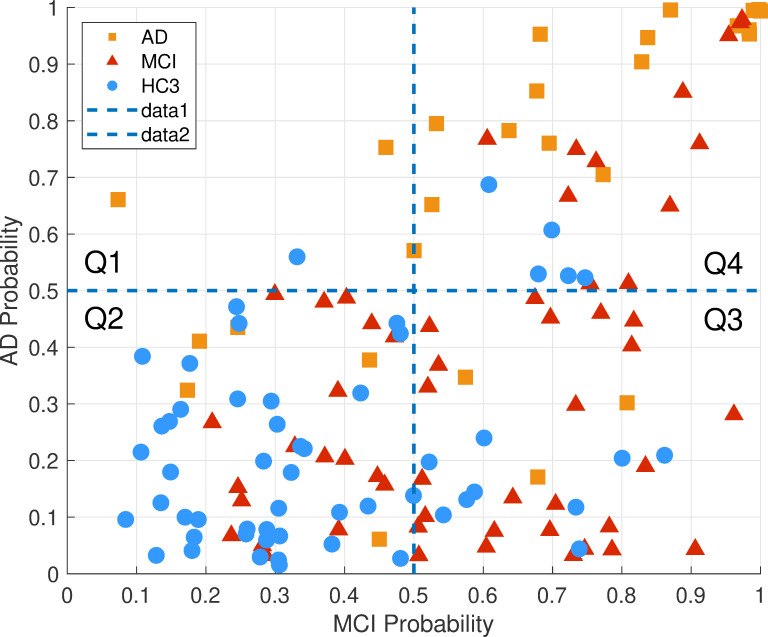
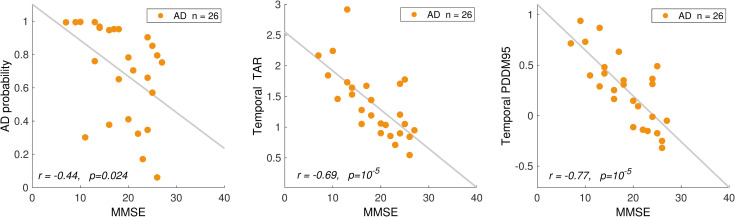
In this paper, we explore the utility of resting-state EEG measures as potential biomarkers for the detection and assessment of cognitive decline in mild cognitive impairment (MCI) and Alzheimer's disease (AD). Neurophysiological biomarkers of AD derived from EEG and FDG-PET, once characterized and validated, would expand the set of existing diagnostic molecular biomarkers of AD pathology with associated biomarkers of disease progression and neural dysfunction. Since symptoms of AD often begin to appear later in life, successful identification of EEG-based biomarkers must account for age-related neurophysiological changes that occur even in healthy individuals. To this end, we collected EEG data from individuals with AD (n = 26), MCI (n = 53), and cognitively normal healthy controls stratified by age into three groups: 18-40 (n = 129), 40-60 (n = 62) and 60-90 (= 55) years old. For each participant, we computed power spectral density at each channel and spectral coherence between pairs of channels. Compared to age matched controls, in the AD group, we found increases in both spectral power and coherence at the slower frequencies (Delta, Theta). A smaller but significant increase in power of slow frequencies was observed for the MCI group, localized to temporal areas. These effects on slow frequency spectral power opposed that of normal aging observed by a decrease in the power of slow frequencies in our control groups. The AD group showed a significant decrease in the spectral power and coherence in the Alpha band consistent with the same effect in normal aging. However, the MCI group did not show any significant change in the Alpha band. Overall, Theta to Alpha ratio (TAR) provided the largest and most significant differences between the AD group and controls. However, differences in the MCI group remained small and localized. We proposed a novel method to quantify these small differences between Theta and Alpha bands' power using empirically derived distributions of spectral power across the time domain as opposed to averaging power across time. We defined Power Distribution Distance Measure (PDDM) as a distance measure between probability distribution functions (pdf) of Theta and Alpha power. Compared to average TAR, using PDDF enhanced the statistical significance, the effect size, and the spatial distribution of significant effects in the MCI group. We designed classifiers for differentiating individual MCI and AD participants from age-matched controls. The classification performance measured by the area under ROC curve after cross-validation were AUC = 0.85 and AUC = 0.6, for AD and MCI classifiers, respectively. Posterior probability of AD, TAR, and the proposed PDDM measure were all significantly correlated with MMSE score and neuropsychological tests in the AD group.


Conflict of interest statement

AM, MSK, MM, GR, CR and CB are employees of Advanced Brain Monitoring. Chris Berka is co-founder and shareholder of Advanced Brain Monitoring. Advanced Brain Monitoring is a commercial medical device manufacturer specializing in the acquisition and analysis of EEG during wake and sleep. This does not alter our adherence to PLOS ONE policies on sharing data and materials.

Figures

Fig 1
Fig 1. EEG as a biomarker: While Diagnostic biomarkers of Alzheimer’s disease (left) are linked to pathophysiology, topographical biomarkers (middle) in general and EEG-biomarkers in particular, can be linked to impaired neural activities that are the basis of impaired cognitive processes.
Fig 2
Fig 2
An example of PDDF for a healthy participant: An example of PDF and CDF functions for Theta (a,b) and Alpha (d,e) bandwidths plotted for EEG data recorded at channel T6 from a healthy 71 year old male participant (MMSE score = 30). Overall, the participant has higher Alpha than Theta power. Inverse CDF functions and the PDDF function are shown in (c) and (f), respectively.
Fig 3
Fig 3
An example of PDDF for a participant with AD: An example of PDF and CDF functions for Theta (a,b) and Alpha (d,e) bandwidths plotted for EEG data recorded at channel T6 from a 74 year old female participant with AD (MMSE score = 18). Overall, the participant has higher Theta than Alpha power. Inverse CDF functions and the PDDF function are shown in (c) and (f), respectively.
Fig 4
Fig 4
Overall group average PSDs: Group averages of global (averaged across time and channel locations) absolute (a,b) and relative (c,d) PSDs for all participant groups. In healthy participants (a,c) older participant groups show lower power at low frequencies (1–7 Hz). In contrast, MCI and AD groups (b,d) show increased power in low frequencies compared to age matched controls (HC3). At high frequencies (>20 Hz) AD participants show increased absolute power in the same direction as normal aging albeit with larger effect size.
Fig 5
Fig 5. Topographical maps of Delta power: Group average topographical maps of Delta power (1–3 Hz) for all participant groups (top) and average group difference (bottom).
Channels with significant differences (p<0.05) are marked with black circles.
Fig 6
Fig 6. Topographical maps of Theta power: Group average topographical maps of Theta power (3–7 Hz) for all participant groups (top) and average group difference (bottom).
Channels with significant differences (p<0.05) are marked with black circles.
Fig 7
Fig 7. Topographical maps of Alpha power: Group average topographical maps of Alpha power (8–13 Hz) for all participant groups (top) and average group difference (bottom).
Channels with significant differences (p<0.05) are marked with black circles.
Fig 8
Fig 8. Topographical maps of Alpha peak frequency: Group average topographical maps of Alpha peak frequency for all participant groups (top) and average group difference (bottom).
Channels with significant differences (p<0.05) are marked with black circles.
Fig 9
Fig 9. Topographical maps of Theta to Alpha ratio (TAR): Group average topographical maps of TAR for all participant groups (top) and average group differences (bottom).
Channels with significant differences (p<0.05) are marked with black circles.
Fig 10
Fig 10. Topographical maps of the AD and MCI groups compared to controls: Differences between AD and HC3 (a,b) and MCI and HC3 (c,d) in Theta and Alpha bands.
significant differences are marked with black circles.
Fig 11
Fig 11. PDDF(Theta,Alpha) power distribution difference functions: Graphs of group average PDDF functions demonstrating the difference between Theta and Alpha band power distributions at channel T6 plotted for each participant group.
Solid lines represent group means and shaded areas show standard error of the means.
Fig 12
Fig 12
Topographical maps of PDDM0.95,1(Theta,Alpha): Group average topographical maps of PDDM for all participant groups (top) and average group differences (bottom). Channels with significant differences (p<0.05) are marked with black circles.
Fig 13
Fig 13. Group average TAR and PDDM95 at temporal areas: Group average of TAR (left) and PDDM (right) at temporal areas. Significant differences between groups were marked with the p-value of a two-sample t-test.
Fig 14
Fig 14. Topographical maps of Delta coherence: Topographical maps of normalized coherence in Delta band across pairs of channels in each participant groups.
Red (and blue) color represent higher (and lower) coherence compared to average across all frequencies.
Fig 15
Fig 15. Topographical maps of Theta coherence: Topographical maps of normalized coherence in Theta band across pairs of channels in each participant groups.
Red (and blue) color represent higher (and lower) coherence compared to average across all frequencies.
Fig 16
Fig 16. Topographical maps of Alpha coherence: Topographical maps of normalized coherence in Alpha band across pairs of channels in each participant groups.
Red (and blue) color represent higher (and lower) coherence compared to average across all frequencies.
Fig 17
Fig 17. Classifiers performance: ROC curves (plots of true positive versus false positive rates) for the AD and MCI classifiers show the performance of the classification when the classifier is tested on the training data (solid line) and tested after LOO cross validation (dotted lines).
The area under the curve (AUC) for each classifier shows the performance compared to chancel level (AUC = 0.5).
Fig 18
Fig 18. Classifiers between-group cross validation: The AD and MCI classifiers were tested on both the MCI and AD groups as well as the age matched HC3.
AD probability and MCI probability indicate the posterior probabilities of AD and MCI classifiers, respectively. The probability space is divided into 4 quartiles where Q2 is the quartile with little or no cognitive decline, Q3 is the quartile with possible mild cognitive decline and Q4 is the quartile with highest cognitive decline. The hypothetical trajectory of cognitive decline in this probability space is likely passing through Q2, Q3 and Q4.
Fig 19
Fig 19. Correlations with clinical scores.
Scatterplots showing correlations between MMSE score and (a) probability of AD in AD classifier, (b) TAR at temporal areas, (c) PDDM95 at temporal areas, plotted for all AD participants. PDDM95 has the highest correlation with MMSE.

References

    1. Ferri C. P. et al., “Global prevalence of dementia: a Delphi consensus study,” The Lancet, vol. 366, no. 9503, pp. 2112–2117, December 2005, 10.1016/S0140-6736(05)67889-0 - DOI - PMC - PubMed
    1. Nichols E. et al., “Global, regional, and national burden of Alzheimer’s disease and other dementias, 1990–2016: a systematic analysis for the Global Burden of Disease Study 2016,” Lancet Neurol., vol. 18, no. 1, pp. 88–106, January 2019, 10.1016/S1474-4422(18)30403-4 - DOI - PMC - PubMed
    1. Cummings J., Lee G., Ritter A., Sabbagh M., and Zhong K., “Alzheimer’s disease drug development pipeline: 2019,” Alzheimers Dement. Transl. Res. Clin. Interv., vol. 5, pp. 272–293, January 2019, 10.1016/j.trci.2019.05.008 - DOI - PMC - PubMed
    1. Jack C. R. et al., “Introduction to the recommendations from the National Institute on Aging-Alzheimer’s Association workgroups on diagnostic guidelines for Alzheimer’s disease,” Alzheimers Dement. J. Alzheimers Assoc., vol. 7, no. 3, pp. 257–262, May 2011, 10.1016/j.jalz.2011.03.004 - DOI - PMC - PubMed
    1. Sperling R. A. et al., “Toward defining the preclinical stages of Alzheimer’s disease: Recommendations from the National Institute on Aging-Alzheimer’s Association workgroups on diagnostic guidelines for Alzheimer’s disease,” Alzheimers Dement. J. Alzheimers Assoc., vol. 7, no. 3, pp. 280–292, May 2011, 10.1016/j.jalz.2011.03.003 - DOI - PMC - PubMed

Publication types