. 2021 Feb 5;17(2):e1008686.
doi: 10.1371/journal.pcbi.1008686. eCollection 2021 Feb.

SAveRUNNER: A network-based algorithm for drug repurposing and its application to COVID-19

Affiliations

SAveRUNNER: A network-based algorithm for drug repurposing and its application to COVID-19

Giulia Fiscon et al. PLoS Comput Biol. .

Abstract

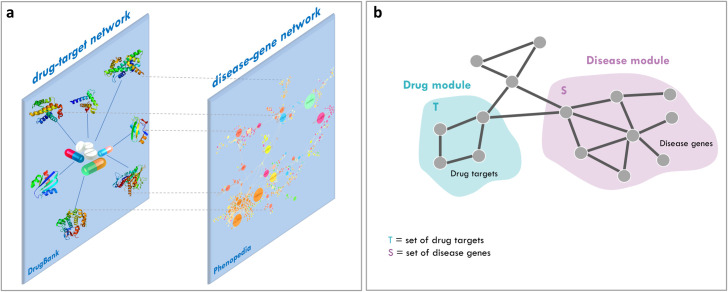
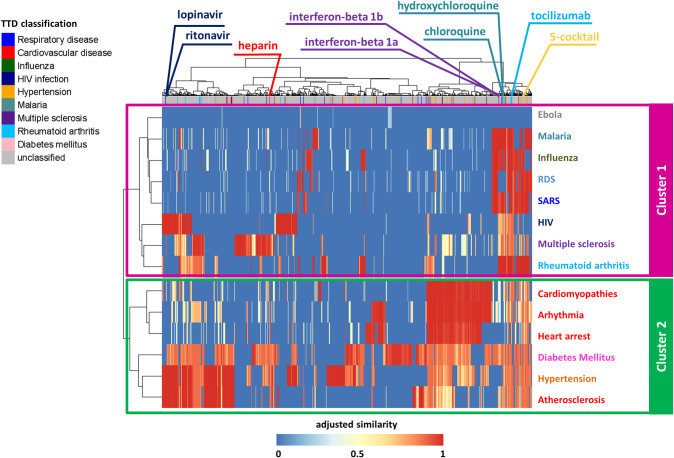
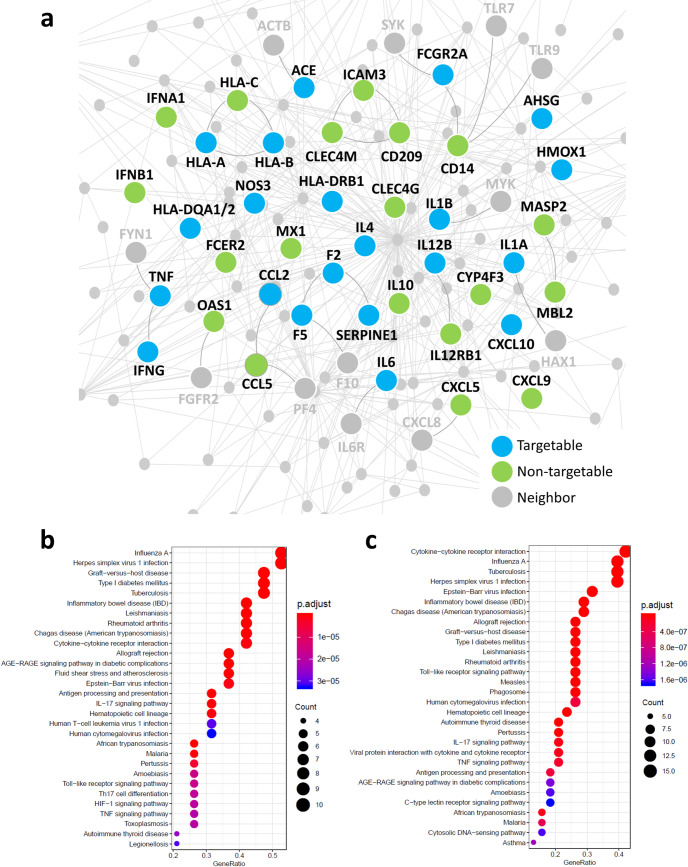
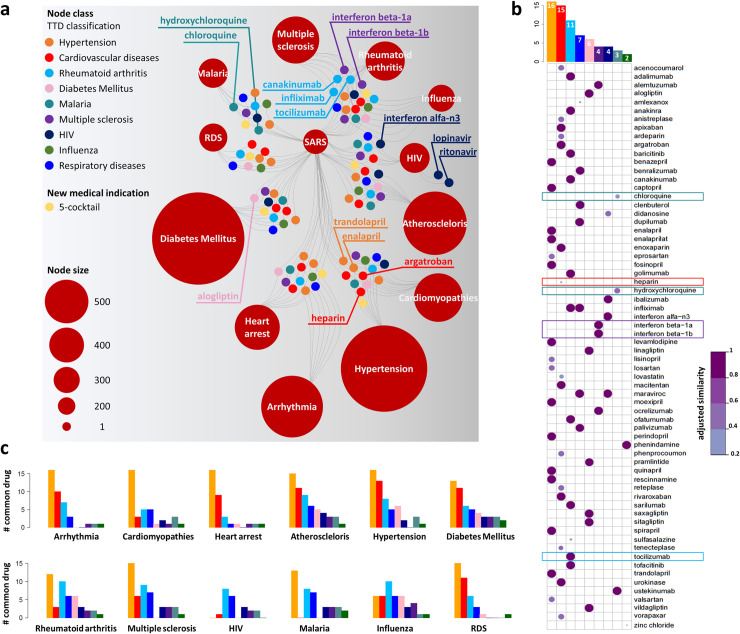
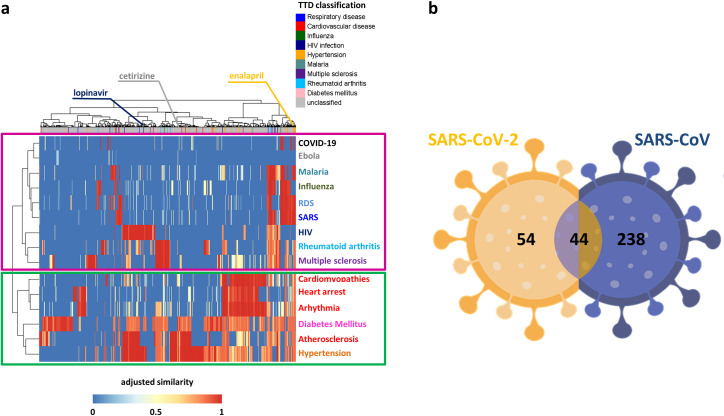
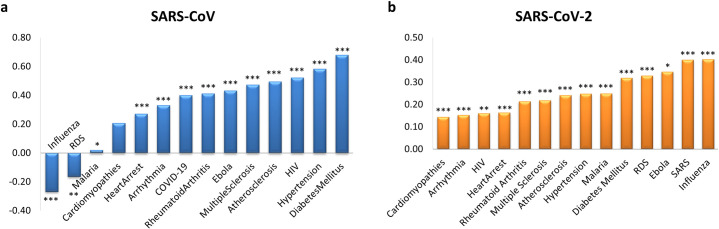
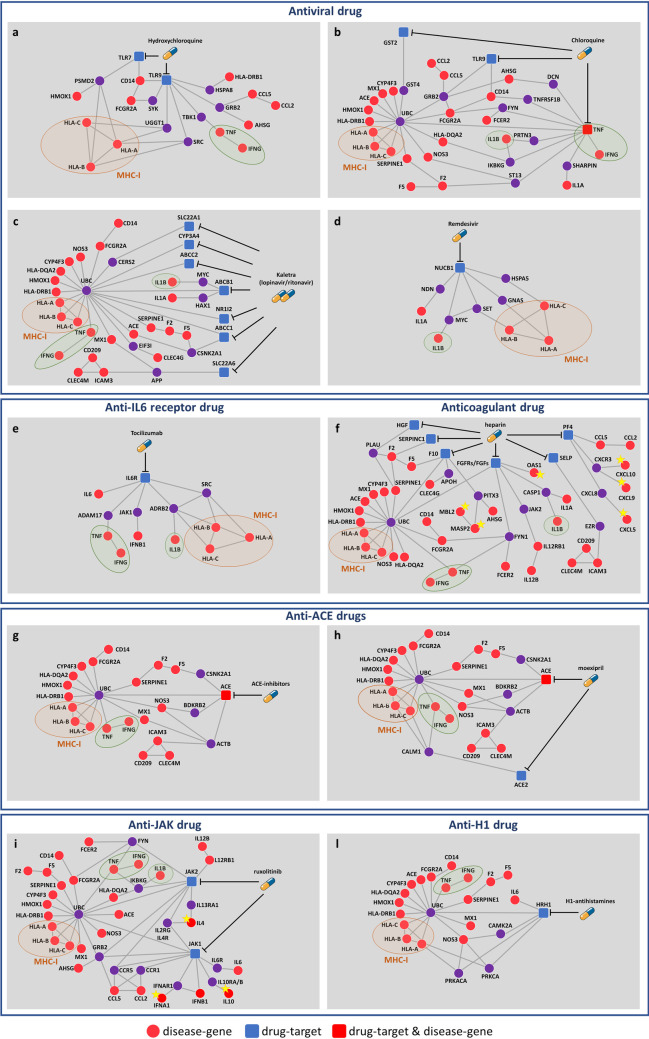
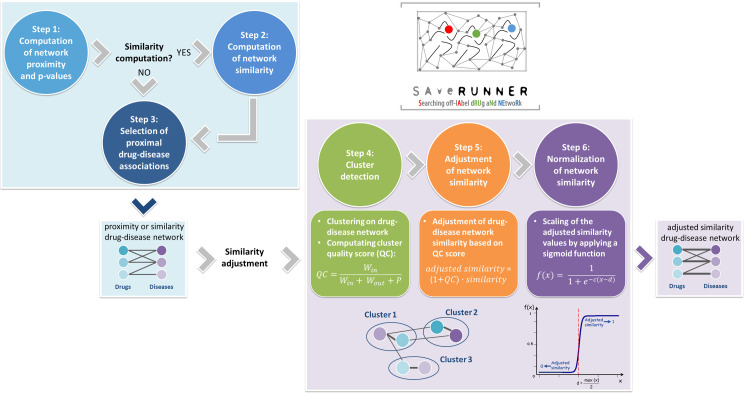
The novelty of new human coronavirus COVID-19/SARS-CoV-2 and the lack of effective drugs and vaccines gave rise to a wide variety of strategies employed to fight this worldwide pandemic. Many of these strategies rely on the repositioning of existing drugs that could shorten the time and reduce the cost compared to de novo drug discovery. In this study, we presented a new network-based algorithm for drug repositioning, called SAveRUNNER (Searching off-lAbel dRUg aNd NEtwoRk), which predicts drug-disease associations by quantifying the interplay between the drug targets and the disease-specific proteins in the human interactome via a novel network-based similarity measure that prioritizes associations between drugs and diseases locating in the same network neighborhoods. Specifically, we applied SAveRUNNER on a panel of 14 selected diseases with a consolidated knowledge about their disease-causing genes and that have been found to be related to COVID-19 for genetic similarity (i.e., SARS), comorbidity (e.g., cardiovascular diseases), or for their association to drugs tentatively repurposed to treat COVID-19 (e.g., malaria, HIV, rheumatoid arthritis). Focusing specifically on SARS subnetwork, we identified 282 repurposable drugs, including some the most rumored off-label drugs for COVID-19 treatments (e.g., chloroquine, hydroxychloroquine, tocilizumab, heparin), as well as a new combination therapy of 5 drugs (hydroxychloroquine, chloroquine, lopinavir, ritonavir, remdesivir), actually used in clinical practice. Furthermore, to maximize the efficiency of putative downstream validation experiments, we prioritized 24 potential anti-SARS-CoV repurposable drugs based on their network-based similarity values. These top-ranked drugs include ACE-inhibitors, monoclonal antibodies (e.g., anti-IFNγ, anti-TNFα, anti-IL12, anti-IL1β, anti-IL6), and thrombin inhibitors. Finally, our findings were in-silico validated by performing a gene set enrichment analysis, which confirmed that most of the network-predicted repurposable drugs may have a potential treatment effect against human coronavirus infections.


Conflict of interest statement

The authors have declared that no competing interests exist.

Figures

Fig 1
Fig 1. Schematic representation of SAveRUNNER inputs and working hypothesis.
(A) Inputs. SAveRUNNER takes as input the list of drug targets downloaded from DrugBank database and the list of disease genes downloaded from Phenopedia database. These lists can be represented as networks: (i) a drug–target network, within which nodes are drugs and target proteins, linked if the protein is a known target of the drug; and (ii) a disease-gene network, within which nodes are diseases and genes, linked if the gene has been associated to the disease. (B) Working hypothesis. Potential candidate repurposable drugs for a given disease should have target proteins (drug module T) within or in the immediate vicinity of the disease module S.
Fig 2
Fig 2. Dendrogram and heatmap of the drug-disease network.
The network adjusted similarity values are clustered according to rows (diseases) and columns (drugs) by a complete linkage hierarchical clustering algorithm and by using the Euclidean distance as distance metric. Heatmap color key denotes the adjusted and normalized network similarity between drug targets and disease genes in the human interactome, increasing from blue (less similar) to red (more similar). Drugs are colored according to the Therapeutic Target Database (TTD) indications listed in legend. Unclassified tag was assigned to those drugs for which a known therapeutic indication was not available in TTD or their indication does not fall in our analyzed disorders.
Fig 3
Fig 3. SARS-CoV-host interactome.
(A) The SARS-CoV-associated disease genes subnetwork in the human interactome. Light blue nodes represent SARS-CoV-associated proteins that can be directly targeted by at least one FDA-approved drugs (targetable); green nodes represent SARS-CoV-associated proteins that do not have any known ligands and then cannot be directly targeted by drugs (non-targetable); grey nodes represent interaction partners of SARS-CoV-associated proteins in the human interactome (neighbor). (B-C) KEGG human pathway enrichment analysis for SARS-CoV-associated disease genes. The dot plots of the top 30 enriched KEGG pathways (p-value ≤ 0.05) obtained for the 21 targetable SARS-CoV-associated disease genes (B) and for the total 41 SARS-CoV-associated disease genes (C). The y-axis reports the annotation categories (KEGG pathways) and the x-axis reports the gene ratio (i.e., the number of genes found enriched in each category over the number of total genes associated to that category). The color of the dots represents the adjusted p-values (FDR), whereas the size of the dots represents the number of genes found enriched in each category.
Fig 4
Fig 4. The predicted SARS drug-disease network.
(A) Schematic representation of the SARS predicted drug-disease network. This sketch shows the high-confidence predicted drug-disease associations connecting SARS and other analyzed diseases (red circles) with the 66 FDA-approved non-SARS drugs or the new proposed medical indication (i.e., 5-cocktail). Drugs are colored according to TTD classification reported in the legend, or according to the new proposed medical indication (i.e., 5-cocktail). The node size scales indicate the degree (connectivity) of nodes in the predicted drug-disease network. Labeled drug nodes represent either drugs more proximal to SARS or drugs being currently explored as COVID-19 treatment. (B) Similarity plot. Network-predicted repurposable drugs for SARS (along rows) with their TTD classification (along columns). In the plot, circles are scaled and colored according to the adjusted similarity measure, increasing from light purple (low similarity) to dark purple (high similarity). The barplot placed on the top reports the total number of candidate repurposable drugs for SARS grouped and colored according to the TTD classification reported in the legend (Node class). (C) Common drugs between SARS and other diseases. For each analyzed disease, the barplot reports the total number of drugs shared with SARS grouped and colored according to the TTD classification reported in the legend (Node class).
Fig 5
Fig 5. Candidate repurposable drugs for SARS-CoV-2.
(A) Heatmap and dendrogram of SARS-CoV-2 drug-disease network. The network adjusted similarity values are clustered according to rows (diseases) and columns (drugs) by a complete linkage hierarchical clustering algorithm and by using the Euclidean distance as distance metric. Heatmap color key denotes the adjusted similarity between drug targets and disease genes in the human interactome, increasing from blue (less similar) to red (more similar). Drugs are colored according to the Therapeutic Target Database (TTD) indications listed in legend. Unclassified tag was assigned to those drugs for which a known therapeutic indication was not available in TTD or their indication does not fall in our analyzed disorders. (B) SARS-CoV-2 versus SARS-CoV. Venn diagram detailing the number of common and specific candidate repurposable drugs predicted by SAveRUNNER for SARS-CoV-2 and SARS-CoV infections.
Fig 6
Fig 6. Disease comorbidity.
The bar plots show the values of the non-Euclidean separation distance computed for the SARS-CoV (a) and SARS-CoV-2 (b) disease module with respect to all the other disease modules analyzed in this study. We applied a degree-preserving randomization procedure to assess the statistical significance of each separation value, and we calculated all p-values by applying a two-tailed z test. The stars flag levels of significance for three of the most commonly used levels: p-value < 0.05 is flagged with one star (*); p-value < 0.01 is flagged with two stars (**); and p-value < 0.001 is flagged with three stars (***).
Fig 7
Fig 7. Mechanism-of-action of anti-SARS-CoV repurposable drugs.
The subnetworks show the inferred mechanism-of-action for: antiviral drugs (A-D), tocilizumab (E), heparin (F), ACE-inhibitors (G-H), ruxolitinib (I), and H1-antistamines (L). Each subnetwork was designed to point out the shortest paths from drug targets and SARS disease genes in the human interactome. In each subnetwork, disease genes specifically targeted by each drug are marked with a yellow star; major histocompatibility complex of class I (MCH-I) and pro-inflammatory cytokines shared by all drug networks are marked with an orange and a green circle, respectively. Legend: red circles refer to SARS disease genes, blue squares refer to drug targets, red squares refer to SARS disease genes that are also drug targets, violet circles refer to the first nearest neighbors (that are not disease genes) of the drug targets in the human interactome. Anti-ACE drugs of panel (G) refer to enalapril, trandolapril, fosinopril, benazepril, cilazapril, zofenopril, spirapril, rescinnamine, and quinapril. H1-anistamines of panel (L) refer to fexofenadine, levocetirizine, desloratadine, clemastine, cetirizine.
Fig 8
Fig 8. SAveRUNNER algorithm.
SAveRUNNER encompasses six steps: (1–3) compute a weighted bipartite drug-disease network, where nodes are both drugs and diseases, edges are proximal drug-disease associations (z-score proximity ≤ selected threshold), and weights are either the proximity or similarity measure; (4–6) compute the normalized adjusted similarity measure to correct the weights of the drug-disease network and to prioritize the predicted drug-disease associations. Legend: QC is the quality cluster score; Win is the total weight of edges within each cluster; Wout is the total weight of edges connecting each cluster to the rest of network; P is the node density within each cluster; c and d parameters are the sigmoid steepness and midpoint, respectively.
Fig 9
Fig 9. BiRW-based algorithm.
Schematic representation of the construction of input matrices (A) and predicted drug-disease associations network (B).

References

    1. Gorbalenya AE, Baker SC, Baric RS, de Groot RJ, Drosten C, Gulyaeva AA, et al. The species Severe acute respiratory syndrome-related coronavirus: classifying 2019-nCoV and naming it SARS-CoV-2. Nat Microbiol. 2020. April;5(4):536–44. 10.1038/s41564-020-0695-z - DOI - PMC - PubMed
    1. Tang X, Wu C, Li X, Song Y, Yao X, Wu X, et al. On the origin and continuing evolution of SARS-CoV-2. Natl Sci Rev [Internet]. [cited 2020 Mar 19]; Available from: https://academic.oup.com/nsr/advance-article/doi/10.1093/nsr/nwaa036/577.... - DOI - PMC - PubMed
    1. Raoult D, Zumla A, Locatelli F, Ippolito G, Kroemer G. Coronavirus infections: Epidemiological, clinical and immunological features and hypotheses. Cell Stress [Internet]. 2020. March 2 [cited 2020 Apr 6]; Available from: https://www.ncbi.nlm.nih.gov/pmc/articles/PMC7064018/ 10.15698/cst2020.04.216 - DOI - PMC - PubMed
    1. Coronavirus COVID-19 (2019-nCoV) [Internet]. [cited 2020 Mar 19]. Available from: https://gisanddata.maps.arcgis.com/apps/opsdashboard/index.html#/bda7594....
    1. El-Sadr WM, Justman J. Africa in the Path of Covid-19. N Engl J Med. 2020. April 17;0(0):null. 10.1056/NEJMp2008193 - DOI - PubMed

Publication types

MeSH terms

Substances

LinkOut - more resources