. 2021 Feb 5;17(2):e1009304.
doi: 10.1371/journal.ppat.1009304. eCollection 2021 Feb.

Distinct clonal lineages and within-host diversification shape invasive Staphylococcus epidermidis populations

Affiliations

Distinct clonal lineages and within-host diversification shape invasive Staphylococcus epidermidis populations

Anna Both et al. PLoS Pathog. .

Abstract

S. epidermidis is a substantial component of the human skin microbiota, but also one of the major causes of nosocomial infection in the context of implanted medical devices. We here aimed to advance the understanding of S. epidermidis genotypes and phenotypes conducive to infection establishment. Furthermore, we investigate the adaptation of individual clonal lines to the infection lifestyle based on the detailed analysis of individual S. epidermidis populations of 23 patients suffering from prosthetic joint infection. Analysis of invasive and colonizing S. epidermidis provided evidence that invasive S. epidermidis are characterized by infection-supporting phenotypes (e.g. increased biofilm formation, growth in nutrient poor media and antibiotic resistance), as well as specific genetic traits. The discriminating gene loci were almost exclusively assigned to the mobilome. Here, in addition to IS256 and SCCmec, chromosomally integrated phages was identified for the first time. These phenotypic and genotypic features were more likely present in isolates belonging to sequence type (ST) 2. By comparing seven patient-matched nasal and invasive S. epidermidis isolates belonging to identical genetic lineages, infection-associated phenotypic and genotypic changes were documented. Besides increased biofilm production, the invasive isolates were characterized by better growth in nutrient-poor media and reduced hemolysis. By examining several colonies grown in parallel from each infection, evidence for genetic within-host population heterogeneity was obtained. Importantly, subpopulations carrying IS insertions in agrC, mutations in the acetate kinase (AckA) and deletions in the SCCmec element emerged in several infections. In summary, these results shed light on the multifactorial processes of infection adaptation and demonstrate how S. epidermidis is able to flexibly repurpose and edit factors important for colonization to facilitate survival in hostile infection environments.


Conflict of interest statement

The authors have declared that no competing interests exist.

Figures

Fig 1
Fig 1. Overview of sampling procedure at the example of one individual patient.
(1) For comparison of phenotypes and genotypes of infection and commensal isolates. Phenotypic values for INF isolates are aggregated measured values of all picked colonies from each infection, thus resulting in one representative INF isolate per infection. These INF isolates (n = 23) were compared to nCloNo isolates to identify systematic differences between infection-associated and commensal S. epidermidis isolates. (2) INF colonies were compared to CloNo colonies (PFGE-identical to the same patient’s INF colonies) in order to identify differences in phenotype and genotype between PFGE-identical isolates derived from commensal and infection niches. (3) All INF colonies (n = 2–12 per infection) from each infection were analysed for phenotypic and genotypic diversification within the infection.
Fig 2
Fig 2. Phenotypes of INF isolates and nCloNo isolates.
Heat map of all continuous phenotypes tested in this study. Values for INF isolates are aggregated measured values of all picked colonies from each infection. Phenotypes in columns are rescaled by column. Each row represents one isolate. Columns represent phenotypes: Biofilm formation in TSB (log10-transformed), hemolysis (Hemo, extinction of free haemoglobin after incubation of 2% sheep erythrocytes with overnight culture supernatants), growth curve AUCs in TSB (AUC TSB, 22h static incubation, OD600 measurement every 30min), growth curve AUCs 70% human serum in PBS (AUC 70% hS, same conditions, log10-transformed), growth curve AUCs RPMI (AUC RPMI, log10-transformed), growth curve AUCs in synthetic nose media (AUC SNM3), minimal inhibitory concentrations (MIC) of oxacillin (MIC OXA), rifampicin (MIC RIF), gentamicin (MIC GMC), vancomycin (MIC VAN) and daptomycin (MIC DAP) Levels of significance indicated by *(p≤0.05), **(p≤0.01), *** (p≤0.001). Significance testing by Student’s t-test for biofilm formation hemolysis and growth (areas under the curve, AUC), significance testing of susceptibility testing data by categories (susceptible vs. resistant) by Pearson’s Chi-square.
Fig 3
Fig 3
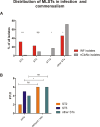
(A) Distribution of Multilocus Sequence Types (MLSTs) in INF isolates and nCloNo isolates. Red bars (INF isolates) and grey bars (nCloNo isolates) represent the proportion of indicated sequence type in invasive and commensal isolates, respectively. (B) Distribution of STs in early and delayed/late PJI. ST2 is represented by an orange, ST5 by a blue and all other STs by a green bar. Early infections: occurrence within 0–3 months after surgery, delayed/late infections: occurrence >3 months after surgery. Levels of significance indicated by *(p≤0.05), **(p≤0.01), ***(p≤0.001).
Fig 4
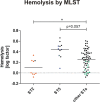
Fig 4. Hemolytic activity in different S. epidermidis STs.
Overnight culture supernatants from ST2 (INF isolates in orange, n = 8. nCloNo isolates in black, n = 1), ST5 (INF isolates in blue, n = 5. nCloNo isolates in black, n = 6) and all other STs (INF isolates in green, n = 10. nCloNo isolates in black, n = 56) were investigated for hemolytic activity (lysis of sheep erythrocytes [2%]), and results were analysed with Student’s t-test. For INF isolates aggregated values of all colonies per one infection were used.
Fig 5
Fig 5. Overview of ORF-based and k-mer-based genome-wide association study of colonizing and PJI-associated S. epidermidis isolates.
GenBank accession numbers for all isolates, S3 Table.
Fig 6
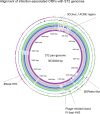
Fig 6. Alignment of infection-associated genes against ST2 pan-genome.
From innermost circle to outermost: HD05 (purple), HD12 (lime), HD21 (pink), HD25 (light blue), HD31 (dark blue), HD46 (blue), HD47 (yellow), HD99 (turquois) and significantly associated genes (green). GC-content (black), GC-skew (+) green, GC-skew (-) purple.
Fig 7
Fig 7. Performance parameters of k-mer-based prediction model.
(A) Receiver operating characteristic curve (ROC-curve) of the final model including 96 k-mers associated with either infection or colonization. (B) Performance characteristics of the prediction model on the primary dataset and on the validation dataset from a previous study. Performance on infection isolates from this study (INF isolates) in red, performance on commensal isolates from this study (nCloNo isolates) in dark grey, performance on validation dataset in light red (infection isolates) and light grey (commensal isolates). Precision = (#True positive)/(#True positive + #False positive)(positive predictive value); recall = (#True positive)/(#True positive + #False negative)(sensitivity); f1-score = 2 * precision * recall / (precision + recall).
Fig 8
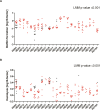
Fig 8. Distribution of biofilm phenotypes and hemolytic activity in invasive and commensal S. epidermidis populations metric variables (y-axis), sorted by patient (x-axis).
Metric values were log transformed to attain symmetric distribution (indicated on y-axis label). Each dot represents one isolate. INF isolates are coloured in red, CloNo isolates are coloured in black. (A) Distribution of quantitative biofilm phenotypes produced in TSB. Plotted dots are means of biological duplicates. (B) Hemolysis of a 2% solution of sheep erythrocytes by supernatants of overnight cultures. Factor: extinction of free haemoglobin at 541nm in samples, normalized to hemolysis of only TSB. Plotted dots are means of biological triplicates.
Fig 9
Fig 9. Distribution of Oxacillin MICs as determined by gradient test, sorted by patient (x-axis).
INF isolates are coloured in red, CloNo isolates are coloured in black. Red arrows indicate cases with partial SCCmec deletions in a subpopulation. White arrows indicate cases where heterogeneity in PBP2A expression led to miscategorisation as susceptible in a subpopulation.
Fig 10
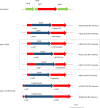
Fig 10. Gene map of deletion sites in the SCCmec element identified in S. epidermidis infection isolates.
Elements were reconstructed based on hybrid assembly of MinIon and Illumina reads. (A) Patient HD33 (B) patient HD66, and (C) patient HD99. The 38kb fragment on the right contained a ccrC recombinase around 20kb downstream of the ccrA3B3 operon. Each upper panel represents organization in respective isolates with complete SCCmec, lower panel shows organization with deletion. Green, mec gene complex; dark blue, recombinases; light blue annotated loci; white, hypothetical proteins; dark red, cadmium resistance operon; brown, mercury resistance operon; beige, copper resistance operon.
Fig 11
Fig 11. Gene map of deletion site in the ACME element in infection isolate from patient HD26.
Elements were reconstructed based on hybrid assembly of MinIon and Illumina reads. Upper panel shows organization in S. epidermidis isolate with a complete ACME element, lower panel shows organisation after deletion event. Dark blue, recombinases; light blue annotated loci; white, hypothetical proteins; light green, kdp operon; red, arginine catabolism operon; yellow, oligopeptide permease ABC transporter opp3 operon; brown, CRISPR-Cas locus; purple, arsenic resistance operon.
Fig 12
Fig 12. Gene map of IS insertions in agrC.
Nucleotide numbering (*) according to reference sequence F1613_11135 from S. epidermidis ATCC 12228. Red, agrC and its fragments; dark blue, insertion sequences; light green, remaining agr operon. + sequences identify duplications at insertion site of IS256.
Fig 13
Fig 13. Schematic view of AckA protein.
Sites important for enzymatic function as annotated by UniProt in yellow, annotation below. Variants are color-coded according to patient: HD15 purple [ST212], HD33 brown [ST87], HD39 light green [ST297], HD43 dark green [ST23], HD46 red [ST2], HD75 light blue [ST984] and HD99 dark red [ST2]. Reference AckA sequence from S. epidermidis ATCC 12228.
Fig 14
Fig 14. Volcano plot of RNA-Seq of all isolates in 50% human serum versus TSB after 6h of growth.
Red dots signify genes with log2-fold-changes ≥2, and a Benjamini-Hochberg procedure adjusted p-value ≥0.05. Blue dots are genes with adjusted p-value ≥0.05, green dots are genes with log2-fold-changes ≥2. Genes represented by grey dots fulfil neither condition.

References

    1. Kloos WE, Musselwhite MS. Distribution and Persistence of Staphylococcus and Micrococcus Species and Other Aerobic Bacteria on Human Skin1. Appl Microbiol. 1975;30: 381–395. 10.1128/aem.30.3.381–395.1975 - DOI - PMC - PubMed
    1. Wisplinghoff H, Bischoff T, Tallent SM, Seifert H, Wenzel RP, Edmond MB. Nosocomial bloodstream infections in US hospitals: Analysis of 24,179 cases from a prospective nationwide surveillance study. Clin Infect Dis. 2004;39: 309–317. 10.1086/421946 - DOI - PubMed
    1. Kurtz SM, Lau E, Watson H, Schmier JK, Parvizi J. Economic Burden of Periprosthetic Joint Infection in the United States. J Arthroplasty. 2012;27: 61–65.e1. 10.1016/j.arth.2012.02.022 - DOI - PubMed
    1. Tande AJ, Patel R. Prosthetic joint infection. Clin Microbiol Rev. 2014;27: 302–45. 10.1128/CMR.00111-13 - DOI - PMC - PubMed
    1. Flurin L, Greenwood-Quaintance KE, Patel R. Microbiology of polymicrobial prosthetic joint infection. Diagn Microbiol Infect Dis. 2019;94: 255–259. 10.1016/j.diagmicrobio.2019.01.006 - DOI - PubMed

Publication types

MeSH terms

Substances