. 2021 Feb 26;49(4):2085-2101.
doi: 10.1093/nar/gkaa1292.

MazF toxin causes alterations in Staphylococcus aureus transcriptome, translatome and proteome that underlie bacterial dormancy

Affiliations

MazF toxin causes alterations in Staphylococcus aureus transcriptome, translatome and proteome that underlie bacterial dormancy

Fedor Bezrukov et al. Nucleic Acids Res. .

Abstract

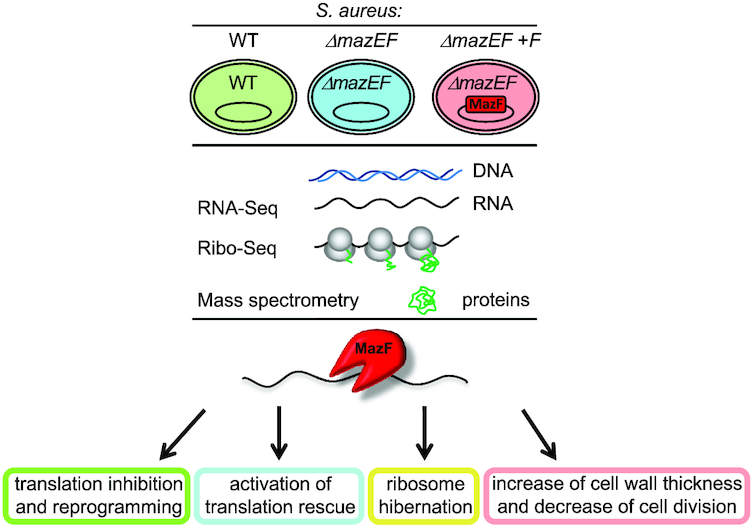
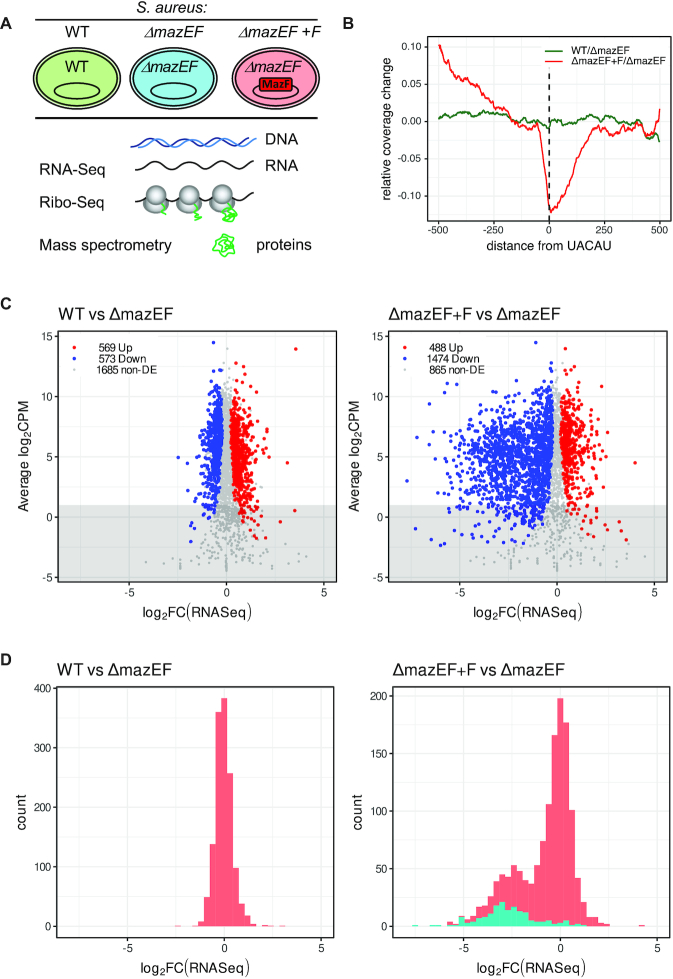
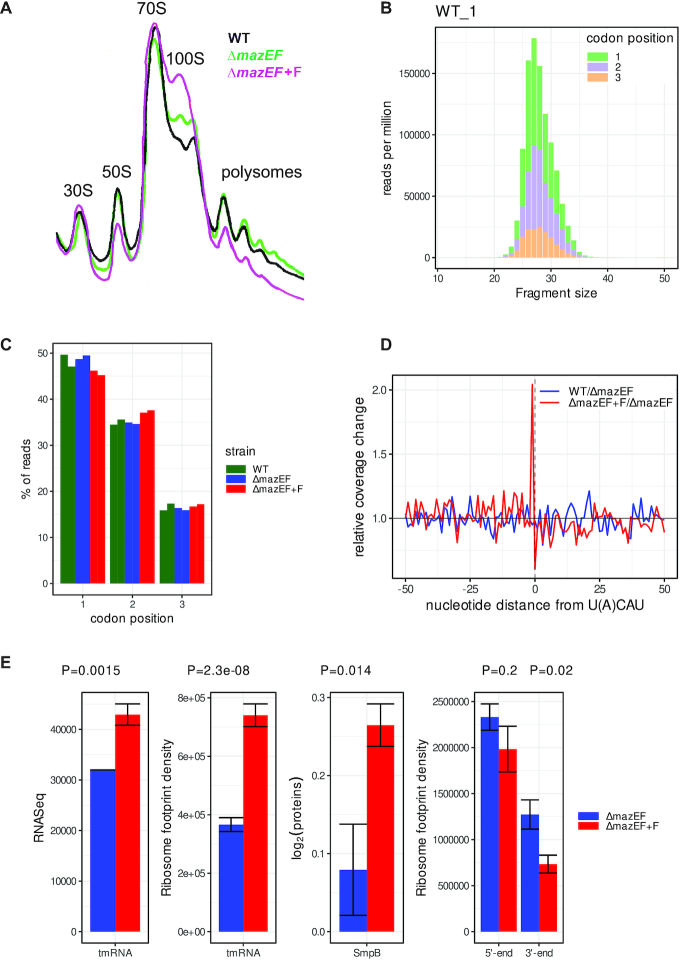
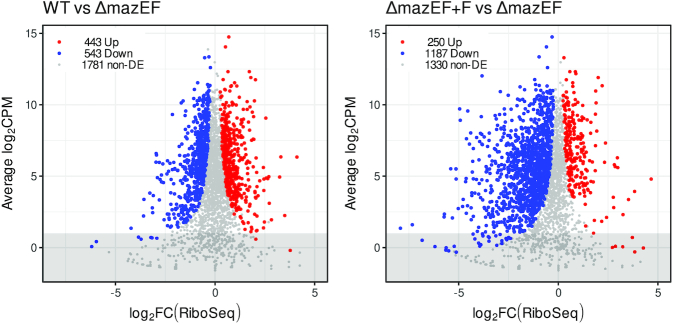
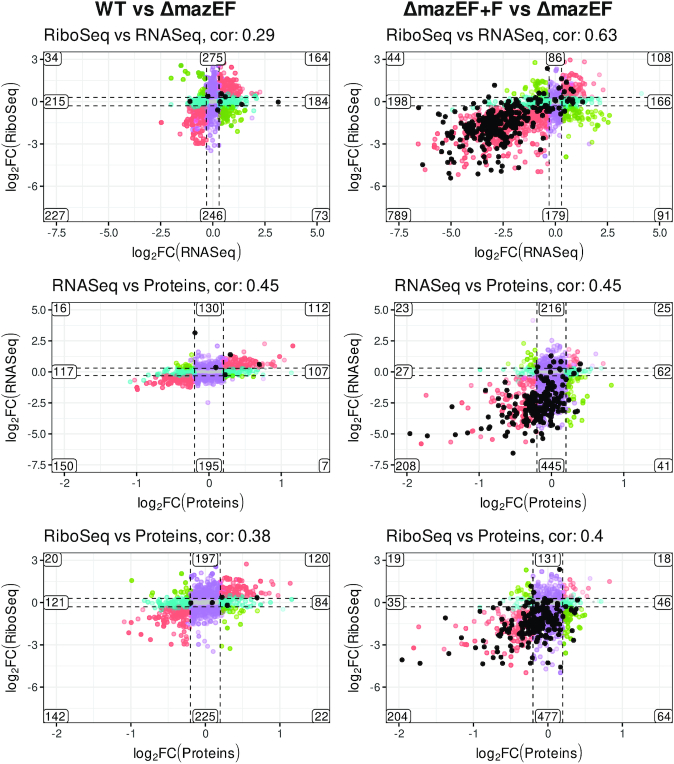
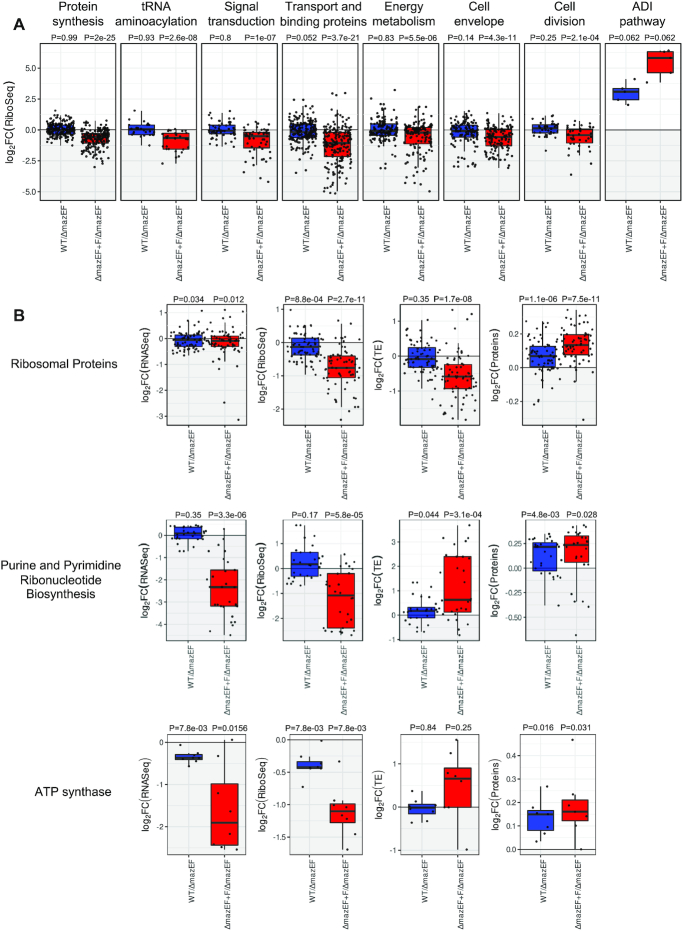
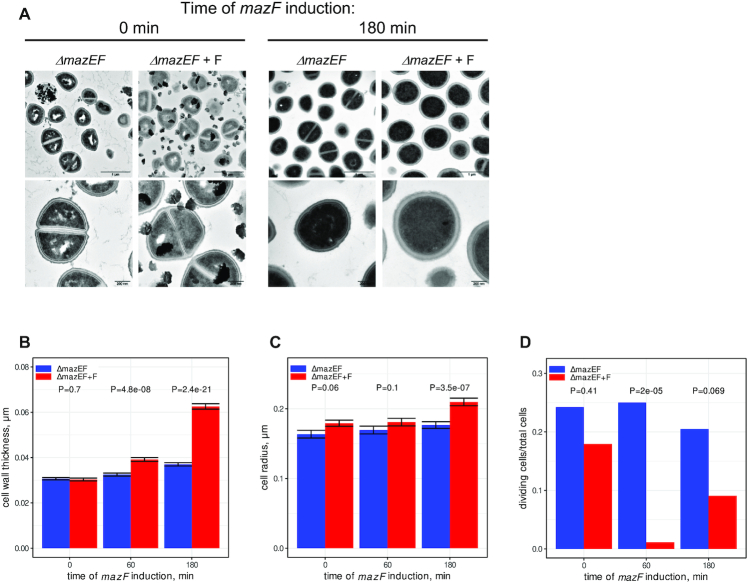
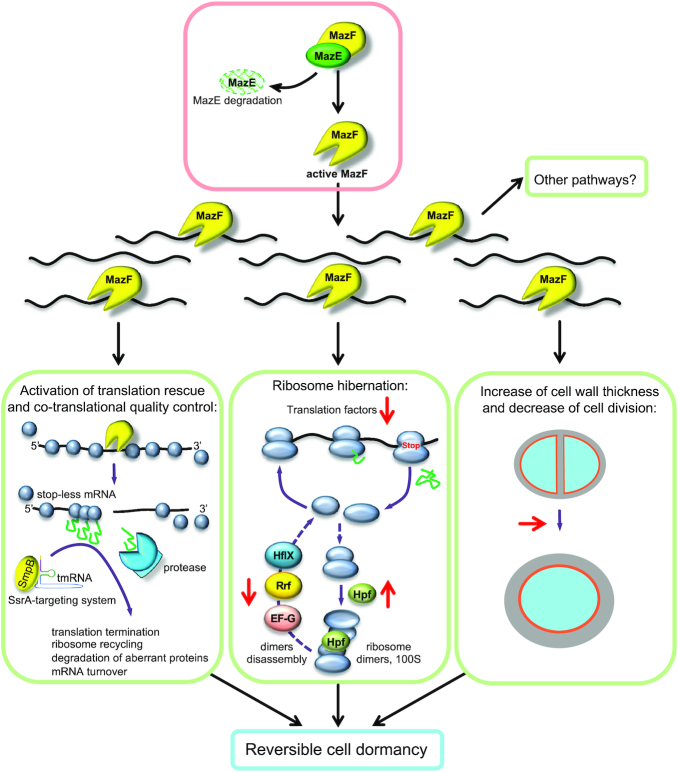
Antibiotic resistance is a serious problem which may be caused by bacterial dormancy. It has been suggested that bacterial toxin-antitoxin systems induce dormancy. We analyzed the genome-wide role of Staphylococcus aureus endoribonuclease toxin MazF using RNA-Seq, Ribo-Seq and quantitative proteomics. We characterized changes in transcriptome, translatome and proteome caused by MazF, and proposed that MazF decreases translation directly by cleaving mRNAs, and indirectly, by decreasing translation factors and by promoting ribosome hibernation. Important pathways affected during the early stage of MazF induction were identified: MazF increases cell wall thickness and decreases cell division; MazF activates SsrA-system which rescues stalled ribosomes, appearing as a result of MazF mRNA cleavage. These pathways may be promising targets for new antibacterial drugs that prevent bacteria dormancy. Finally, we described the overall impact of MazF on S. aureus cell physiology, and propose one of the mechanisms by which MazF might regulate cellular changes leading to dormancy.


Figures

Graphical Abstract
Graphical Abstract
MazF toxin causes alterations in Staphylococcus aureus transcriptome, translatome and proteome that underlie bacterial dormancy.
Figure 1.
Figure 1.
Analysis of transcriptome by RNA-Seq after mazF induction. (A) Experimental design. S. aureus wild type (WT) cells or cells deleted for mazEF (ΔmazEF), were transformed with an empty vector or a vector carrying inducible mazF (ΔmazEF+F). Cells were collected after 10 min of mazF induction when MazF protein had been produced, but cell growth was not yet inhibited (15,23), and analyzed by RNA-Seq, Ribo-Seq and quantitative mass spectrometry. (B) MazF expression leads to mRNA cleavage on UACAU on genome-wide level. Comparison of RNA-Seq coverage 500 nt before and after UACAU sequences: WT to ΔmazEF (green) and ΔmazEF+F to ΔmazEF (red). (C) log2-fold change (log-FC) in RNA levels of WT compared to ΔmazEF (left) and of ΔmazEF+F compared to ΔmazEF (right). RNA-Seq is expressed in counts per million reads (CPM). Upregulated genes (P < 0.05), downregulated genes (P < 0.05) and non-differentially expressed genes (non-DE) (P > 0.05) are marked in red, blue and grey, respectively. Only genes with more than 40 reads per gene averaged per sample (above the grey highlighted region) were retained for the further analysis. (D) Distribution of the log-FC of RNA-Seq between WT and ΔmazEF (left) and ΔmazEF+F and ΔmazEF (right). The genes with identified MazF cleavage site are indicated in cyan.
Figure 2.
Figure 2.
Analysis of translatome after mazF induction by Ribo-Seq. (A) 10–15% sucrose density gradient analysis of polysomes from the WT and ΔmazEF cells, harboring either empty plasmid or plasmid with mazF gene (F). Positions of 30S, 50S, monosomes (70S), ribosome dimers (100S), and polysomes are indicated. (B) The frequency distribution of RPFs between 21 and 38 nt obtained from nuclease digestion in the WT replicate 1. Codon periodicity for each length fragment is indicated in green, violet, and orange for the 1st, 2nd and 3rd nt position in codon, respectively. (C) Reads attributed to the 1st, 2nd and 3rd nt of a codon in WT (green), ΔmazEF (blue) and ΔmazEF+F (red) samples in duplicates. (D) Ribosomes stall at the end of the transcripts cleaved by MazF. Mean change in RPFs between ΔmazEF+F and ΔmazEF (red) at the position -1 relative to U(A)CAU sequences. For comparison, mean change in RPFs between WT and ΔmazEF (blue) is shown in the same region. (E) MazF induction leads to the activation of SsrA-tagging system, which consists of tmRNA and protein SmpB, and to the decrease of RPFs at the 3′ end of transcripts. ΔmazEF (blue) and ΔmazEF+F (red) strains were compared for tmRNA levels, ribosome density on MLD part of tmRNA, protein levels of SmpB, and ribosome density at the 5′ and 3′ ends of transcripts. SmpB protein levels were evaluated by quantitative mass spectrometry (Supplementary Table S1) and have arbitrary normalization. P-values are indicated above.
Figure 3.
Figure 3.
Changes in translatome after mazF induction. log-FC in RPFs in WT compared to ΔmazEF (left) and in ΔmazEF+F compared to ΔmazEF (right). Genes with increased RPFs (P < 0.05), decreased RPFs (P < 0.05) and genes without significant change in RPFs (P > 0.05) are marked in red, blue and grey. Only genes with more than 40 reads per gene averaged per sample (above the grey highlighted region) were retained for the further analysis.
Figure 4.
Figure 4.
Correlation between changes in RNA-Seq, Ribo-Seq and proteomics. log-FC in RNA-Seq, Ribo-Seq, and proteomics in WT compared to ΔmazEF (left) and ΔmazEF+F compared to ΔmazEF (right). Comparison of Ribo-Seq versus RNA-Seq, RNA-Seq versus proteomics, and Ribo-Seq versus proteomics, are indicated. The scales are the same for the graphs on the right and left side of the picture for the clear comparison. Pearson correlation is indicated above each panel. The numbers of the genes in each group are shown. The genes are defined as differentially expressed for log-FC larger than 0.3 for RNA- and Ribo-Seq, and larger than 0.2 for proteins and P < 0.05. Colors indicate the homodirectional change (red), opposite change (green), change only in x-axis (blue), change only in y-axis (violet), no change (gray). Genes which were identified as a directly cleaved by MazF are indicated by black dots.
Figure 5.
Figure 5.
MazF affects specific pathways. (A) Example of groups of genes with decreased and increased translation (log2-FC) represented as a box plot. Comparison of WT to ΔmazEF (blue) and ΔmazEF+F to ΔmazEF (red). The other groups of genes are present in Supplementary Table S3. (B) Examples of groups of genes with decreased translation, but increased protein levels. Changes in transcription (RNA-Seq), translation (Ribo-Seq), translational efficiency (TE), and protein levels for WT compared to ΔmazEF (blue) and for ΔmazEF+F compared to ΔmazEF (red). Genes of ribosomal proteins, purine and pyrimidine biosynthesis and ATP synthase are presented. The P-values for the group of genes being overall differentially expressed are indicated above each group, and were computed using two-sided Wilcoxon test.
Figure 6.
Figure 6.
MazF increases thickness of cell wall and decreases cell division. (A) ΔmazEF cell carrying either empty vector or plasmid expressing MazF (ΔmazEF+F) were treated with ATc for 0, 10, 60 and 180 min to induce mazF expression and analyzed by transmission electron microscopy (TEM). Electron microscopy images are presented at 2 different magnifications (upper and lower panels), and the scale bars indicate 1 μm or 200 nm, respectively. Images at 0 and 180 min of induction are shown. More images are shown on the Supplementary Figure S13. (B and C) Analysis of cell wall thickness (B) and cell size (C) after 0, 60 and 180 min of mazF induction. ΔmazEF and ΔmazEF+F samples are indicated in blue and red, respectively. The error bars indicate standard deviations (SDs). The P-values were computed using two-sided Wilcoxon signed-rank test. (D) Analysis of cell division after 0, 60 and 180 min of mazF induction. The Fisher's exact test was used to compare the number of cells with and without division septum. P-values are indicated.
Figure 7.
Figure 7.
Model of MazF impact on cell physiology and its implication on cell survival and dormancy. MazE degradation unleashes MazF endoribonuclease activity. MazF cleaves many RNAs and suppresses transcription and translation of many genes rather than a particular set of genes. MazF changes the translational program and specifically affects several pathways: co-translational quality control, ribosome hibernation and recycling, cell division and cell wall thickness. Activation of these pathways may contribute to reversible bacteria dormancy, which allow cells to survive unfavorable growth conditions. Impact of MazF is indicated in red arrows. Activation of the other pathways by MazF is also possible.

References

    1. Lowy F.D. Staphylococcus aureus infections. N. Engl. J. Med. 1998; 339:520–532. - PubMed
    1. Aslam B., Wang W., Arshad M.I., Khurshid M., Muzammil S., Rasool M.H., Nisar M.A., Alvi R.F., Aslam M.A., Qamar M.U.et al. .. Antibiotic resistance: a rundown of a global crisis. Infect. Drug Resist. 2018; 11:1645–1658. - PMC - PubMed
    1. Balaban N.Q., Helaine S., Lewis K., Ackermann M., Aldridge B., Andersson D.I., Brynildsen M.P., Bumann D., Camilli A., Collins J.J.et al. .. Definitions and guidelines for research on antibiotic persistence. Nat. Rev. Microbiol. 2019; 17:441–448. - PMC - PubMed
    1. Lewis K. Persister cells. Annu. Rev. Microbiol. 2010; 64:357–372. - PubMed
    1. Wood T.K., Knabel S.J., Kwan B.W.. Bacterial persister cell formation and dormancy. Appl. Environ. Microbiol. 2013; 79:7116–7121. - PMC - PubMed

Publication types

MeSH terms