Comment
. 2021 Feb 4;184(3):827-839.e14.
doi: 10.1016/j.cell.2020.11.035.

TCR+/BCR+ dual-expressing cells and their associated public BCR clonotype are not enriched in type 1 diabetes

Affiliations
Comment

TCR+/BCR+ dual-expressing cells and their associated public BCR clonotype are not enriched in type 1 diabetes

Alberto Sada Japp et al. Cell. .

Abstract

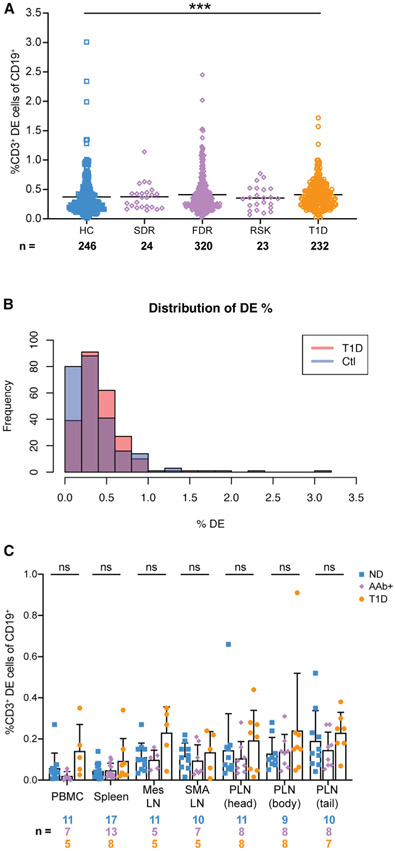
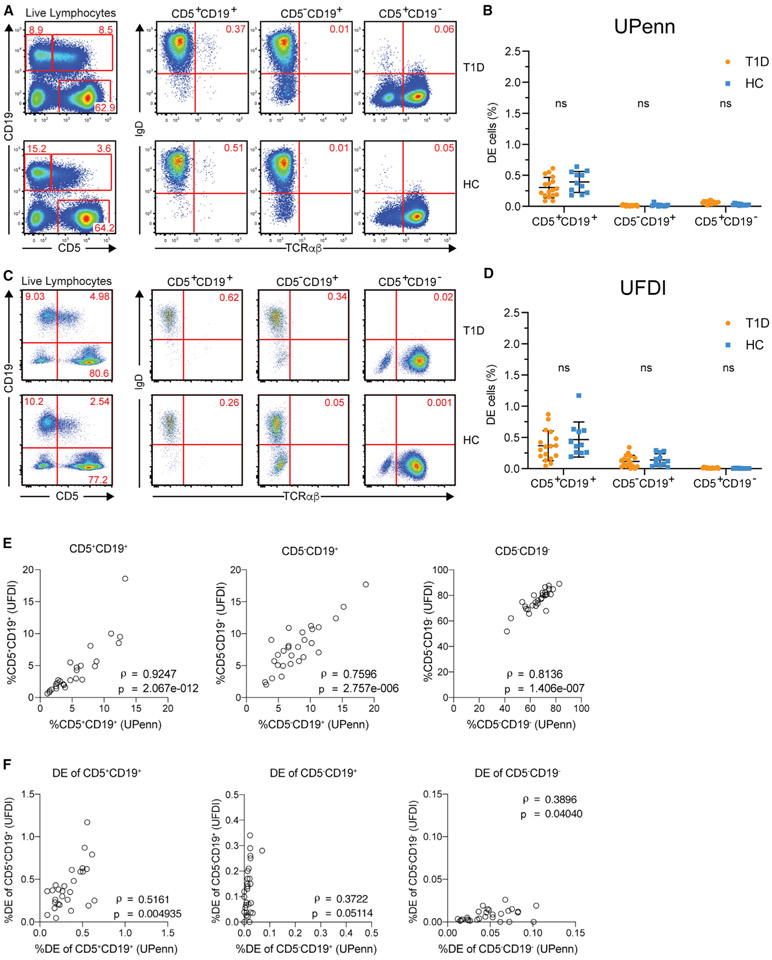
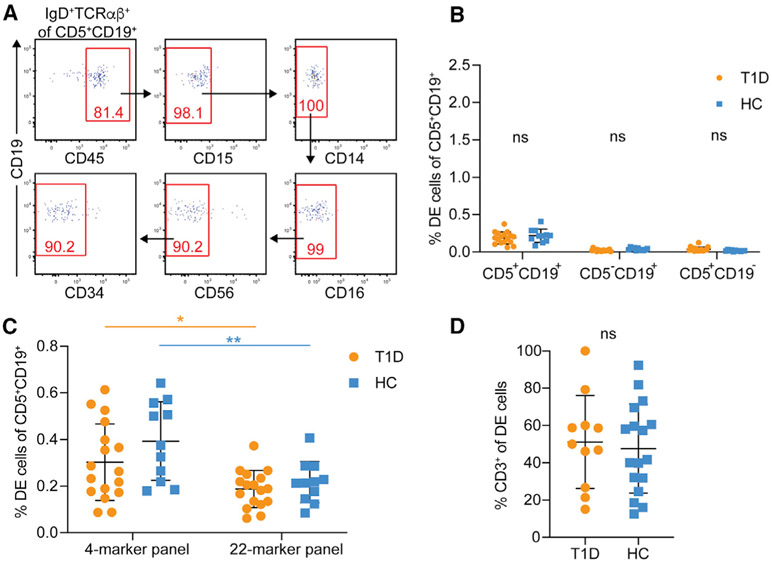
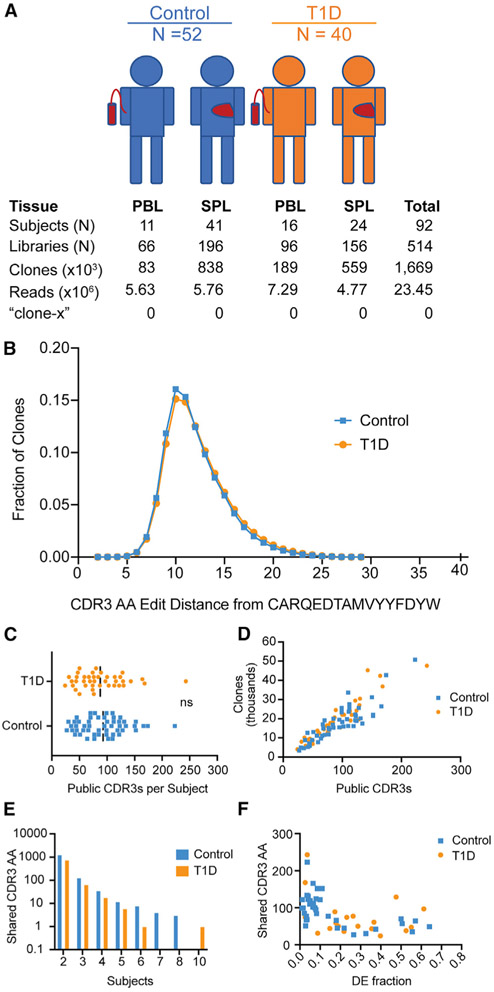
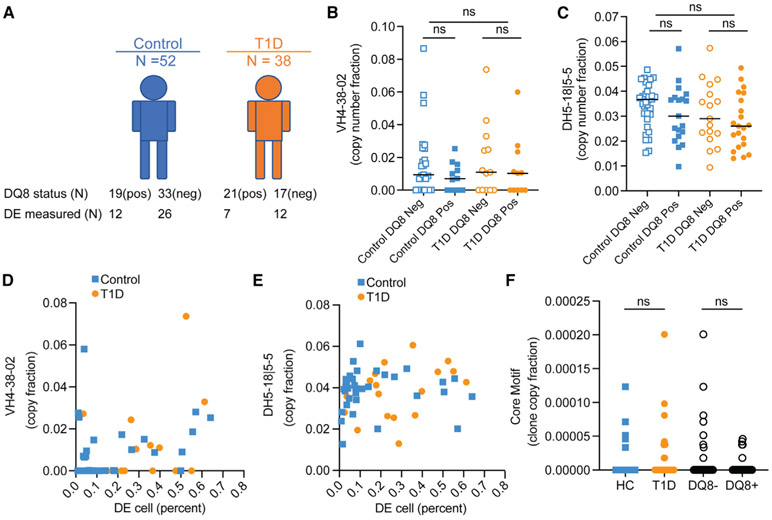
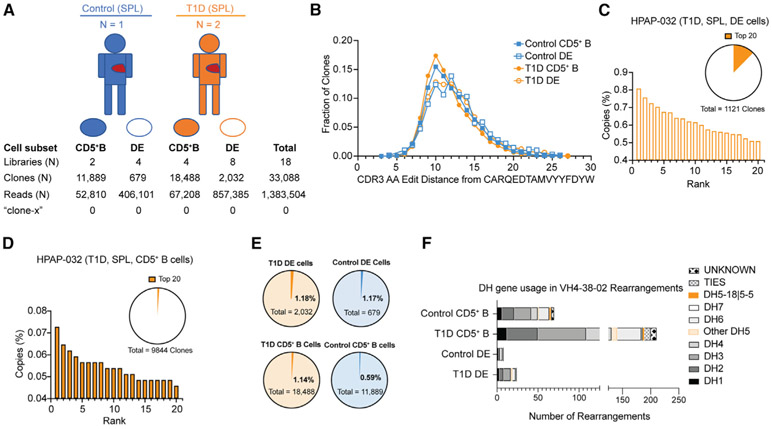
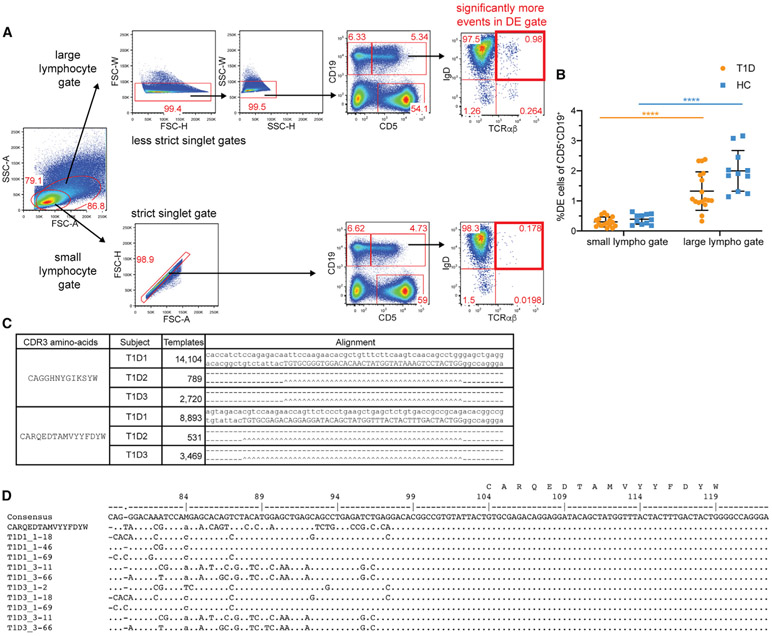
Ahmed and colleagues recently described a novel hybrid lymphocyte expressing both a B and T cell receptor, termed double expresser (DE) cells. DE cells in blood of type 1 diabetes (T1D) subjects were present at increased numbers and enriched for a public B cell clonotype. Here, we attempted to reproduce these findings. While we could identify DE cells by flow cytometry, we found no association between DE cell frequency and T1D status. We were unable to identify the reported public B cell clone, or any similar clone, in bulk B cells or sorted DE cells from T1D subjects or controls. We also did not observe increased usage of the public clone VH or DH genes in B cells or in sorted DE cells. Taken together, our findings suggest that DE cells and their alleged public clonotype are not enriched in T1D. This Matters Arising paper is in response to Ahmed et al. (2019), published in Cell. See also the response by Ahmed et al. (2021), published in this issue.

Keywords: HIRN; HPAP; Human Islet Research Network; Human Pancreas Analysis Program; T1D; immune repertoire; immunoglobulin; immunophenotyping; public clone; rare-event detection; type 1 diabetes.


Conflict of interest statement

Declaration of interests The authors declare no competing interests.

Figures

Figure 1.
Figure 1.. IgD+CD19+ cells expressing CD3 are not expanded in T1D patients, their relatives, or seropositive at-risk individuals
(A) Dot plot from the UFDI biorepository showing the % of CD19+ cells defined as IgD+CD3+ in whole blood of healthy controls (HC), second-degree relatives (SDR), first-degree relatives with 1 or fewer AAb (FDR), 32 AAb+ at-risk individuals (RSK), and type 1 diabetes patients (T1D). Lines indicate mean. Kruskal-Wallis with Dunn’s post-test, ***p < 0.001. (B) Distribution of DE cells in T1D versus HC, showing substantial overlap. The 95% confidence interval (−0.0165, −0.0887) for the difference in means of a bootstrap analysis included zero. (C) HPAP dataset of tissues obtained from organ donors. DE cells were defined as CD3+ events out of the total CD19+ population. PBMC, peripheral blood mononuclear cells; Mes LN, mesenteric lymph node; SMA LN, superior mesenteric artery lymph node; PLN pancreatic lymph node from head, body, or tail of the pancreas. ND, non-diabetic; Aab+, auto-antibody-positive; T1D, type 1 diabetic. Bars indicate mean and SD. Two-way ANOVA with Sidak’s correction, ns, non-significant (p > 0.05).
Figure 2.
Figure 2.. Two-site replication experiment to assess DE cells in PBMCs
(A and C) DE events were identified as IgD+TCRαβ+, as in Ahmed et al. (2019), independently at UPenn and UFDI (B and D) Frequencies of DE events in CD5+CD19+, CD5CD19+, and CD5+CD19 populations. Two-way ANOVA with Sidak’s correction performed with DE populations matched by subject, ns, non-significant (p > 0.05). (E and F) Spearman correlations between the frequencies of parent populations (E) or DE events (F) measured by UPenn and UFDI in the PBMCs from the same donors.
Figure 3.
Figure 3.. Exclusion of cells expressing other immune lineage markers reduces the frequency of DE events
(A) “Clean-up” gating strategy to include CD45+ events and exclude events positive for CD14, CD15, CD16, CD56, and CD34. (B) Frequency of DE events in the PBMCs of HC and T1D after “clean-up.” Two-way ANOVA with Sidak’s correction, ns, non-significant (p > 0.05). (C) Comparison of DE events obtained with the minimal 4-color marker panel and the expanded 22-color marker panel. Two-way ANOVA with Sidak’s correction, *p < 0.05, **p < 0.01, ns, non-significant. (D) Proportion of CD3+ DE cells in patients with T1D versus controls. Unpaired t test, ns, not significant.
Figure 4.
Figure 4.. Analysis of shared CDR3 sequences and clones
(A) Overview of study subjects and IgH sequencing data. Numbers of subjects with peripheral blood (PBL) or spleen (SPL) samples, numbers of sequencing libraries, clones (same VH, same JH, same CDR3 length and 85% amino acid similarity in CDR3), numbers of valid reads, and numbers of times that sequences matching the clone-x CDR3 amino acid (AA) sequence of “CARQEDTAMVYYFDYW” are found. (B) Levenshtein distance (in AA) of all rearrangements from the clone-x CDR3 string (sequences within 4 AA are listed in Table S3). (C) Number of public CDR3 sequences (sequences shared by two or more subjects) per subject (each dot is a subject). The median frequency of CDR3 sequences per subject is not significantly different between individuals with T1D (orange) and controls (blue), p = 0.49, Mann-Whitney. (D) Correlation plot with total clone count (subject level) versus number of public CDR3 sequences (CDR3 AA sequences shared by two or more subjects). r2 is 0.77 for controls and 0.88 for T1D. (E) Total number of identical CDR3 AA sequences shared versus the number of subjects that share them. (F) Correlation between shared CDR3 number and the DE cell fraction. r2 is 0.31 for controls and 0.09 for T1D.
Figure 5.
Figure 5.. Clone-x VH, DH, and core motif usage by disease and DQ8 status
(A) Number of subjects (N) who were DQ8 positive and negative, stratified by disease status. (B) Total copy-number fraction of VH4-38-02 clones in each donor versus DQ8; donors (n = 27) with no IGHV4-38-2 clones are excluded (see Figure S4 and STAR Methods). (C) Total copy-number fraction of IgD5-18∣5-5 clones (excluding minor rearrangements that were tied with other DHs) versus DQ8; donors with no IGHD5-18∣5-5 clones are excluded. (D–F) (D) VH4-38-02 copy fraction versus DE cell (percentage of B cell gate). (E) DH5-18∣5-5 copy fraction versus DE cell (percentage of B cell gate). (F) Fraction of clones (weighted by copies) containing the clone-x core motif CDR3 AA sequence (“DTAMVYYFD”) in HC versus T1D and in DQ8+ versus DQ8− individuals. Each dot is a subject. Comparisons in (B), (C), and (F) were made on median values by rank sum test (Mann-Whitney). DE calculations used in (D) and (E) combine PBMC and spleen samples from UFDI and HPAP (DE data shown in Figures 1 and 2) and used different flow panels for DE quantification, ns, not significant with a one-sided cut-off p < 0.01.
Figure 6.
Figure 6.. Antibody VH rearrangement data on sorted DE cells from T1D versus control subjects
(A) Overview of study subjects and sorted B cell subsets from organ donor spleen (SPL). CD5+ B cells are CD5+, CD19+, TCRαβ lymphocytes. DE, double expresser cells are TCRαβ+, CD19+, CD5+ lymphocytes. Libraries, clones, and reads (copies) are as defined in Figure 4. (B) Levenshtein distance distribution of sorted cells, by population and disease status. (C and D) (C) Copy-number percent of top 20 clones in the DE and (D) CD5+ B cell sorts. Orange wedges in pie charts show percentage of total library copies taken up by the top 20 clones. None of the clones in the top 20 copy number rearrangements in HPAP-032 had VH4-38-02 rearrangements (data on the other two donors are in Figure S7). (E and F) (E) Fractions of clones with VH4-38-02 rearrangements from sorted DE and CD5+ B cells; (F) DH gene usage for VH4-38-02 rearrangements in sorted subsets. DH gene usage is shown, with each unique rearrangement only counted once. DH gene usage is given by family, except for DH5-18∣5-5, where sequences with this specific DH gene assignment are highlighted in orange. “Other DH5” indicates a DH5 gene other than DH5-18∣5-5. TIES indicate DH genes with more than one DH family assignment. UNKNOWN indicates no DH gene assignment. For (B), (E), and (F), the data for HPAP-015 and HPAP-032 were combined for T1D and HPAP-017 was the control. Each symbol is an individual. ns, not significant by Mann-Whitney rank sum test, α = 0.01.
Figure 7.
Figure 7.. Technical considerations
(A) Gating on lymphocytes on the basis of forward versus side scatter area using a small versus less restrictive (large) lymphocyte gate. (B) Differences in DE cell frequencies with small versus large lymphocyte gate. Two-way ANOVA with Sidak’s correction, ****p < 0.0001. (C) All top-copy sequences corresponding to clone-x and a second dominant clonotype are identical in T1D1, T1D2, and T1D3. Nucleotide sequence alignments of top-copy clones found in three donors in the Ahmed paper. Dashes indicate identity between sequences and carets indicate identity in the CDR3 nucleotide sequence (given in capitals). (D) Nucleic acid sequence alignments of top-copy clone (clone-x) with different VHs and identical CDR3 nt sequence (consistent with hybrid PCR products). To the left of each sequence is the sample name followed by an underscore and then the most similar VH gene assignment (e.g., 1-18 = VH1-18). The clone-x CDR3 amino acid (AA) sequence is shown above the corresponding nucleotides.

Comment in

Comment on

References

    1. Ahmed R, Omidian Z, Giwa A, Cornwell B, Majety N, Bell DR, Lee S, Zhang H, Michels A, Desiderio S, et al. (2019). A Public BCR Present in a Unique Dual- Receptor-Expressing Lymphocyte from Type 1 Diabetes Patients Encodes a Potent T Cell Autoantigen. Cell 177, 1583–1599.16. - PMC - PubMed
    1. Ahmed R, Omidian Z, Giwa A, Donner T, Jie C, and Hamad ARA (2021). A reply to “TCR+/BCR+ dual-expressing cells and their associated public BCR clonotype are not enriched in type 1 diabetes”. Cell 184, 840–843, this issue. - PMC - PubMed
    1. Allman D, Li J, and Hardy RR (1999). Commitment to the B lymphoid lineage occurs before DH-JH recombination. J. Exp. Med 189, 735–740. - PMC - PubMed
    1. Atkinson MA, von Herrath M, Powers AC, and Clare-Salzler M (2015). Current concepts on the pathogenesis of type 1 diabetes–considerations for attempts to prevent and reverse the disease. Diabetes Care 38, 979–988. - PMC - PubMed
    1. Battaglia M, Ahmed S, Anderson MS, Atkinson MA, Becker D, Bingley PJ, Bosi E, Brusko TM, DiMeglio LA, Evans-Molina C, et al. (2020). Introducing the Endotype Concept to Address the Challenge of Disease Heterogeneity in Type 1 Diabetes. Diabetes Care 43, 5–12. - PMC - PubMed

Publication types

Substances