. 2021 Apr 12;39(4):494-508.e5.
doi: 10.1016/j.ccell.2021.01.003. Epub 2021 Feb 4.

Mutant p53 suppresses innate immune signaling to promote tumorigenesis

Affiliations

Mutant p53 suppresses innate immune signaling to promote tumorigenesis

Monisankar Ghosh et al. Cancer Cell. .

Abstract

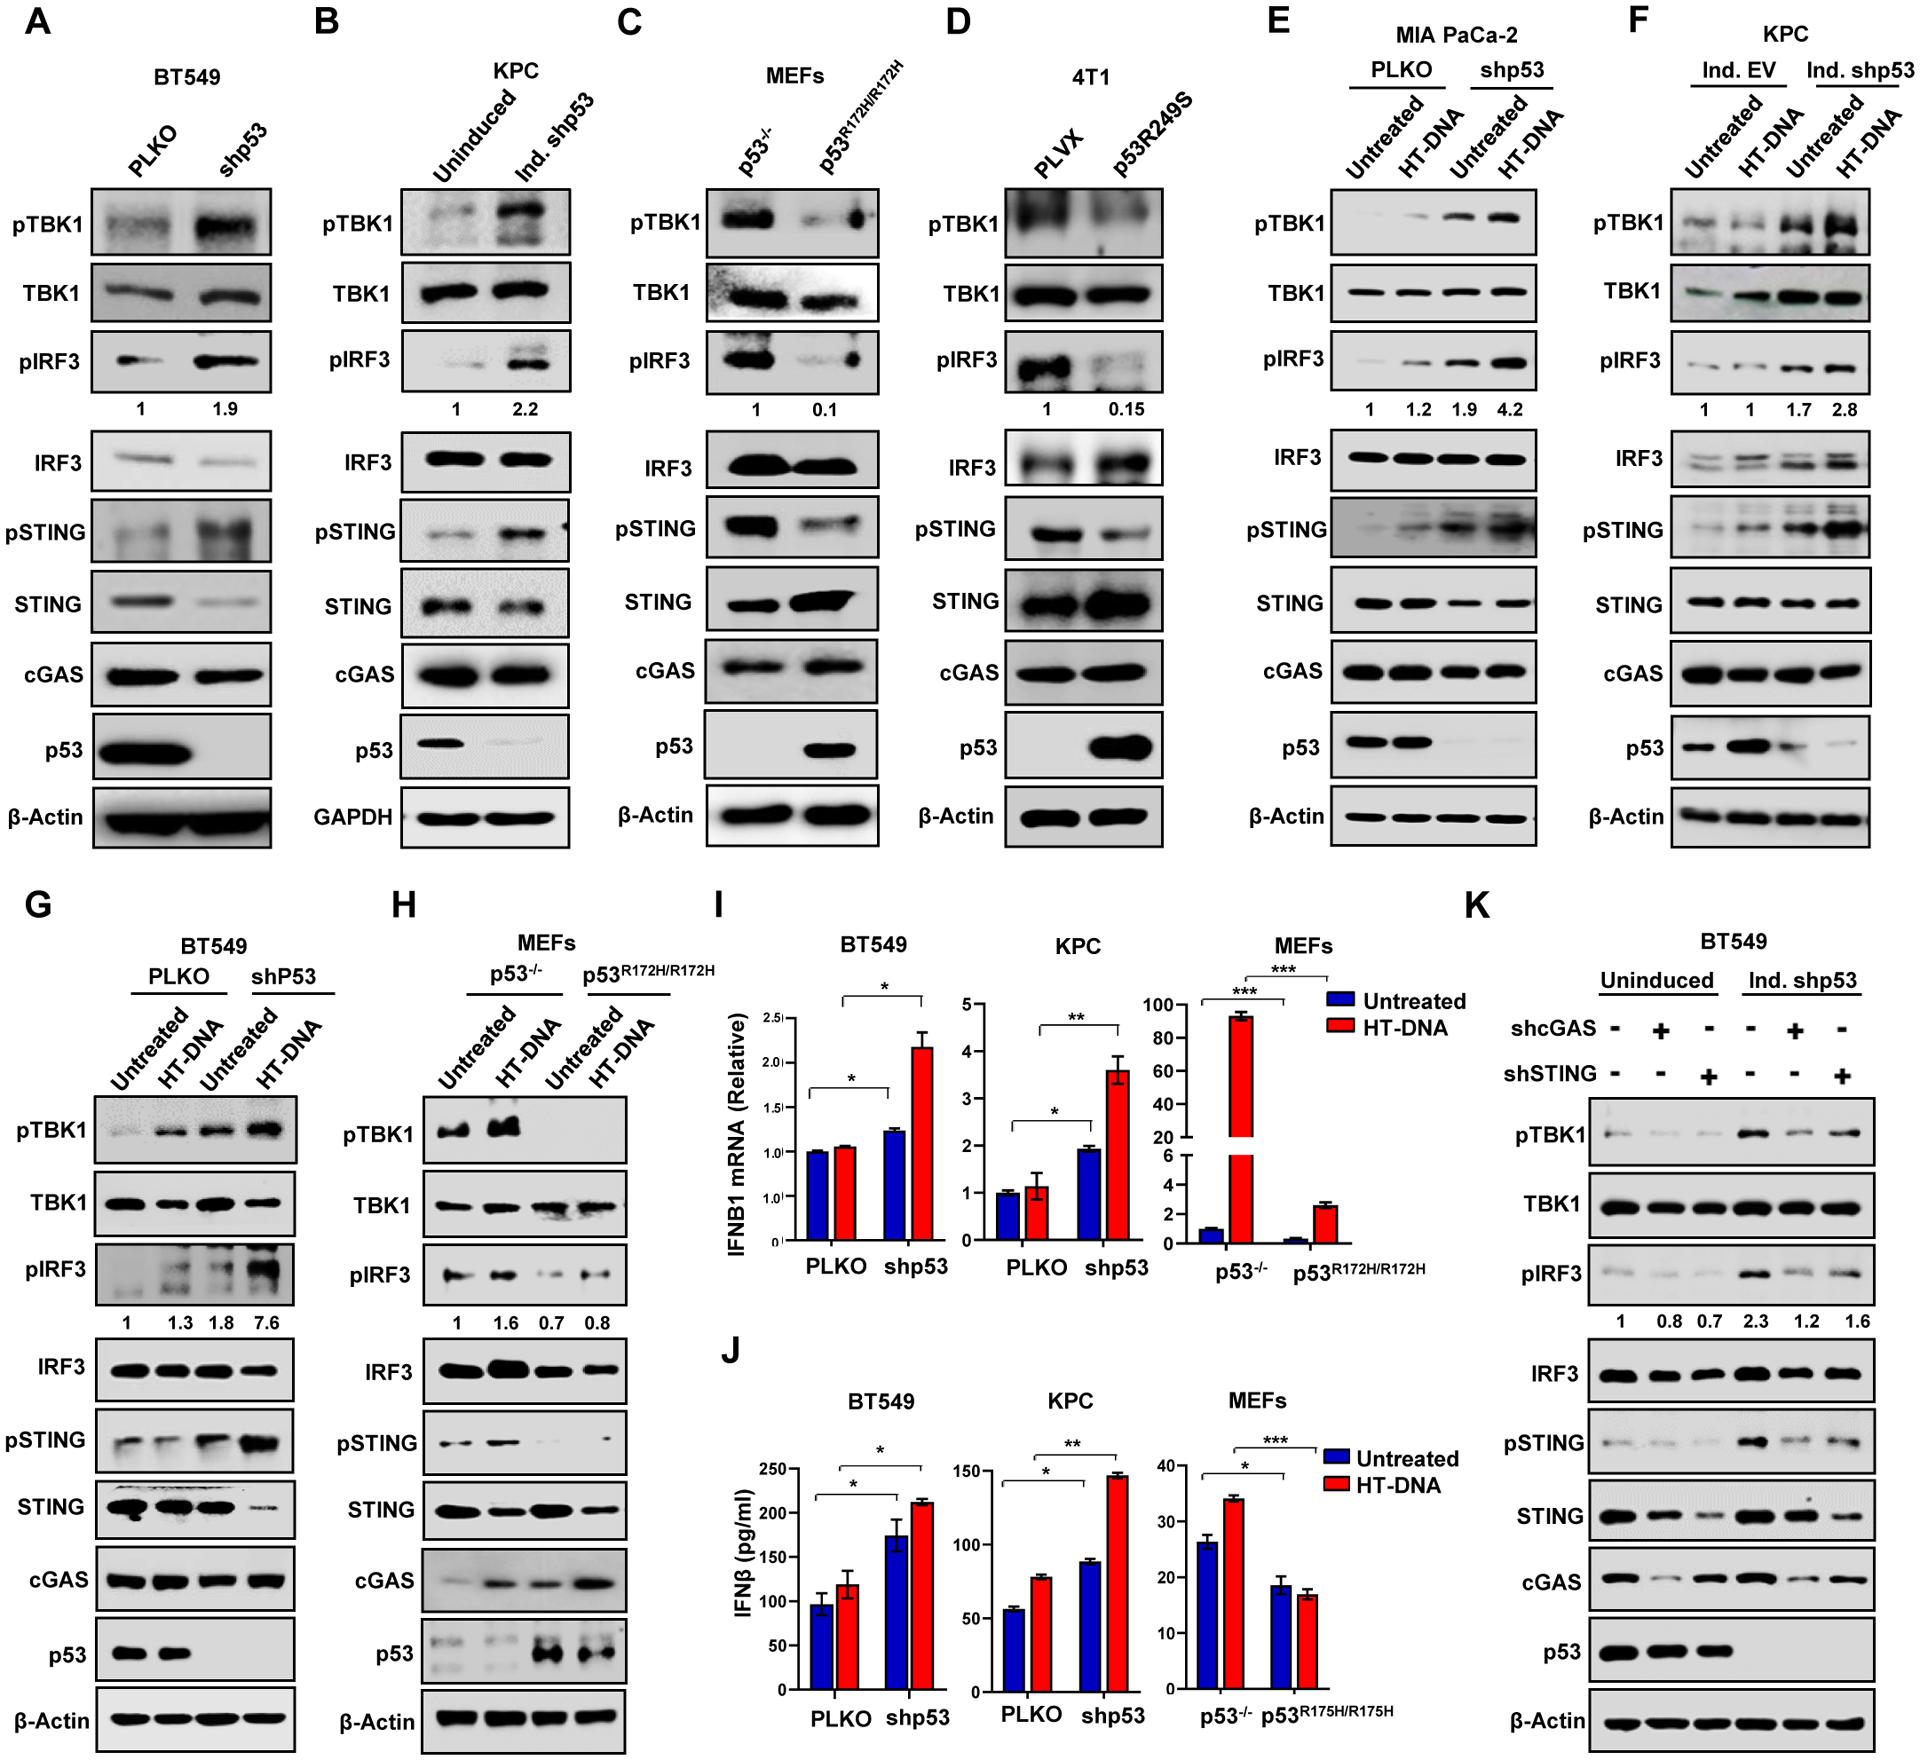
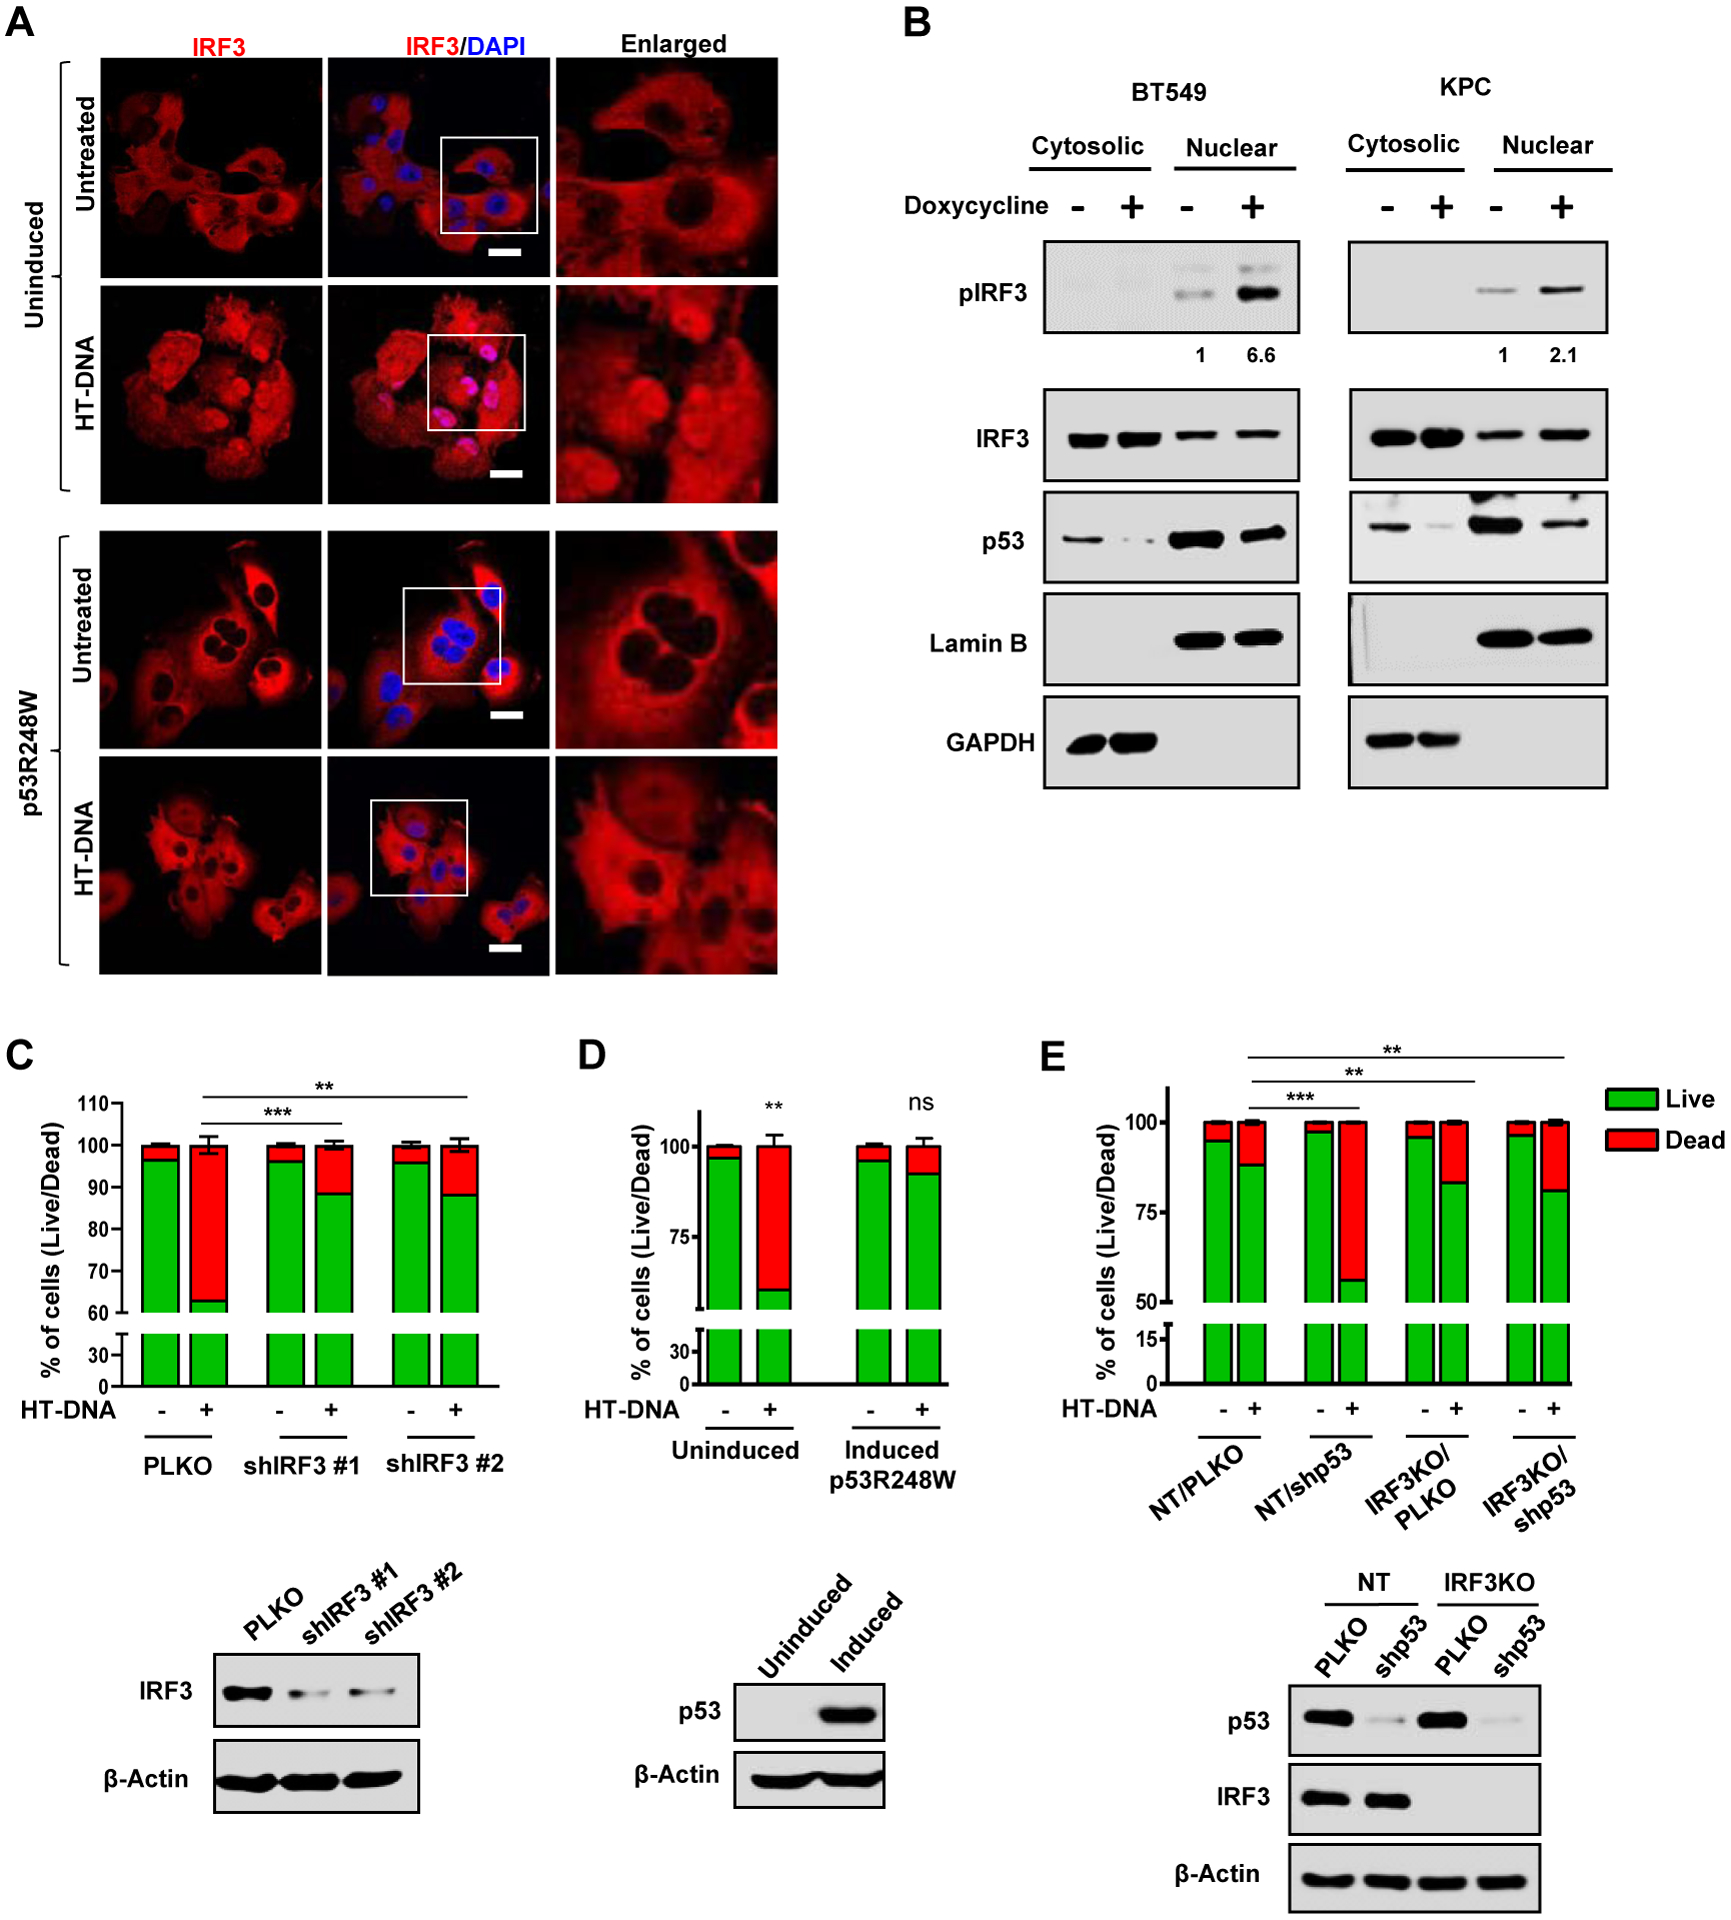
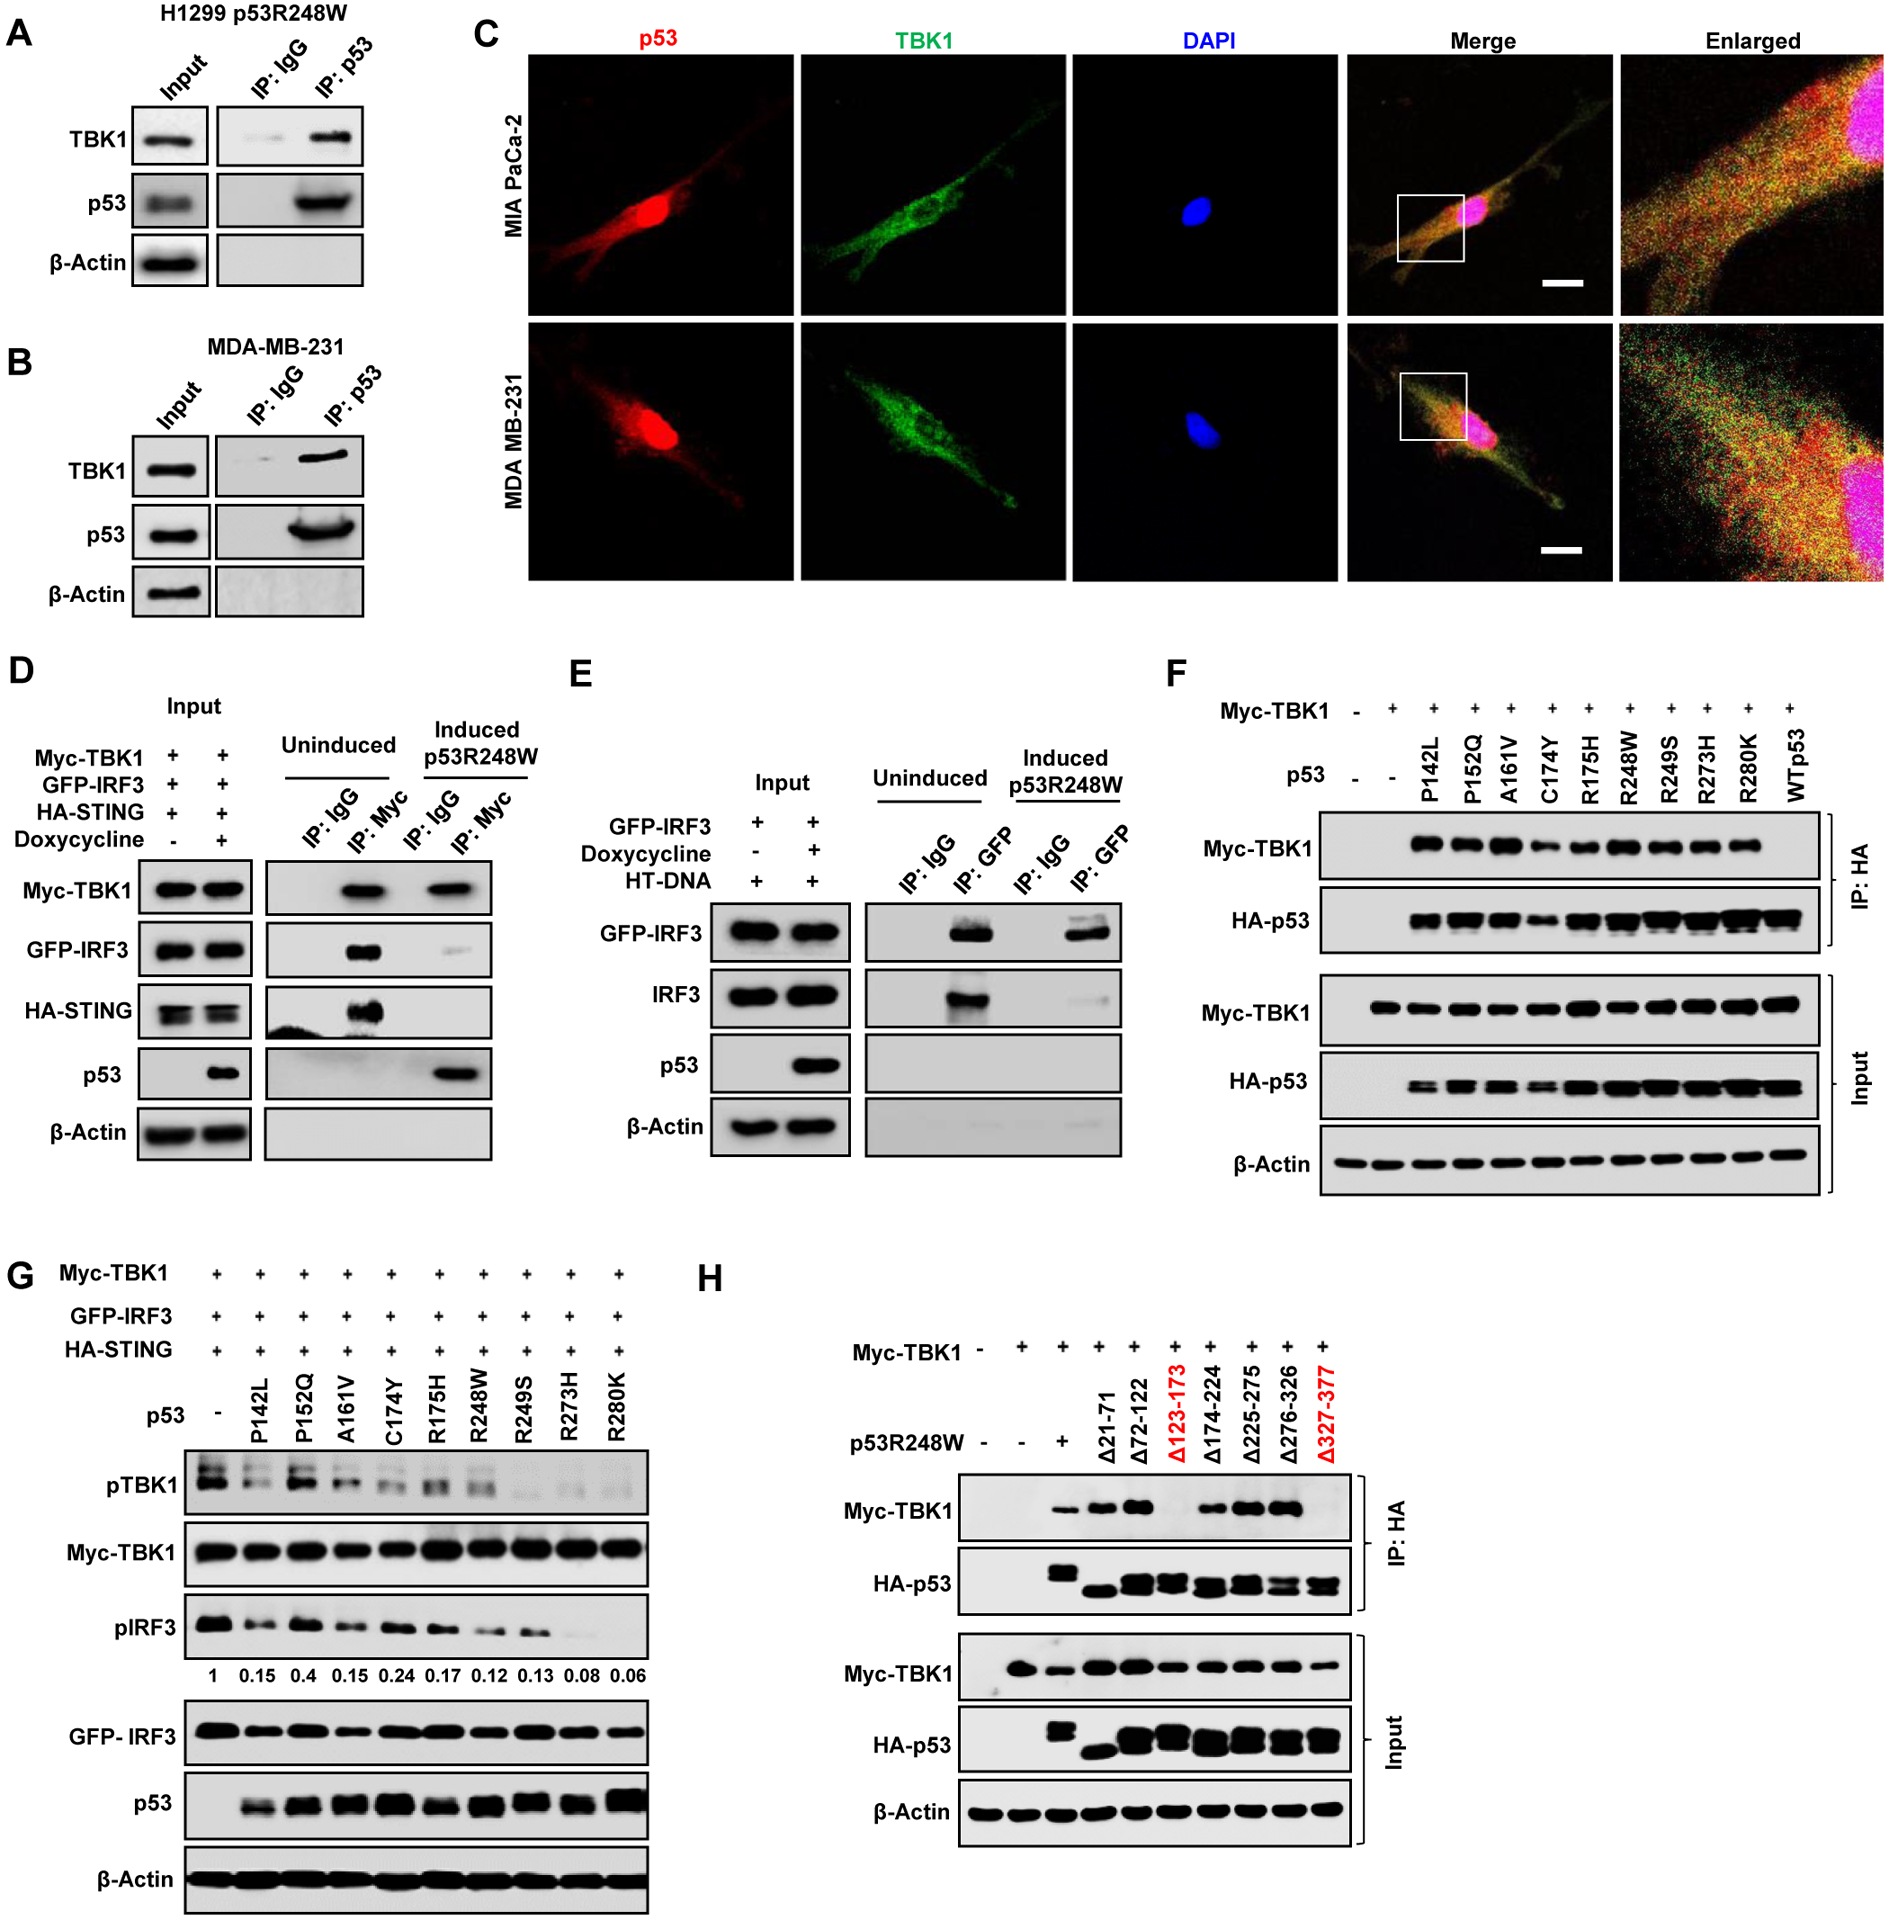
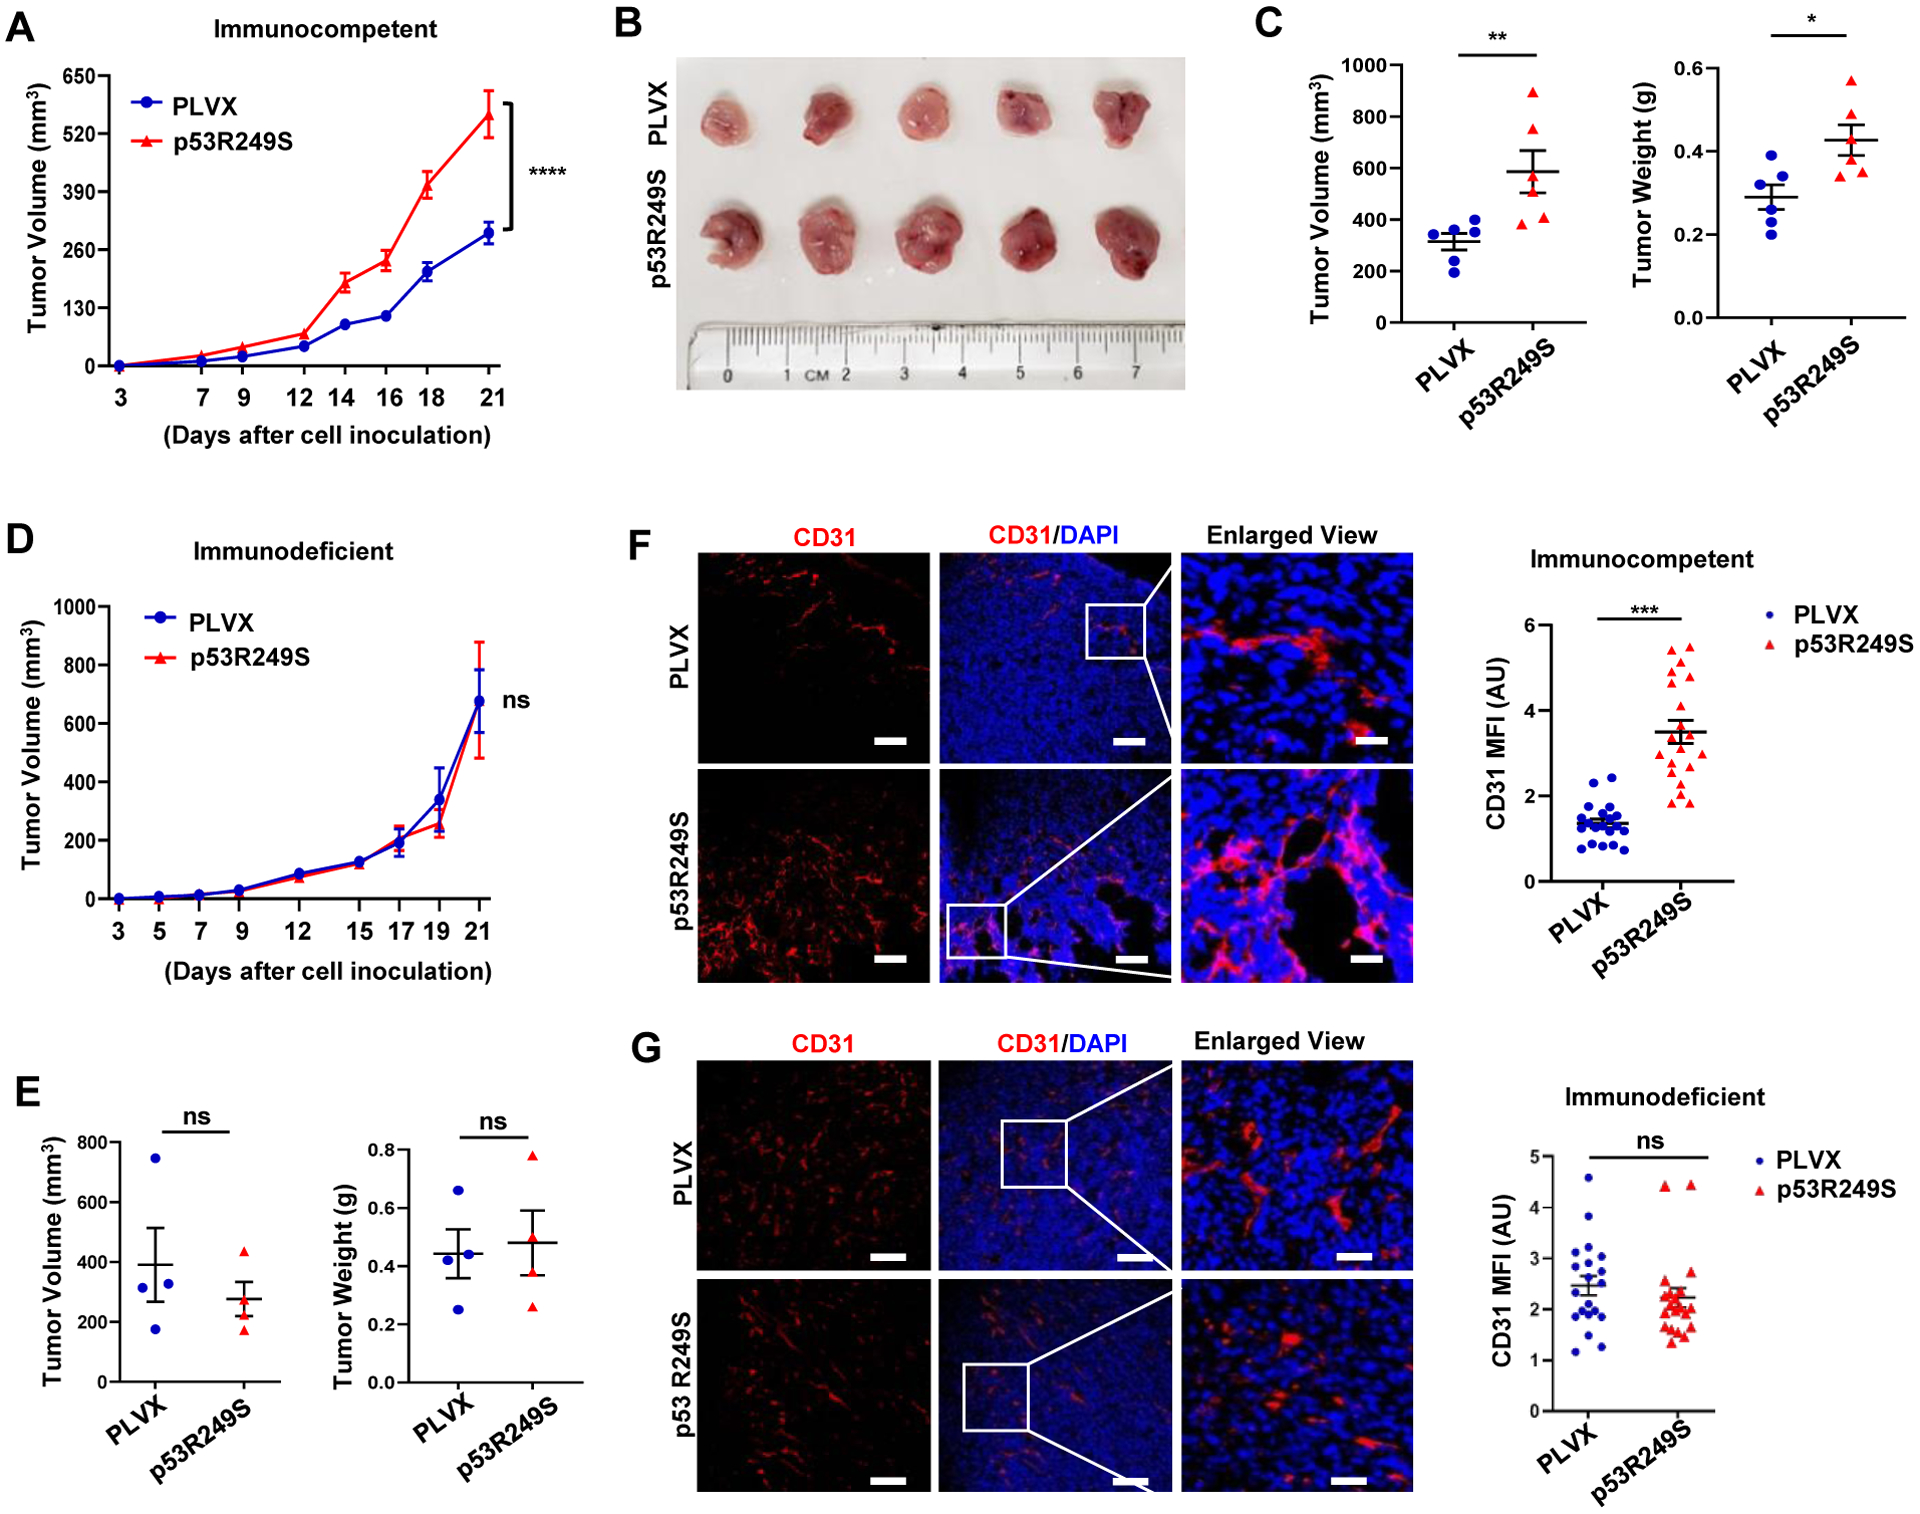
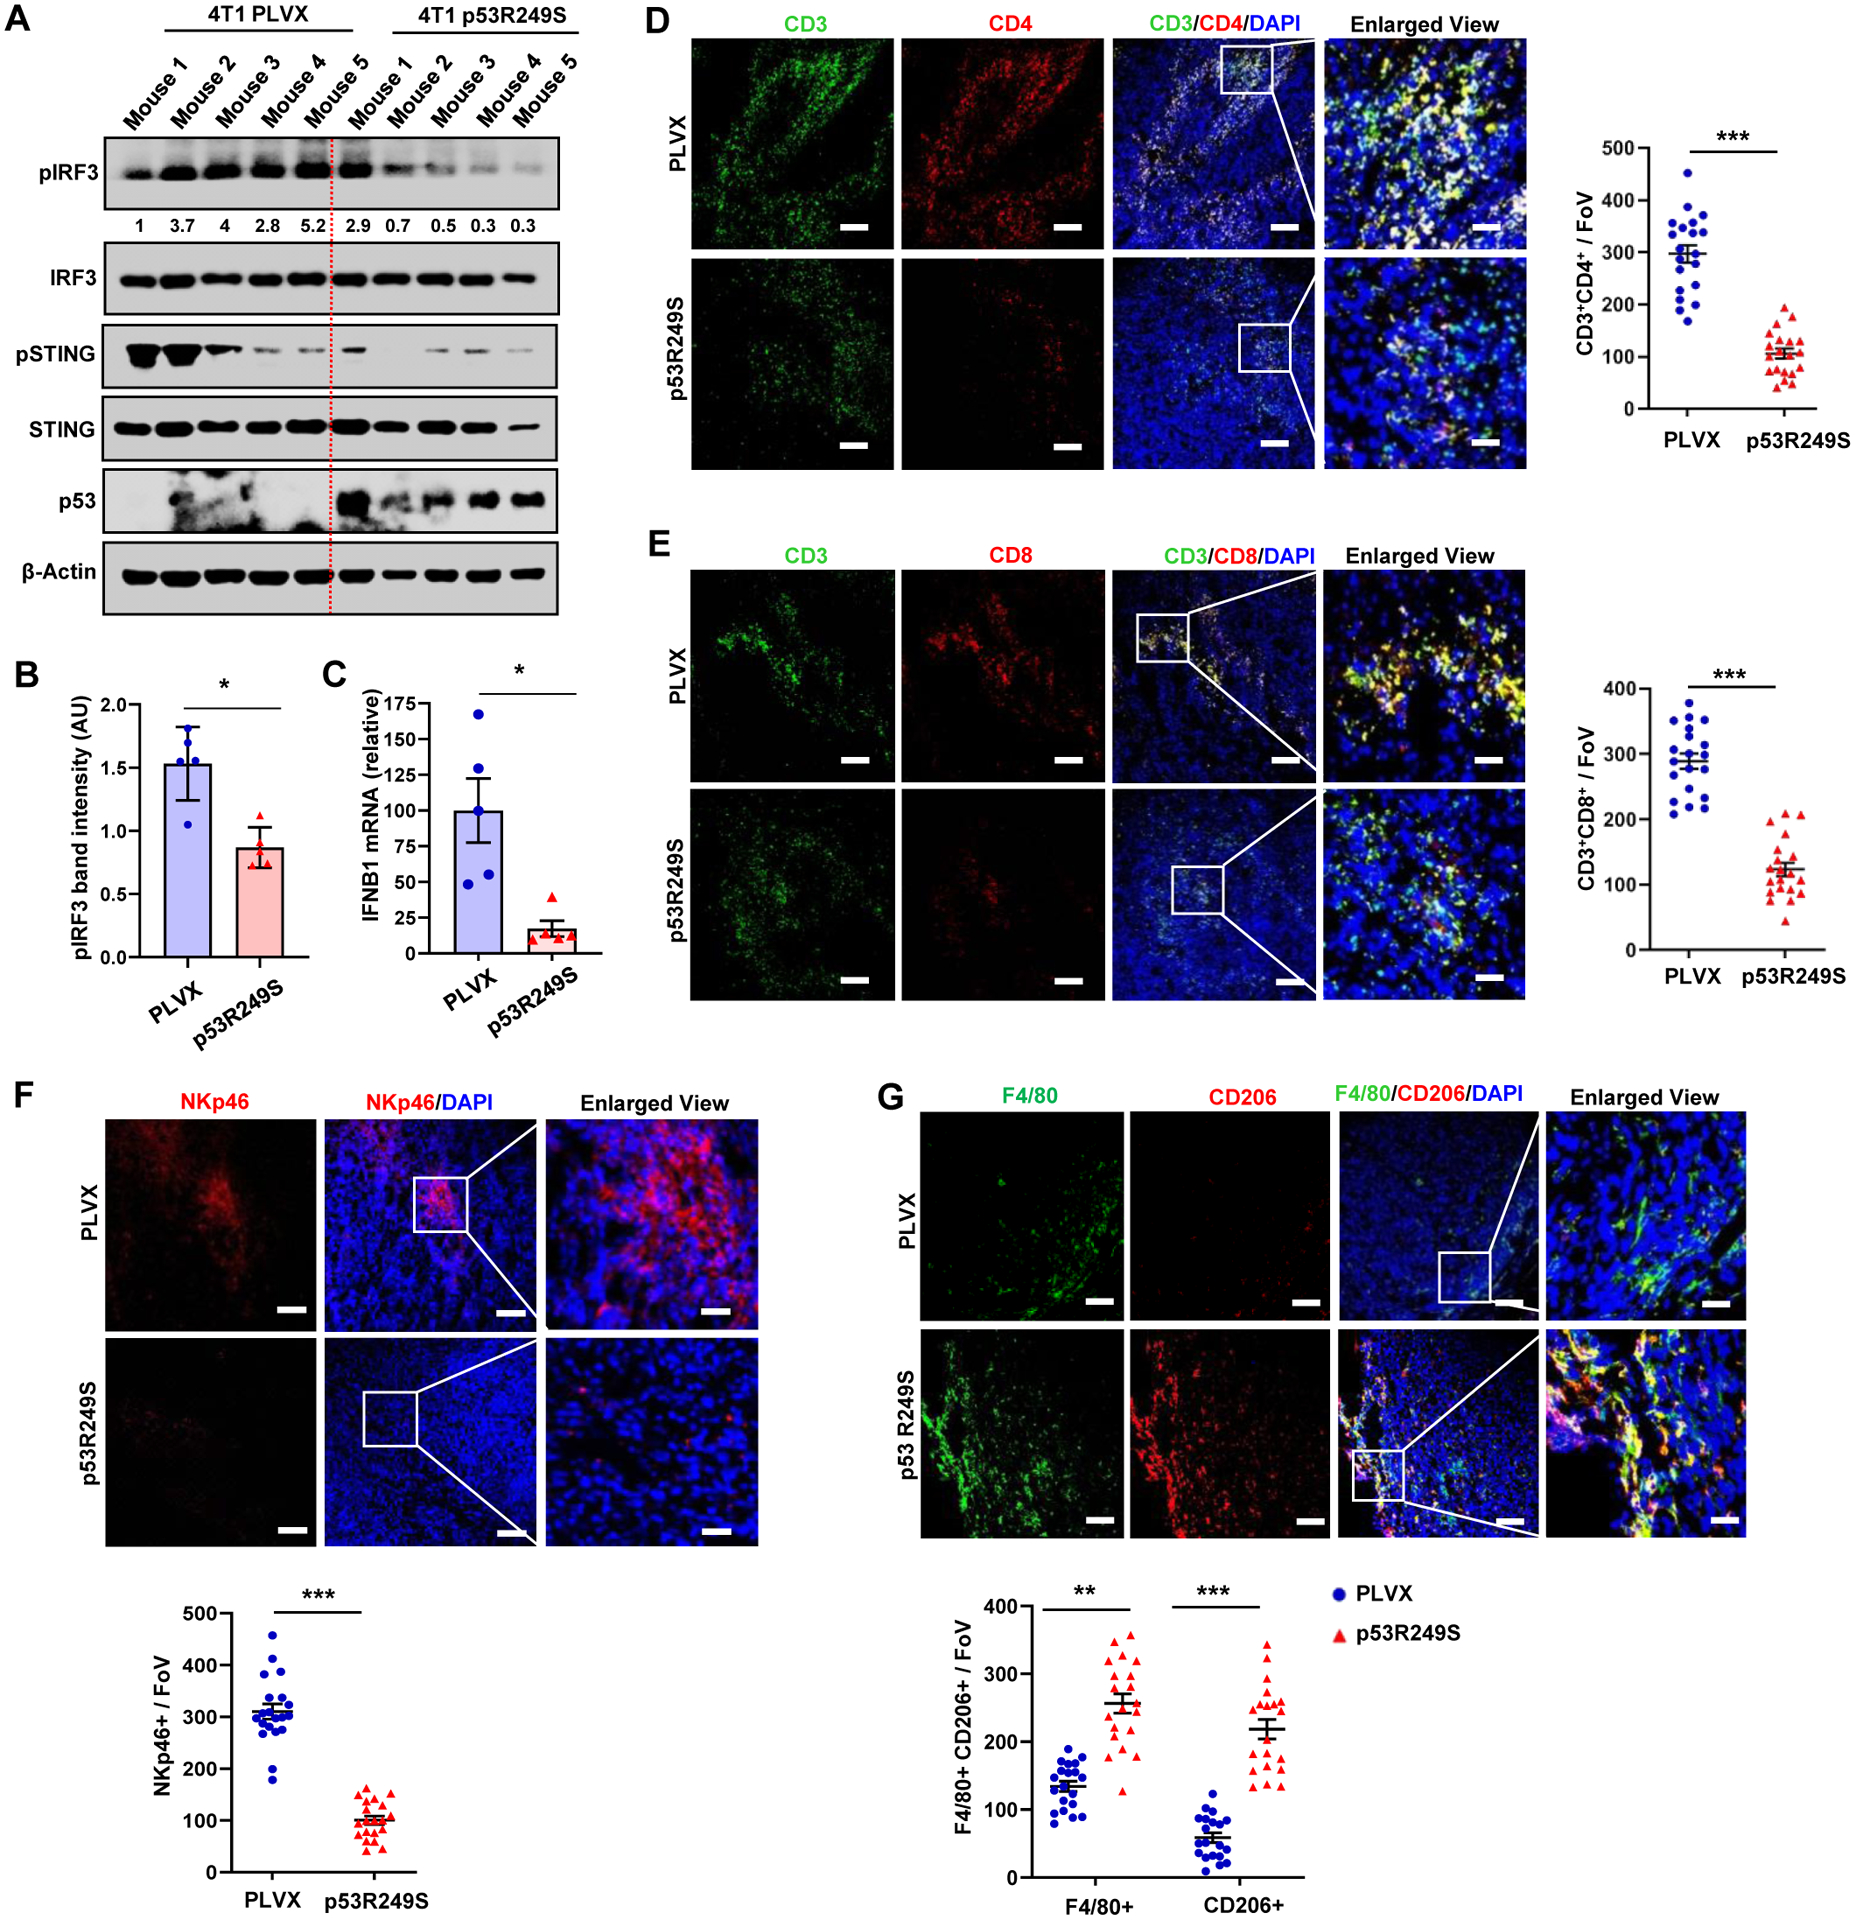
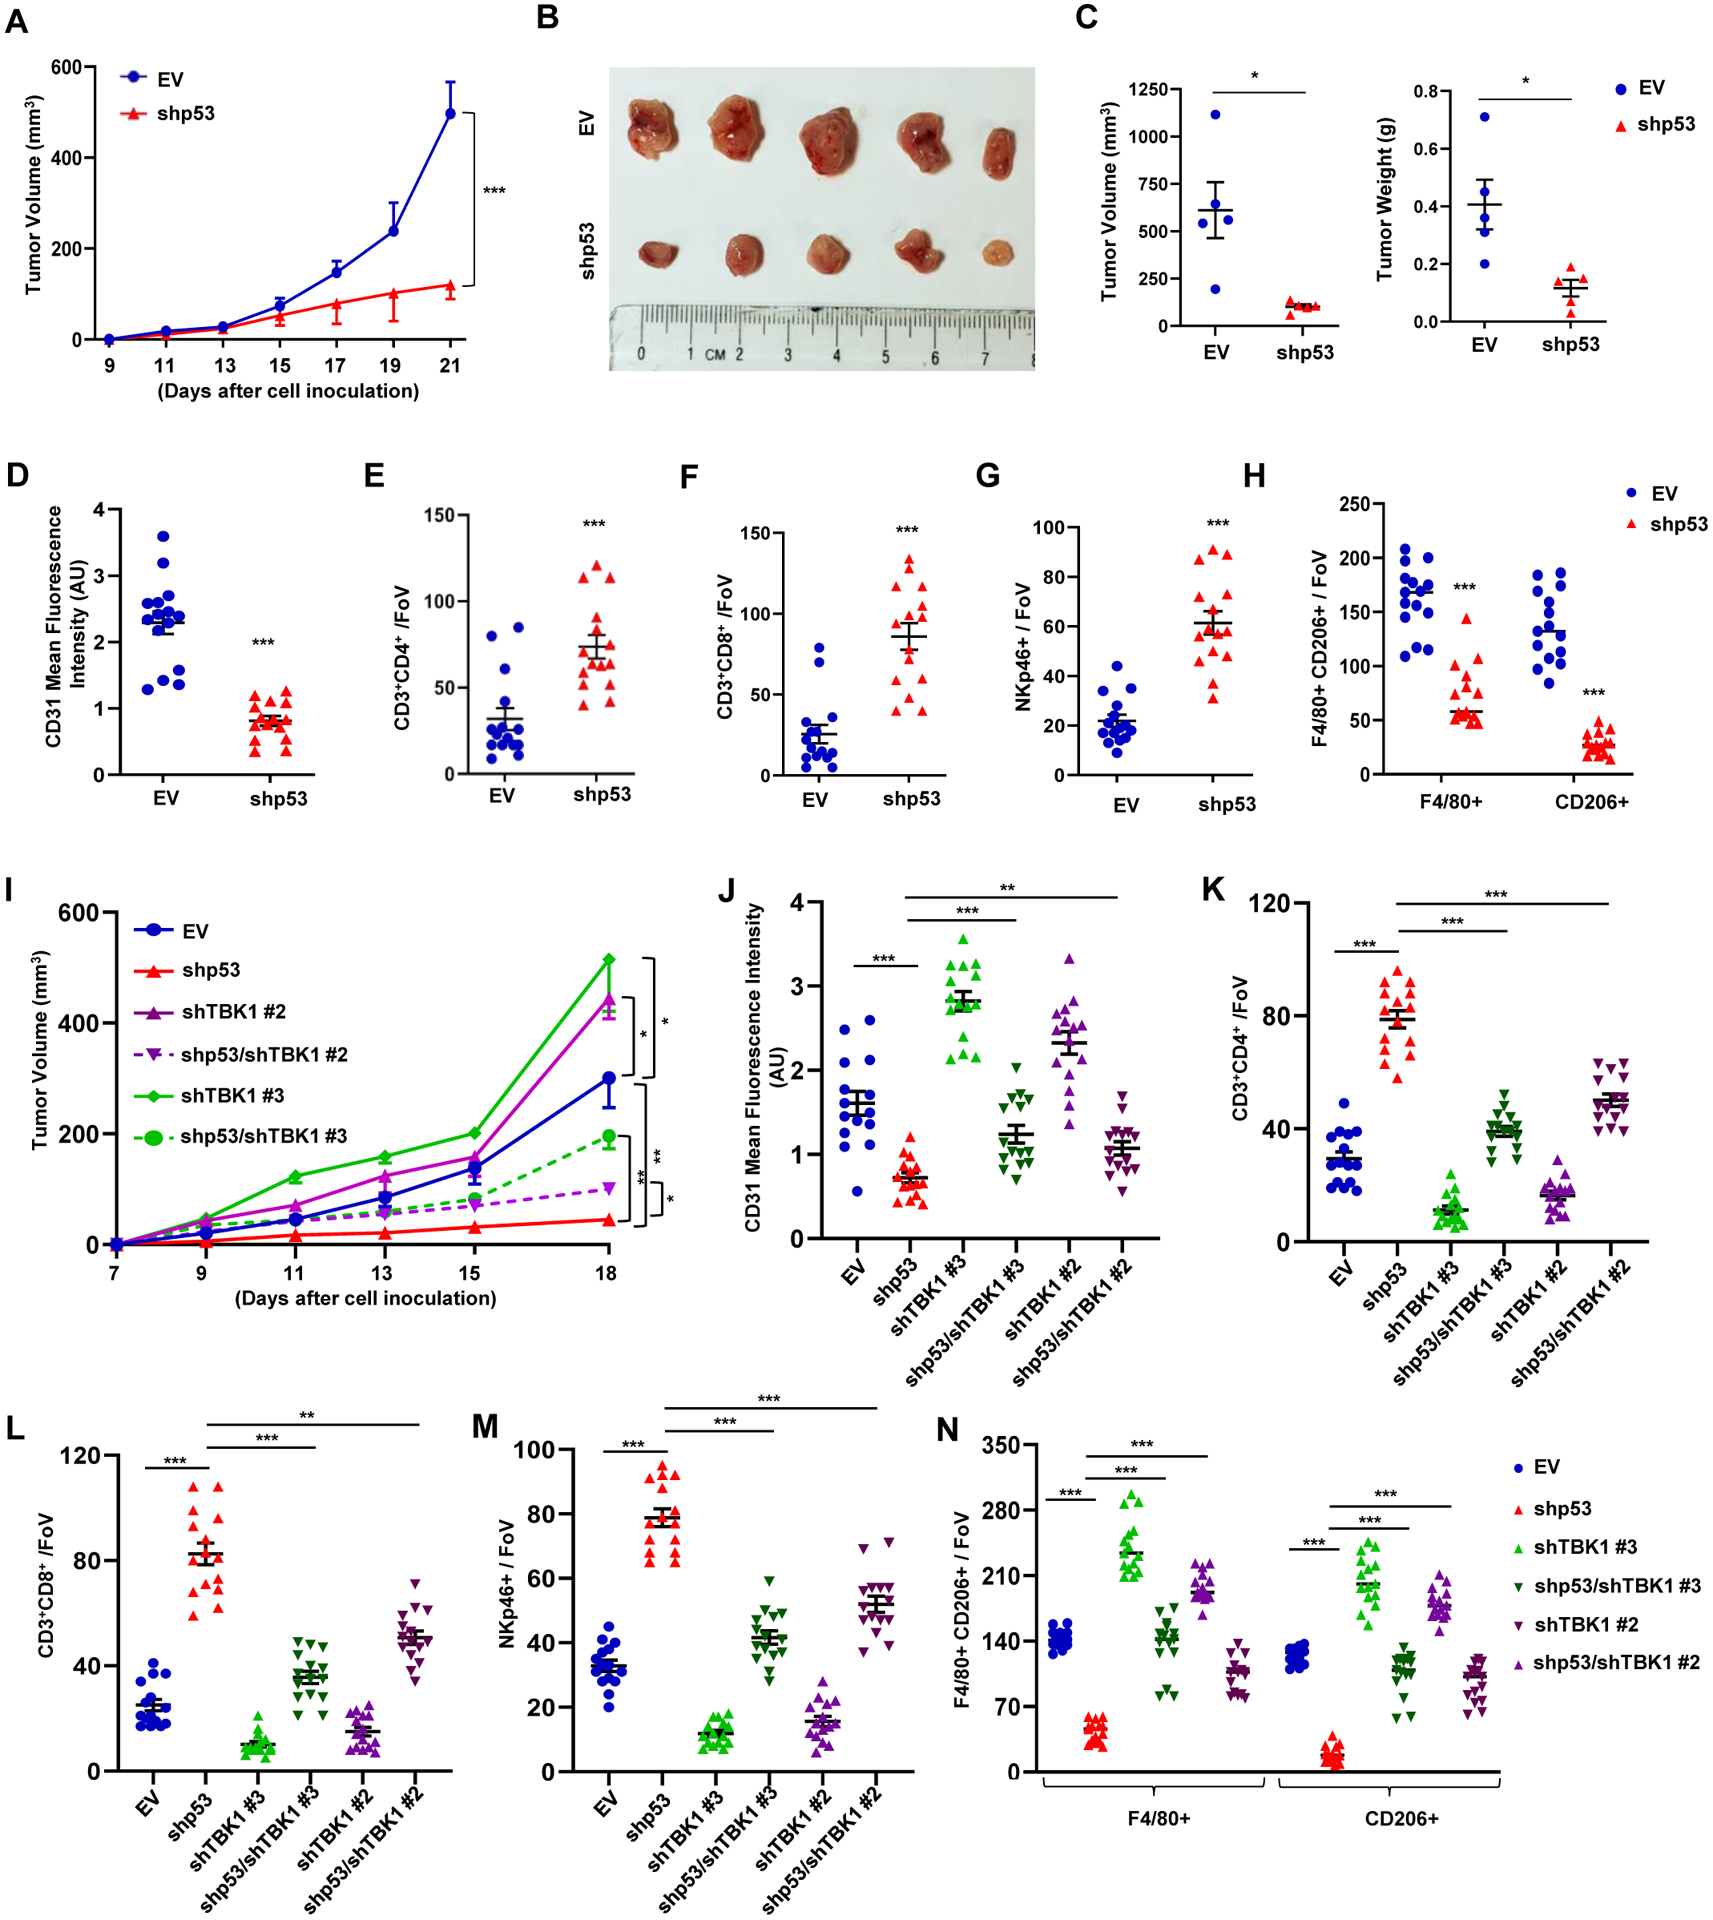
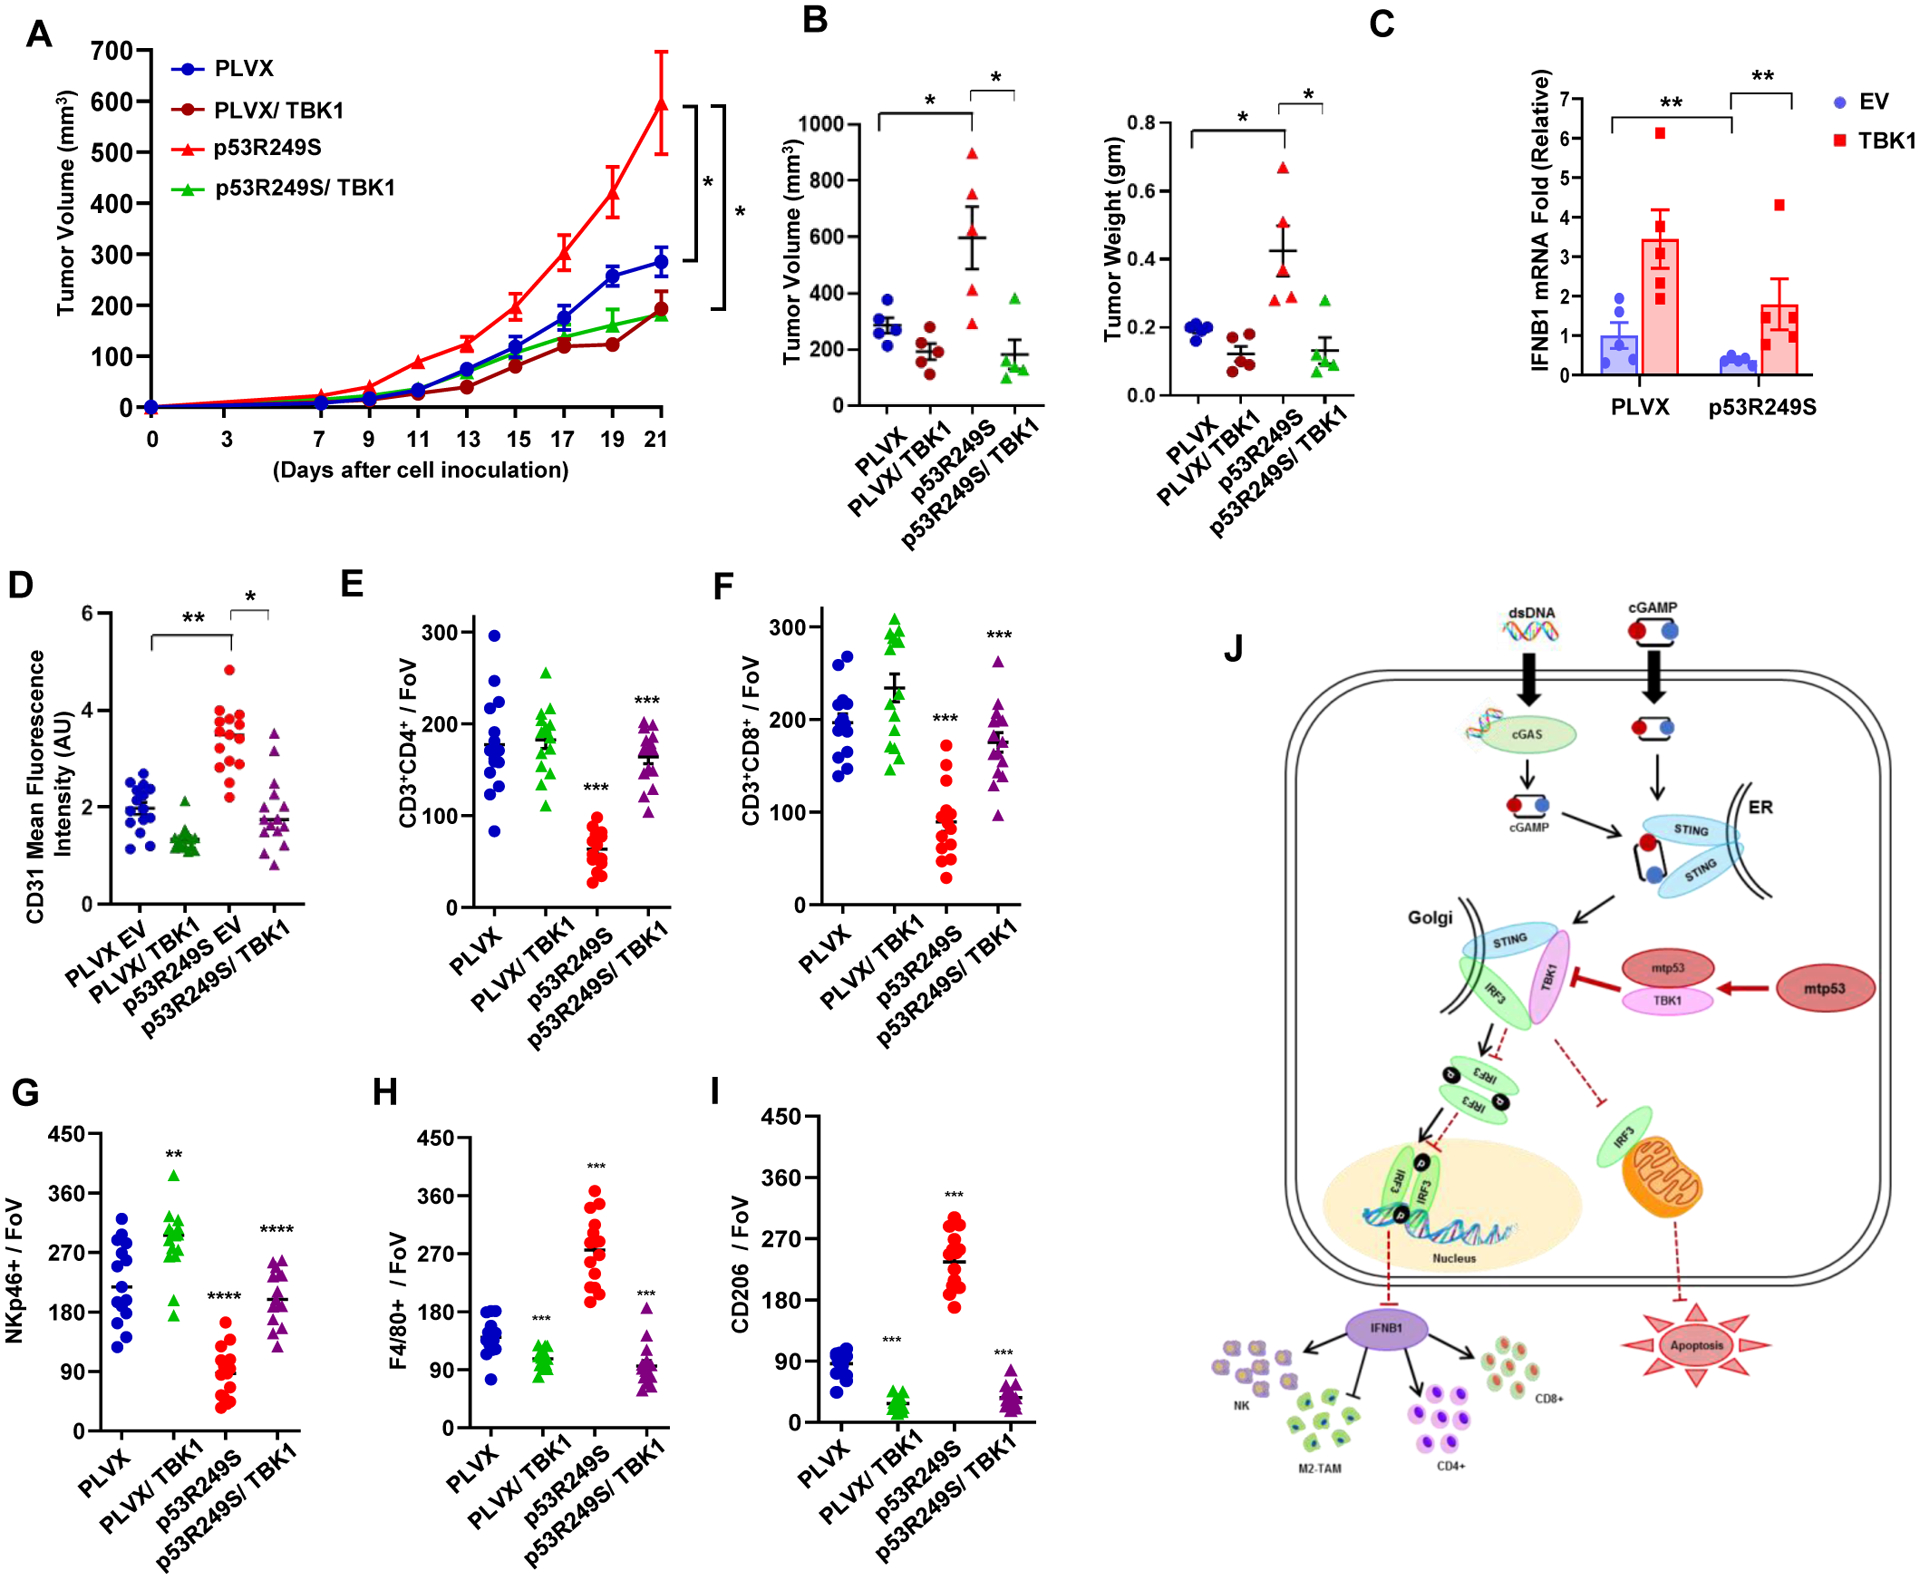
Mutant p53 (mtp53) proteins can exert cancer-promoting gain-of-function activities. We report a mechanism by which mtp53 suppresses both cell-autonomous and non-cell-autonomous signaling to promote cancer cell survival and evasion of tumor immune surveillance. Mtp53 interferes with the function of the cytoplasmic DNA sensing machinery, cGAS-STING-TBK1-IRF3, that activates the innate immune response. Mtp53, but not wild-type p53, binds to TANK-binding protein kinase 1 (TBK1) and prevents the formation of a trimeric complex between TBK1, STING, and IRF3, which is required for activation, nuclear translocation, and transcriptional activity of IRF3. Inactivation of innate immune signaling by mtp53 alters cytokine production, resulting in immune evasion. Restoring TBK1 signaling is sufficient to bypass mtp53 and lead to restored immune cell function and cancer cell eradication. This work is of translational interest because therapeutic approaches that restore TBK1 function could potentially reactivate immune surveillance and eliminate mtp53 tumors.

Keywords: IRF3; STING; TBK1; immune evasion; innate immune signaling; mutant p53.


Conflict of interest statement

Declaration of interests The authors declare no competing interests.

Figures

Figure 1:
Figure 1:. Mutant p53 suppresses innate immune signaling.
(A-B) Western blot analysis of shRNA knockdown of mutant p53 in BT549 (A) and KPC cells (B). (C) Western blot analysis of p53−/− and p53R172H/R172H MEFs. (D) p53 null 4T1 cells engineered to express p53R249S were subjected to western blotting. (E, F and G) MIA PaCa-2 (E), KPC (F), and BT549 (G) cells with constitutive PLKO/shp53 exprssion or induced (ind.) empty vector (EV)/shp53 were treated with 2 μg/ml of HT-DNA for 3 h and harvested for western blot analysis. (H) p53−/− or p53R172H/R172H MEFs were treated with 2 μg/ml of HT-DNA for 3 h and harvested for western blot analysis. (I and J) p53 knockdown BT549 or KPC cells and mutant p53 expressing MEFs were treated with 2 μg/ml HT-DNA for 18 h, and harvested for either RT-PCR analysis of IFNB1mRNA (I) or ELISA detection of secreted IFNB1 in conditioned medium (J). (K) Western blot analysis of shRNA targeting cGAS and STING in presence and absence of mutant p53 in BT549 cells. (I, J) Data shown as mean +/− SD, p values are based on Student’s t test. ***p < 0.001, **p < 0.01, *p < 0.05. See also Figure S1 and Table S1.
Figure 2:
Figure 2:. Mutant p53 blocks IRF3 nuclear translocation and IRF3-induced apoptosis.
(A) Representative confocal images of H1299 cells stably expressing GFP-IRF3 that were either left uninduced or induced with doxycycline for 24 h to express p53R248W. Cells were treated with 2 μg/ml of HT-DNA for 3 h and stained for IRF3. Nuclei were stained with DAPI. Scale Bar 10 μm (B) Representative immunoblots of fractionated lysates of Doxycycline inducible p53 shRNA in BT549 and KPC cells. GAPDH and lamin B1 were used as loading controls for the cytoplasmic and nuclear fractions, respectively. (C) Quantification analysis of apoptotic death analyzed by flow cytometry of PLKO and shIRF3 H1299 cells treated with 2 μg/ml of HT-DNA for 24 h. Immunoblots (bottom) showing IRF3 knockdown efficiency. (D) H1299 cells with inducible p53R248W were left uninduced or induced with doxycycline and then treated with 2 μg/ml of HT-DNA for 24 h. Cells were harvested, stained with Annexin V-FITC and PI and subjected to flow cytometry analysis. Immunoblots (bottom) showing p53R248W induction efficiency. (E) Quantitation of apoptosis in non-target (NT) and IRF3KO BT549 cells with either PLKO or shp53, treated with 2 μg/ml HT-DNA for 24 h and analyzed for apoptosis using flow cytometry. Immunoblots (bottom) showing p53 KD efficiency in NT and IRF3KO set. (C-E) Data shown as mean +/− SD, p values are based on Student’s t test. ***p < 0.001, **p < 0.01, ns=non-significant. See also Figure S2
Figure 3:
Figure 3:. Mutant p53 prevents formation of the trimeric TBK1/STING/IRF3 complex.
(A) H1299 cells expressing inducible mutant p53R248W were induced with doxycycline 24 h and mutant p53 was immunoprecipitated from the whole cell lysate. Lysates and immunoprecipitates (IP) were analyzed by western blotting. B) Endogenous mutant p53 in MDA-MB-231 was immunoprecipitated with p53 antibody. Cell lysates and IP were analyzed by western blot. (C) Representative confocal microscopy images of TBK1 and p53 in MIA PaCa-2 and MDA MB-231 cell. Scale bar represents 10 μm. (D) H1299 cells were left uninduced or induced with Doxycycline for 24 h to express p53R248W and cotransfected with Myc-TBK1, GFP-IRF3 and HA-STING. Cells were lysed and Myc-TBK1 was immunoprecipitated with Myc antibody. Cell Lysates and IP were analyzed by western blot. (E) H1299 cells were induced to express p53R248W, transfected with GFP-IRF3 and treated with HT-DNA for 3 h. Cells were lysed and GFP-IRF3 was immunoprecipitated with GFP antibody. Whole cell lysate and IP were analyzed by western blot. (F) Myc-TBK1 was co-transfected with nine different mutant p53 and WT p53 in H1299 cells. Cells were lysed and p53 was immunoprecipitated. (G) H1299 cells were co-transfected with different mutant p53s and Myc-TBK1, GFP-IRF3, HA-STING and analyzed by western blot. (H) H1299 cells were transfected with Myc-TBK1 and seven different deletion mutants of HA-p53R248W. Cells were lysed and mutant p53 was immunoprecipitated using HA antibody. See also Figure S3
Figure 4:
Figure 4:. Mutant p53 tumors exhibit accelerated tumor growth in hosts with intact immune system.
(A) 5 × 10⁴ 4T1 cells expressing PLVX or p53R249S were injected into the mammary gland of immunocompetent female BALB/c mice (n=10). All mice were sacrificed on day 21 and graphical quantification represents the tumor growth rate in mice. (B) Representative image showing tumor volume difference in BALB/c mice. (C) Graphical quantification of difference in tumor volume and weight on day 21 in PLVX and p53R249S cohorts (n= 6). (D) 5 × 10⁴ 4T1 cells expressing PLVX or p53R249S were injected into the mammary gland of immunodeficient NOD/SCID mice (n=4). All mice were sacrificed on day 21 and graphical quantification represents the tumor growth rate in NOD/SCID mice. (E) Graphical quantification of difference in tumor volume and weight in PLVX and p53R249S cohorts in NOD/SCID mice (n=4). (F-G) Representative confocal micrographs of 4T1 tumor sections from immunocompetent (BALB/c) (F) and immunodeficient (NOD/SCID) (G) mice stained with the angiogenesis marker CD31, and representative quantification of the mean fluorescence intensity (MFI) of endothelial marker CD31 intensity (n=20 FoV). Scale bars=25 μm except in enlarged panel which is 100 μm. Data are shown as mean +/− SE. In scatter dot plots, each dot represent one mouse, p values are based on Student’s t test. ***p < 0.001, **p < 0.01, *p < 0.05, ns=non-significant. See also Figure S4
Figure 5:
Figure 5:. Mutant p53 suppresses immune surveillance to support tumor growth in vivo.
4T1 tumors in BALB/c mice were resected on day 21, cut into pieces for western, RT-PCR and IHC analysis. (A) Tumor tissue was subjected to western blot analysis. (B) Representative graph indicates pIRF3 band intensity in 4T1 PLVX and p53R249S tumors. (C) RNA was isolated from tumors and subjected to RT-PCR for IFNB1. (D-E) Representative confocal micrographs of CD3+CD4+ T-helper (D) and CD3+CD8+ T-cytotoxic lymphocytes (E) infiltration. Graphs showed quantification of CD3+CD4+ T-helper and CD3+CD8+ T-cytotoxic lymphocytes (n=20 FoV)) (F) Representative confocal micrographs of expression of the NK cell marker, NKp46, in 4T1 PLVX and p53R249S tumor sections and quantification of NK cell recruitment (n=20 FoV). (G) Representative confocal images depicting the F4/80+CD206+ M2 type of TAMs in PLVX and p53R249S expressing tumors isolated from BALB/c mice on day 21 and quantitation of F4/80+/CD206+ TAMs (n=20 FoV). Scale bars=25 μm except in enlarged panel which is 100 μm. Data are shown as means +/− SE, p values are based on Student’s t test. ***p < 0.001, *p < 0.05. See also Figure S5
Figure 6:
Figure 6:. Loss of mutant p53 triggers immune surveillance in a TBK1-dependent manner.
(A) KPC inducible EV or shp53 (1×10⁵) cells were injected subcutaneously in male C57BL/6 mice. Doxycycline (20 mg/kg) was given orally every other day to all the mice to induce either EV or shp53 starting from day 4. Tumor volume was monitored and measured manually using slide calipers (n=5). (B) KPC tumor harboring mice were sacrificed on day 21 and representative images show tumor volume difference between EV and shp53. (C) Representative graphical quantification of difference in tumor volume and weight on day 21 in EV and shp53 KPC tumor cohorts. (D) Representative graph indicates quantitation of mean fluorescence intensity of CD31 in EV and shp53 tumors (n=15 FoV). (E-F) Representative graphs showed quantification of CD3+CD4+ T-helper (E) and CD3+CD8+ cytotoxic T-lymphocytes (F) (n=15 FoV). (G-H) NKp46+ NK cells (G) and F4/80+/CD206+ TAMs (H) in EV and shp53 tumor sections (n=15 FoV). (I) Inducible EV or shp53 (1×10⁵) KPC cells infected with a control or TBK1 shRNA were injected subcutaneously in C57BL/6 mice. Doxycycline (20 mg/kg) was given orally every other day to all the mice to induce either EV or shp53 starting from day 4. Tumor volume was monitored and measured manually using slide calipers (n=5). (J) Representative graph indicates quantitation of mean fluorescence intensity of CD31 in indicated tumors (n=15 FoV). (K-L) Representative graphs showed quantification of CD3+CD4+ T-helper (K) and CD3+CD8+ cytotoxic T-lymphocytes (L). (M-N) NK cells (M) and F4/80+/CD206+ TAMs (N) in indicated tumor sections (n=15). Data are shown as mean +/− SE, p values are based on Student’s t test. ***p < 0.001, *p < 0.05. See also Figure S6
Figure 7:
Figure 7:. Ectopic TBK1 expression overrides mutant p53’s effect.
(A) 5 × 10⁴ PLVX or p53R249S inducible EV or TBK1 4T1 cells were injected in the mammary fat pad of female BALB/c mice. Doxycycline was administered from day 5 and tumor volume was measured (n=5). (B) Graphical quantification showing the tumor volumes and weight differences of different cohorts. (C) Mice were sacrificed on day 21; tumors were excised, and RNA was isolated. Representative graph indicate quantitative mRNA expression of IFNB1. (D) Graphical quantification depicting quantification of CD31 intensity in the indicated cohort (n=15). (E-I) Representative quantitation from the cryo-section of different tumor cohorts of CD3+CD4+ T-helper cells (E), CD3+CD8+ T-cytotoxic subsets (F), NKp46+ NK cells (G), and F4/80+ (H) and CD206+ (I) M2-like macrophage subsets (n=15). (J) Schematic representation of mutant p53 disabling the innate immune response signaling pathway. Mutant p53 expressing cells fail to activate the type I interferon response and alter immune surveillance (non-cell autonomous) and also suppress mitochondria mediated apoptosis (cell autonomous). Data shown as means +/− SE, p values are based on Student’s t test. ***p < 0.001, **p < 0.01, *p < 0.05. See also Figure S7

Comment in

References

    1. Ablasser A, and Chen ZJ (2019). cGAS in action: Expanding roles in immunity and inflammation. Science 363. - PubMed
    1. Almine JF, O’Hare CA, Dunphy G, Haga IR, Naik RJ, Atrih A, Connolly DJ, Taylor J, Kelsall IR, Bowie AG, et al. (2017). IFI16 and cGAS cooperate in the activation of STING during DNA sensing in human keratinocytes. Nat Commun 8, 14392. - PMC - PubMed
    1. Bakhoum SF, and Cantley LC (2018). The Multifaceted Role of Chromosomal Instability in Cancer and Its Microenvironment. Cell 174, 1347–1360. - PMC - PubMed
    1. Bakhoum SF, Ngo B, Laughney AM, Cavallo JA, Murphy CJ, Ly P, Shah P, Sriram RK, Watkins TBK, Taunk NK, et al. (2018). Chromosomal instability drives metastasis through a cytosolic DNA response. Nature 553, 467–472. - PMC - PubMed
    1. Barber GN (2015). STING: infection, inflammation and cancer. Nat Rev Immunol 15, 760–770. - PMC - PubMed

Publication types

MeSH terms