. 2021 May 5;29(5):1862-1882.
doi: 10.1016/j.ymthe.2021.01.033. Epub 2021 Feb 3.

Enforced dimerization between XBP1s and ATF6f enhances the protective effects of the UPR in models of neurodegeneration

Affiliations

Enforced dimerization between XBP1s and ATF6f enhances the protective effects of the UPR in models of neurodegeneration

René L Vidal et al. Mol Ther. .

Abstract

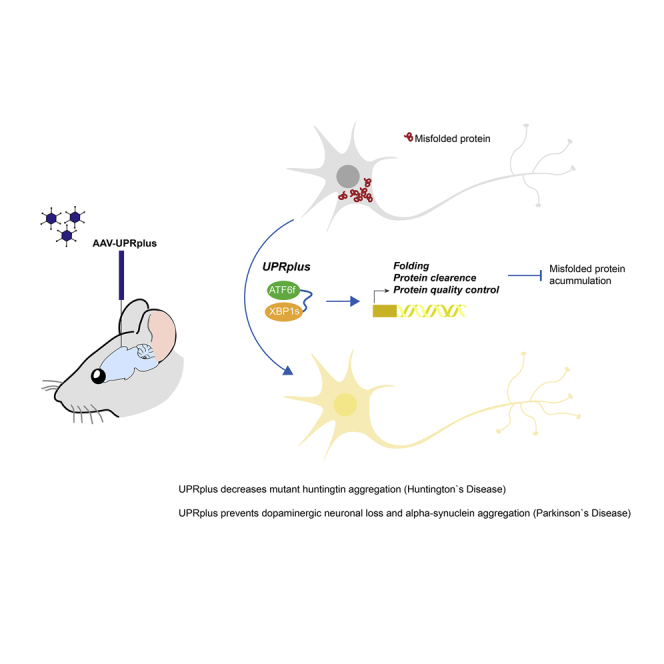
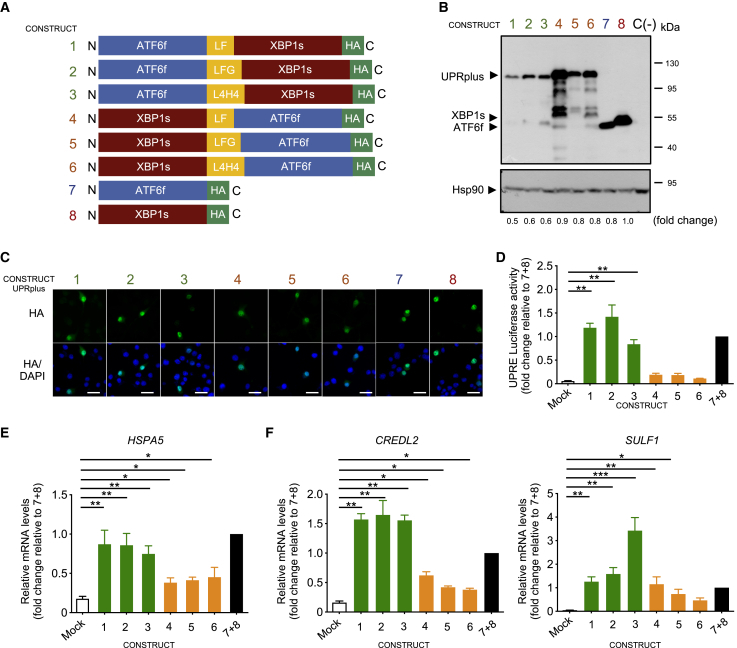
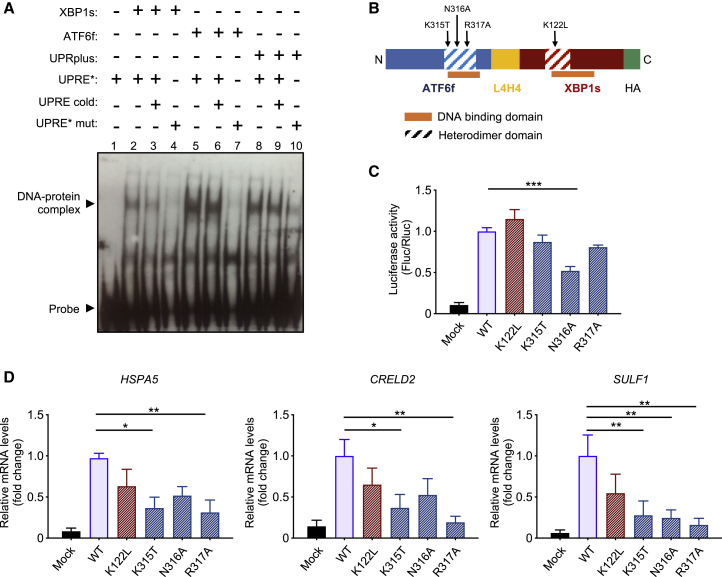
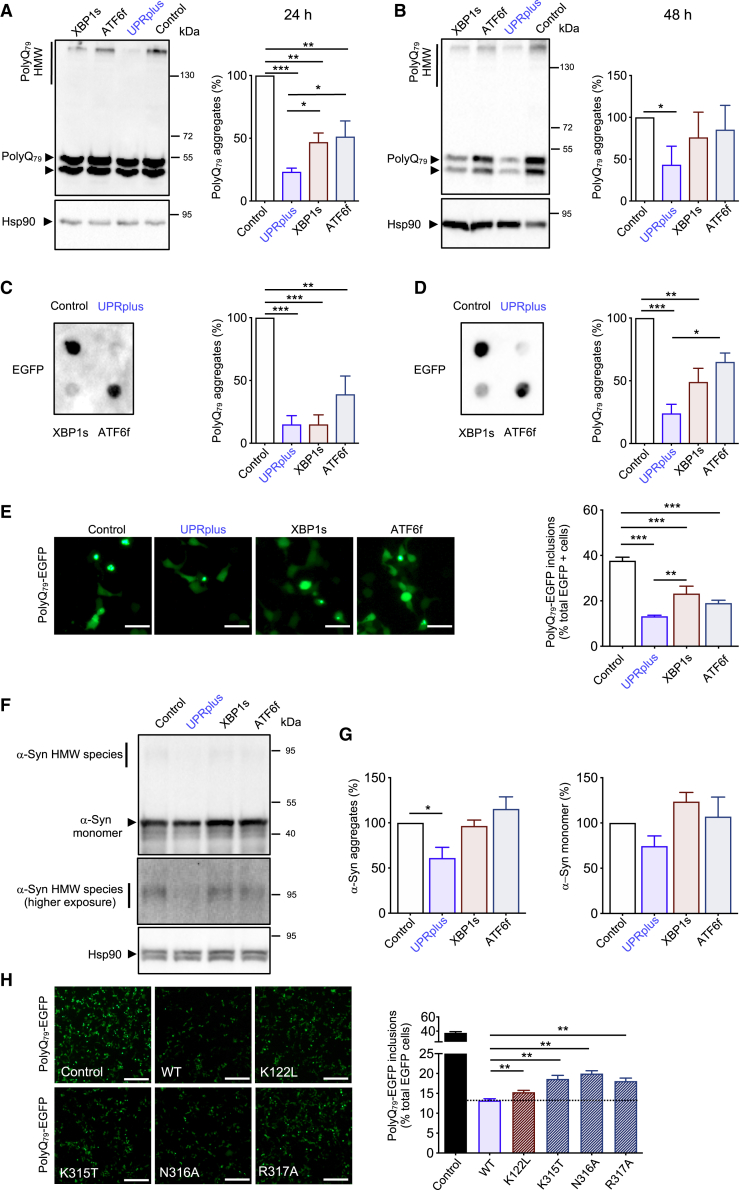
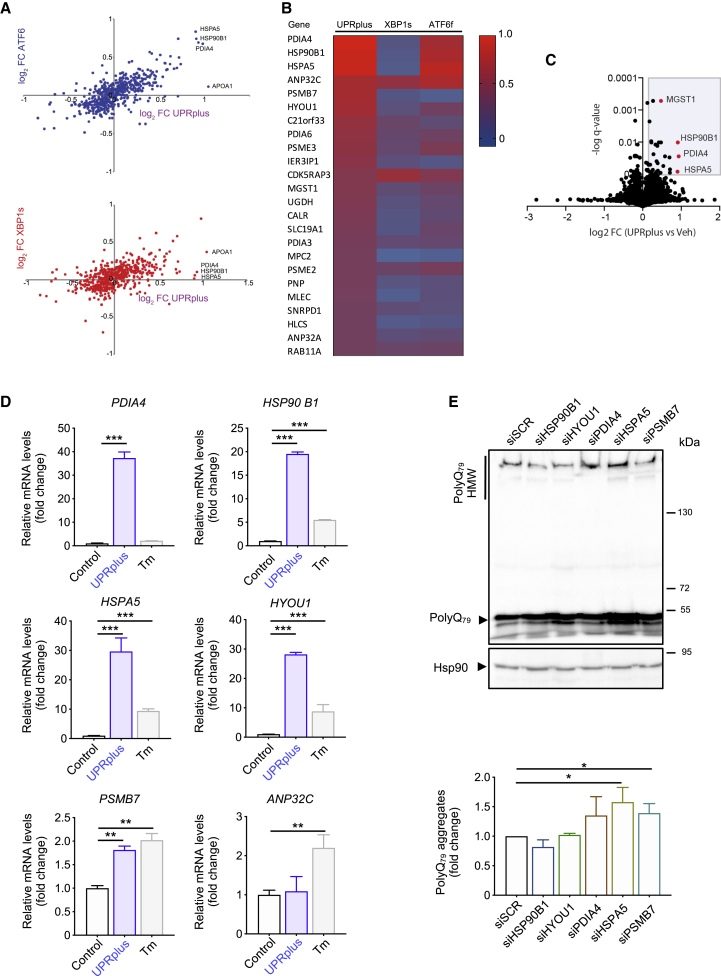
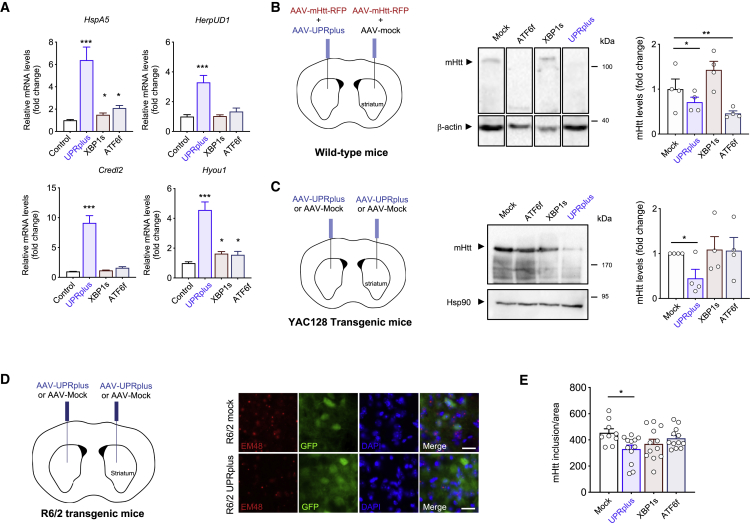
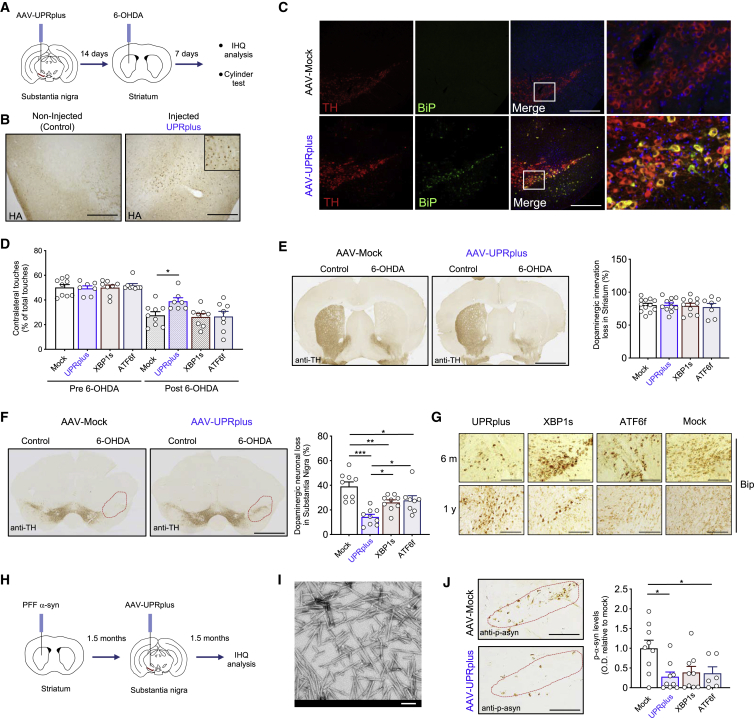
Alteration to endoplasmic reticulum (ER) proteostasis is observed in a variety of neurodegenerative diseases associated with abnormal protein aggregation. Activation of the unfolded protein response (UPR) enables an adaptive reaction to recover ER proteostasis and cell function. The UPR is initiated by specialized stress sensors that engage gene expression programs through the concerted action of the transcription factors ATF4, ATF6f, and XBP1s. Although UPR signaling is generally studied as unique linear signaling branches, correlative evidence suggests that ATF6f and XBP1s may physically interact to regulate a subset of UPR target genes. In this study, we designed an ATF6f/XBP1s fusion protein termed UPRplus that behaves as a heterodimer in terms of its selective transcriptional activity. Cell-based studies demonstrated that UPRplus has a stronger effect in reducing the abnormal aggregation of mutant huntingtin and α-synuclein when compared to XBP1s or ATF6 alone. We developed a gene transfer approach to deliver UPRplus into the brain using adeno-associated viruses (AAVs) and demonstrated potent neuroprotection in vivo in preclinical models of Parkinson's disease and Huntington's disease. These results support the concept in which directing UPR-mediated gene expression toward specific adaptive programs may serve as a possible strategy to optimize the beneficial effects of the pathway in different disease conditions.

Keywords: ATF6; ER stress; Huntington`s disease; Parkinson`s disease; UPR; XBP1; protein aggregation.


Conflict of interest statement

Declarations of interest R.L.V. and C.H. protected the use of a gene therapy to deliver UPRplus into the brain to treat Parkinson’s disease and Huntington’s disease. UPRplus is a registered brand in Chile. The patent is licensed to Handl Biotech, Belgium (https://patents.google.com/patent/WO2017075729A1/es).

Figures

None
Graphical abstract
Figure 1
Figure 1
Generation of ATF6f and XBP1s fusion constructs (A) Diagram of AAV constructs generated to deliver active UPR transcription factors. Different artificial heterodimers were generated by fusing ATF6f and XBP1s using three different linker sequences (yellow boxes) by combining their positions in the C-terminal and N-terminal regions. All constructs contain an HA tag at the C-terminal region (green box) for detection of the expression of the transgene. (B) HEK293T cells were transiently transfected with the six fusion constructs described in (A), in addition to XBP1s-HA or ATF6f-HA alone and empty vector C (–). After 48 h of expression, cell extracts were analyzed by western blot using an anti-HA antibody. Hsp90 was monitored as a loading control. Fold changes are shown related to XBP1s expression levels. (C) In parallel, cells described in (B) were analyzed by immunofluorescence using an anti-HA antibody (green). Co-staining with the nuclear marker Hoechst (blue) was performed. Scale bars, 10 μm. (D) HEK293T cells were transiently co-transfected with the six variants of pAAV-UPRplus or single constructs together with the UPRE-luciferase reporter and Renilla constructs. After 48 h luciferase activity was measured using a luminometer. (E and F) HEK293 cells were transiently transfected with the six versions of UPRplus or control vectors. After 48 h, the mRNA levels of the indicated UPR-target gene were measured by real-time RT-PCR. All samples were normalized to β-actin levels. mRNA levels are expressed as fold increase over the value obtained in control cells transfected with an equivalent 1:1 mixture of individual XBP1s and ATF6f expression vectors. In (D) and (E), the mean and standard error are presented for three independent experiments. Statistical analysis was performed using Dunnett’s multiple comparison test. ∗p < 0.05, ∗∗p < 0.01, ∗∗∗p < 0.001.
Figure 2
Figure 2
UPRplus binds to a UPR response element and requires the dimerization interface for gene expression regulation (A) Nuclear extracts obtained from HEK293T cells transfected with pAAV-XBP1s-HA (lanes 2–4), pAAV-ATF6f-HA (lanes 5–7), pAAV-UPRplus-HA (lanes 8–10), or empty vector were incubated with labeled UPRE∗ probe. As a control, the competition was performed with unlabeled (cold probe, lanes 3, 6, or 9) or mutated probes (UPRE∗ mut, lines 7, 4, or 10). The asterisk represents the labeled probe. The DNA-protein complexes were separated on non-denaturing polyacrylamide gels and analyzed by western blot using an anti-biotin antibody. (B) Schematic representation of the UPRplus construct is indicated, highlighting the heterodimer domains of both ATF6f and XBP1s (dashed boxes). Point mutations generated in these domains are indicated. Yellow box indicates the linker region; green box indicates the HA tag. (C) HEK293T cells were transiently co-transfected with UPRplus (UPRplus wild-type [WT]) or four single mutant versions of (K122L, K315T, N316A, and R317A), in addition to empty vector (mock) together with the UPRE-luciferase reporter and Renilla constructs. After 48 h, luciferase activity was measured using a luminometer. (D) HEK293T cells were transiently transfected with DNA constructs described in (C) and after 24 h, HSPA5, CRELD2, and SULF1 mRNA levels measured by real-time RT-PCR. All samples were normalized to β-actin levels. mRNA levels are presented as fold increase over the value obtained in control cells transfected with the UPRplus WT version. In (C) and (D), the mean and standard error are presented for three independent experiments. Statistical analysis was performed using Dunnett’s multiple comparison test. ∗p < 0.05, ∗∗p < 0.01.
Figure 3
Figure 3
UPRplus expression reduces mutant huntingtin and α-synuclein aggregation (A and B) Neuro2A cells were transiently co-transfected with expression vectors for polyQ79-EGFP and XBP1s, ATF6f, UPRplus, or empty vector (control). After 24 (A) or 48 h (B), polyQ79-EGFP detergent-insoluble aggregates were measured in cell extracts prepared in Triton X-100 by western blot. Levels of Hsp90 were measured as the loading control. Left panel: high molecular weight (HMW) polyQ79-EGFP aggregates were quantified. (C and D) PolyQ79-EGFP detergent-insoluble aggregates were measured by filter trap assay after 24 (C) or 48 h (D) of transfection (right panel). Left panels: polyQ79-EGFP aggregates were quantified. (E) In cells described in (A), polyQ79-EGFP intracellular inclusions were quantified after 48 h of expression by fluorescence microscopy (right panel). Scale bars, 20 μm. Left panel: the number of cells displaying intracellular inclusions was quantified in a total of at least 300 cells per experiment. (F) HEK293T cells were transiently co-transfected with expression vectors for α-synuclein-RFP (α-syn) together with expression vectors for UPRplus, ATF6f, XBP1s, or empty vector (control). After 48 h, α-syn aggregates were measured in cell extracts prepared in 1% Triton X-100 by western blot (upper panel). Middle panel: higher exposure of the upper panel highlighting HMW species of α-syn. Levels of Hsp90 were monitored as the loading control (lower panel). (G) α-Syn-RFP HMW species (left panel) and α-syn monomers (right panel) were quantified. (H) Neuro2A cells were transiently co-transfected with expression vectors for polyQ79-EGFP together with empty vector (control), UPRplus WT, or the UPRplus mutants K122L, K315T, N316A, and R317A. After 48 h, the accumulation of polyQ79-EGFP intracellular inclusions was visualized by fluorescence microscopy (right panel). Scale bars, 100 μm. Left panel: the number of cells displaying intracellular inclusions was quantified in a total of at least 300 cells per experiment. In (A)–(G), the mean and standard error are presented for three independent experiments. In (G), four independent experiments were quantified. Statistical analysis was performed using Dunnett’s multiple comparison test. ∗p < 0.05, ∗∗p < 0.01).
Figure 4
Figure 4
UPRplus expression remodels proteostasis pathways (A) Quantitative proteomics was performed in protein extracts from HEK293T cells infected for 48 h with the following viral particles: AAV-UPRplus, AAV-XBP1s, AAV-ATF6f, or AAV-empty (vehicle). The data were analyzed and plotted of log2 fold change (FC) for proteins identified in MuDPIT analysis. Plot showing the correlation between gene expression in cells expressing UPRplus or ATF6f (upper panel) and UPRplus or XBP1s (bottom panel). Only genes whose expression is significantly affected (false discovery rate [FDR] < 0.01) are shown. (B) Heatmap analysis showing differential protein expression patterns in ATF6f, XBP1s, or UPRplus overexpression conditions. Color from red to blue indicates high to low expression. (C) Volcano plot showing the correlation between protein expression of HEK293T cells infected with AAV-UPRplus versus AAV-empty (vehicle) viral particles. Only genes whose expression is significantly affected (FDR < 0.01) are shown. (D) The mRNA levels of selected UPR-upregulated genes were monitored in HEK293T cells infected with AAV-empty (control) or AAV-UPRplus viral particles. After 48 h the relative mRNA levels of the indicated genes were measured by real-time RT-PCR. As a positive control, cells were treated with 1 μg/mL tunicamycin (Tm) for 8 h. All samples were normalized to β-actin levels. mRNA levels are expressed as fold increase over the value obtained in the control condition. (E) HEK293T cells were transiently transfected with siRNA against the six top gene genes upregulated by UPRplus. A scrambled siRNA (siScr) was used as a control. 24 h later cells were transfected with a polyQ79-EGFP expression vector followed by western blot analysis after 24 h of expression. Levels of Hsp90 were analyzed as a loading control. Bottom panel: polyQ79-EGFP high molecular weight (HMW) species were quantified. In (D) and (E), the mean and standard error are presented of three independent experiments. Statistical analysis was performed using Dunnett’s multiple comparison test. ∗p < 0.05, ∗∗p < 0.01, ∗∗∗p < 0.001.
Figure 5
Figure 5
UPRplus expression decreases mutant huntingtin aggregation in vivo (A) Primary cortical neurons were infected at 1 day in vitro (DIV) with adeno-associated virus (AAV) encoding for UPRplus, ATF6f, XBP1s, or empty vector (control). After 6 DIV, expression levels of UPR-target genes were measured by real-time RT-PCR. All samples were normalized to β-actin levels. mRNA levels are expressed as fold increase over the value obtained in control cells infected with AAV-empty (control). (B) Three-month-old WT mice were co-injected into the striatum by stereotaxis with a mixture of AAVs encoding a mHtt construct (Htt588Q95-mRFP) together with AAV-UPRplus, AAV-XBP1s, AAV-ATF6f, or AAV-mock (control). Schematic representation of the experimental strategy is shown (left panel). Animals were then euthanized at 2 weeks post-injection and brain striatum tissue was dissected for western blot analysis using an anti-polyQ antibody. β-Actin levels were analyzed as a loading control (middle panel). HMW mHtt aggregates were quantified and normalized to β-actin levels (right panel) (AAV-mock, n = 4; AAV-UPRplus, n = 4; AAV-XBP1s, n = 4; AAV-ATF6f, n = 4). (C) Three-month-old YAC128 mice were injected into the striatum with AAV-UPRplus, AAV-ATF6f, AAV-XBP1s, or AAV-mock vector (control) using bilateral stereotaxis surgery. Schematic representation of the experimental strategy is shown (left panel). Four weeks later the striatum region was dissected and mHtt aggregation levels were analyzed by western blot using an anti-polyQ antibody (middle panel). mHtt aggregate levels were quantified and normalized to Hsp90 levels (right panel). In (B) and (C), the mean and standard error are presented for the analysis of four animals per group. (D) R6/2 mice were injected at 4 weeks of age with a mixture of AAV-EGFP and AAV-XBP1s (n = 4), AAV-ATF6f (n = 4), AAV-UPRplus (n = 4), or AAV-mock (control) (n = 3) into the striatum using bilateral stereotaxis (left panel). Four weeks after injection, the brain was extracted and coronal slices from the striatum were obtained. mHtt was detected using the anti-huntingtin EM48 antibody (red) by fluorescence microscopy (red). EGFP expression was monitored as control for the injection (green). Nuclei were stained using DAPI (blue) (scale bars, 20 μm) (right panel). (E) High-resolution images of the slices were obtained and quantification of mHtt was performed using ImageJ software. The quantification of the number of mHtt inclusions was performed by total area. Statistical analysis was performed using Dunnett’s multiple comparison test. ∗p < 0.05, ∗∗p < 0.01.
Figure 6
Figure 6
UPRplus protects dopaminergic neurons in a preclinical model of PD (A) Experimental design to evaluate the effects of UPRplus in a pharmacological PD model. Animals were injected with AAV particles expressing UPRplus or control vectors into the substantia nigra pars compacta (SNpc) using brain stereotaxis. Two weeks later, animals were exposed to 6-OHDA into the striatum followed by behavioral and histological analyses 1 week later. (B) The expression of UPRplus was monitored in the brain using immunohistochemistry with an anti-HA antibody (scale bars, 200 μm). (C) Immunofluorescence analysis of tyrosine hydroxylase (TH; red) and BiP (green) was performed in brain tissue derived from AAV-mock-injected (upper) or AAV-UPRplus-injected (bottom) animals. Hoechst staining of the nucleus was also performed. The third panel shows merged images of the three stainings (scale bars, 200 μm). Right panel shows high magnification of the white square region of merged images. (D) Three-month-old WT mice were injected with AAV-UPRplus, AAV-ATF6f, AAV-XBP1s, or AAV-mock (control) into the SNpc and then exposed to 6-OHDA as described in (A). Quantification of the percentage of contralateral touches relative to total touches (both forepaws) obtained before and 1 week after the injection of 6-OHDA (before and after 6OHDA) is indicated. Data represent the mean and standard error of six to eight animals per group. (E) Immunohistochemistry analysis was performed in striatal sections from animals described in (D) to quantify 6-OHDA-induced denervation in both injected (6-OHDA) and non-injected (control) hemispheres (scale bar, 1 mm) (left panel). The integrated density of pixel intensity was calculated from images of anti-TH immunohistochemistry covering the entire striatum and expressed as the percentage of TH loss relative to the control side. Data represent the mean and standard error from six to eight animals per group (right panel). (F) Immunohistochemistry analysis was performed in midbrain sections from mice described in (D) to quantify 6-OHDA-induced dopaminergic neuronal loss in both injected (6-OHDA) and non-injected (control) sides (scale bar, 1 mm) (left panel). The total content of TH-positive somas was measured in midbrain sections covering the entire SNpc, in the non-injected (control) and injected (6-OHDA) side, for each group. Data represent the mean and standard error from 6 to 10 animals per group (right panel). (G) The expression of BiP was monitored in the brain obtained from AAV-UPRplus-, AAV-ATF6f-, AAV-XBP1s-, or AAV-mock-injected animals for 6 months (upper panel) or 1 year (bottom panel) using immunohistochemistry with an anti-BiP antibody. (scale bars, 100 μm). (H) Experimental design to evaluate the effects of UPRplus in an idiopathic PD model. Animals were injected with PFF α-synuclein into the striatum using brain stereotaxis. 1.5 months later, animals were injected with UPRplus or control vectors into the SNpc followed by histological analysis 1.5 months later. (I) Transmission electronic microscopy of sonicated α-synuclein-aggregated fibrils (scale bar, 100 nm). (J) Immunohistochemical analysis of the phosphorylated α-synuclein (p-α-syn) levels in the SNpc region (scale bars, 100 μm) (left panel). Quantification of the p-α-syn levels (integrated density) covering SNpc region. Values are expressed as the average and standard error. Mock, n = 9; UPRplus, n = 9; XBP1s, n = 9; ATF6f, n = 6 (right panel). Statistical analysis was performed using Dunnett’s multiple comparison test. ∗p < 0.05, ∗∗p < 0.01, ∗∗∗p < 0.001.

References

    1. Balch W.E., Morimoto R.I., Dillin A., Kelly J.W. Adapting proteostasis for disease intervention. Science. 2008;319:916–919. - PubMed
    1. Hiramatsu N., Chiang W.C., Kurt T.D., Sigurdson C.J., Lin J.H. Multiple mechanisms of unfolded protein response-induced cell death. Am. J. Pathol. 2015;185:1800–1808. - PMC - PubMed
    1. Walter P., Ron D. The unfolded protein response: from stress pathway to homeostatic regulation. Science. 2011;334:1081–1086. - PubMed
    1. Wang M., Kaufman R.J. Protein misfolding in the endoplasmic reticulum as a conduit to human disease. Nature. 2016;529:326–335. - PubMed
    1. Hetz C., Zhang K., Kaufman R.J. Mechanisms, regulation and functions of the unfolded protein response. Nat. Rev. Mol. Cell Biol. 2020;21:421–438. - PMC - PubMed

Publication types

MeSH terms