

Improving CT accuracy in the diagnosis of COVID-19 in a hospital setting
- PMID: 33545516
- PMCID: PMC7846468
- DOI: 10.1016/j.clinimag.2021.01.026
Improving CT accuracy in the diagnosis of COVID-19 in a hospital setting
Abstract
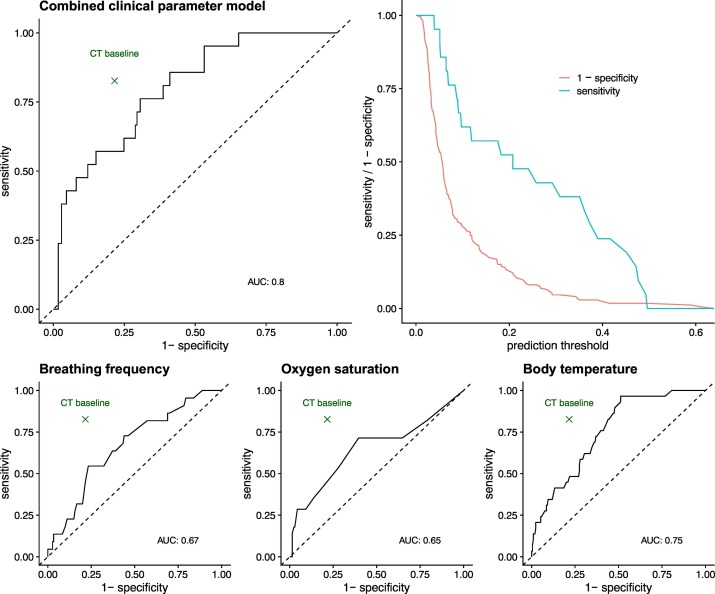
Objective: This study aimed to improve the accuracy of CT for detection of COVID-19-associated pneumonia and to identify patient subgroups who might benefit most from CT imaging.
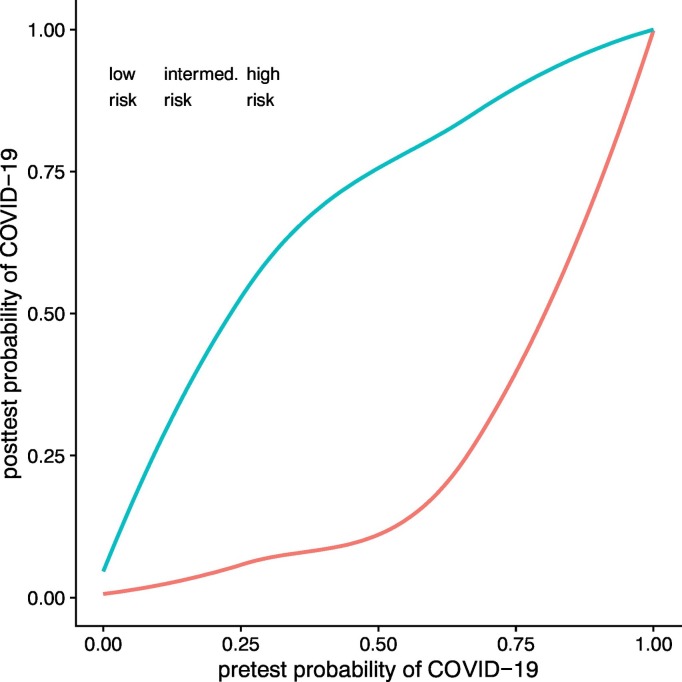
Methods: A total of 269 patients who underwent CT for suspected COVID-19 were included in this retrospective analysis. COVID-19 was confirmed by reverse-transcription-polymerase-chain-reaction. Basic demographics (age and sex) and initial vital parameters (O2-saturation, respiratory rate, and body temperature) were recorded. Generalized mixed models were used to calculate the accuracy of vital parameters for detection of COVID-19 and to evaluate the diagnostic accuracy of CT. A clinical score based on vital parameters, age, and sex was established to estimate the pretest probability of COVID-19 and used to define low, intermediate, and high risk groups. A p-value of <0.05 was considered statistically significant.
Results: The sole use of vital parameters for the prediction of COVID-19 was inferior to CT. After correction for confounders, such as age and sex, CT showed a sensitivity of 0.86, specificity of 0.78, and positive predictive value of 0.36. In the subgroup analysis based on pretest probability, positive predictive value and sensitivity increased to 0.53 and 0.89 in the high-risk group, while specificity was reduced to 0.68. In the low-risk group, sensitivity and positive predictive value decreased to 0.76 and 0.33 with a specificity of 0.83. The negative predictive value remained high (0.94 and 0.97) in both groups.
Conclusions: The accuracy of CT for the detection of COVID-19 might be increased by selecting patients with a high-pretest probability of COVID-19.
Keywords: Computed tomography; Prediction of COVID-19; Pretest probability; Vital parameters.
Copyright © 2021. Published by Elsevier Inc.
Conflict of interest statement
There are no competing interests to declare.
Figures
References
-
- Emanuel E.J., Persad G., Upshur R., Thome B., Parker M., Glickman A., et al. Fair allocation of scarce medical resources in the time of Covid-19. N Engl J Med. 2020;382:2049–2055. - PubMed
MeSH terms
LinkOut - more resources
Full Text Sources
Other Literature Sources
Medical
