Review
. 2021 Jan:120:111748.
doi: 10.1016/j.msec.2020.111748. Epub 2020 Nov 27.

Osteogenic differentiation cues of the bone morphogenetic protein-9 (BMP-9) and its recent advances in bone tissue regeneration

Affiliations
Review

Osteogenic differentiation cues of the bone morphogenetic protein-9 (BMP-9) and its recent advances in bone tissue regeneration

Angshuman Bharadwaz et al. Mater Sci Eng C Mater Biol Appl. 2021 Jan.

Abstract

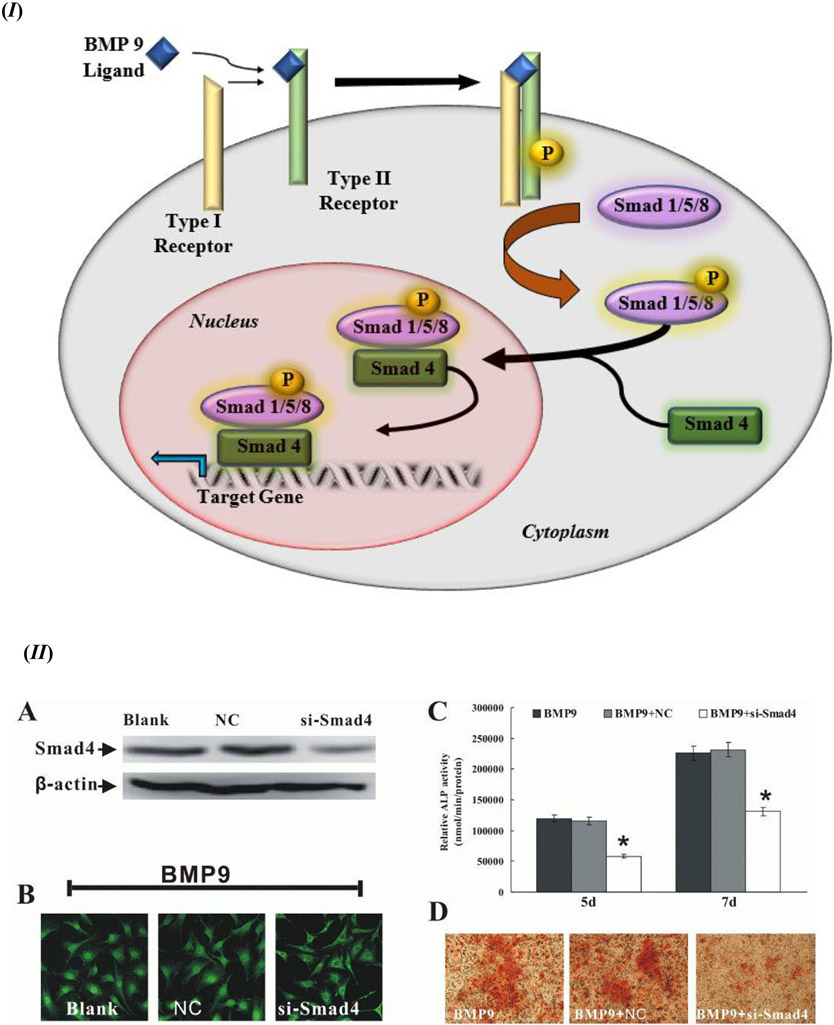
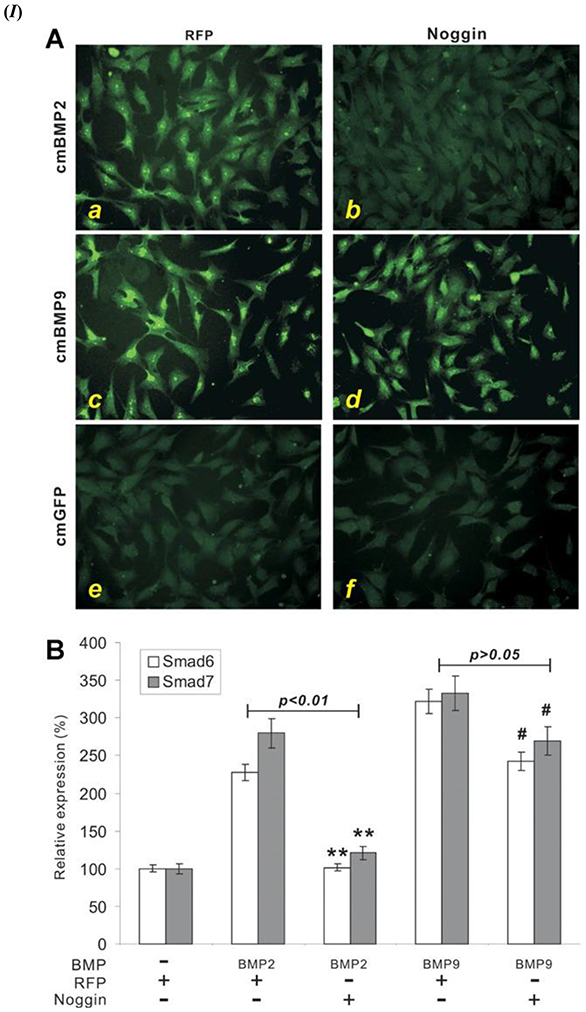
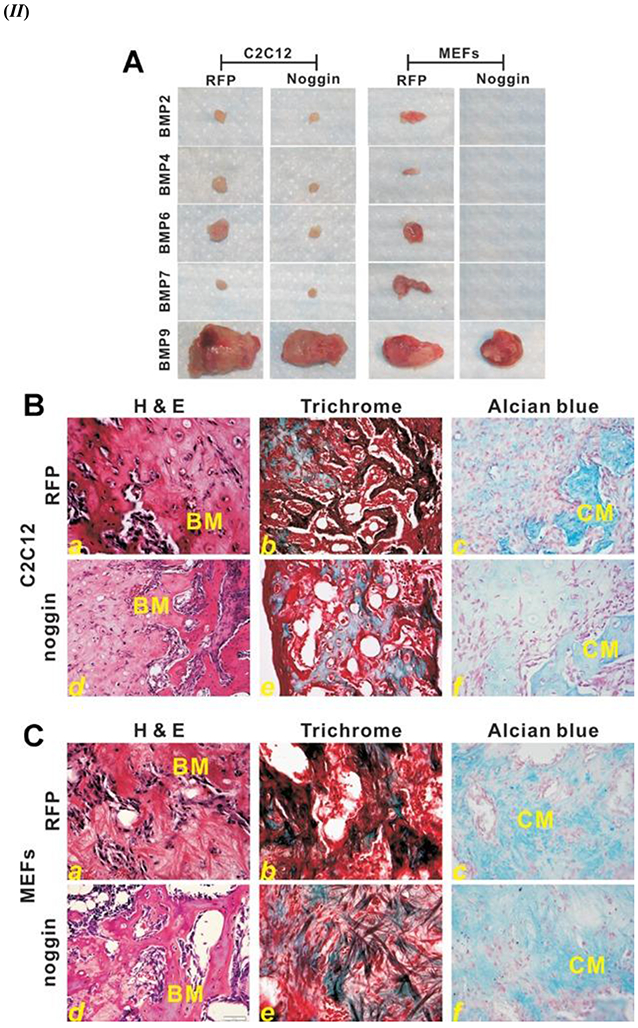
Bone regeneration using bioactive molecules and biocompatible materials is growing steadily with the advent of the new findings in cellular signaling. Bone Morphogenetic Protein (BMP)-9 is a considerably recent discovery from the BMP family that delivers numerous benefits in osteogenesis. The Smad cellular signaling pathway triggered by BMPs is often inhibited by Noggin. However, BMP-9 is resistant to Noggin, thus, facilitating a more robust cellular differentiation of osteoprogenitor cells into preosteoblasts and osteoblasts. This review encompasses a general understanding of the Smad signaling pathway activated by the BMP-9 ligand molecule with its specific receptors. The robust osteogenic cellular differentiation cue provided by BMP-9 has been reviewed from a bone regeneration perspective with several in vitro as well as in vivo studies reporting promising results for future research. The effect of the biomaterial, chosen in such studies as the scaffold or carrier matrix, on the activity of BMP-9 and subsequent bone regeneration has been highlighted in this review. The non-viral delivery technique for BMP-9 induced bone regeneration is a safer alternative to its viral counterpart. The recent advances in non-viral BMP-9 delivery have also highlighted the efficacy of the protein molecule at a low dosage. This opens a new horizon as a more efficient and safer alternative to BMP-2, which was prevalent among clinical trials; however, BMP-2 applications have reported its downsides during bone defect healing such as cystic bone formation.

Keywords: Bone morphogenetic protein (BMP); Bone regeneration; Cell signaling; Non-viral delivery; Scaffold; Smad.


Conflict of interest statement

Conflict of interest: none

Figures

Figure 1.
Figure 1.
(I) Schematic representation of a stem cell with the Smad signaling pathway activated by the binding of the BMP-9 ligand with the specific BMP-9 receptor. Smad 4 plays a critical role in nuclear translocation of the Smad complex that binds to its DNA promoter element to express the target gene. (II) Smads (1/5/8 as well as 4) are a quintessential component of the BMP-9 osteogenic differentiation cell signaling cascade. The cells used in this case were C3H10T1/2 mesenchymal stem cells: (A) Smad 4 knockdown (si-Smad4) was confirmed using Western Blot (β-actin used as a loading control); (B) C3H10T1/2 mesenchymal stem cells were transfected with Adenoviral-si-Smad 4 first and then exposed to BMP-9 conditioned medium. Immunochemistry staining after 4 h of BMP-9 exposure shows Smad 1/5/8 nuclear translocation (x40 magnification); (C) ALP activity detection at day 5 and day 7 after BMP-9 stimulation (after Smad 4 knockdown was carried out). * p value < 0.05 vs Negative Control (NC). Data collected from triplicates (mean ± SD); (D) Biomineralization, or calcium deposition after day 21 post-BMP-9 stimulation and Smad 4 knockdown (x100 magnification). Figure 1. (II) reprinted from [73] from BMB Reports; Open Access License (http://www.bmbreports.org/).
Figure 2.
Figure 2.
(I) BMP-9 triggered Smad signaling pathway is resistant to Noggin in Mesenchymal Stem Cells (MSCs). (A) Noggin inhibition of Smad activation in BMP 2. Adenoviral (Ad) expressing Noggin (Ad-Noggin) or Ad-Red Fluorescent Protein (RFP) were exposed to the C2C12 cells; cells were cultured overnight in Fetal Bovine Serum (1%) overnight. Three different media were categorized as cmBMP2 (a, b), cmBMP9 (c, d), and cmGFP (Green Fluorescent Protein) (e, f) in which the infected cells were treated for 2 h. Immunofluorescence staining using anti-Smad 1/5/8 antibody (from Santa Cruz Biotechnology); Negative control used for the experiment was either control IgG or absence of primary antibody staining. (B) Smad 6/7, induced by the BMP-9 signaling cascade, is expressed in the presence of Noggin; proves the resistance of BMP-9 towards Noggin inhibition. Sub confluent C2C12 cells were used for this experiment; these cells were infected with Ad-BMP 2/9 and Ad-Noggin or Ad-RFP for 30 h. Reverse transcription-polymerase chain reaction (RT-PCR) analysis using mouse Smad 6 and Smad 7 primers was done on the isolated total RNA from the infected cells. Normalization control used was GAPDH with triplicates done for all assays. Noggin vs. RFP expression (Smad 5 and Smad 7) ** p value < 0.01, # p value < 0.05. (II) Noggin resistance is displayed by BMP-9 during ectopic bone formation. (A). Ectopic bone masses formed with two different cell lines, C2C12 and mouse embryonic fibroblasts (MEFs), infected with the Ad-BMP-9 and then injected subcutaneously injected into athymic mice with and without Noggin. These samples were from 4 weeks post-injection. (B) Histological evaluation of the samples harvested from Ad-BMP-9 infected C2C12 cell injection site; (a) H& E staining, (b) Trichrome staining, and (c) Alcian blue staining. (C) Histological evaluation of the samples harvested from Ad-BMP-9 infected MEFs cell injection site; (a) H& E staining, (b) Trichrome staining, and (c) Alcian blue staining. X200 magnification. BM – Bone matrix; CM – chondroid or cartilage matrix. Figures 2. (I) and (II) reprinted from [45] with permission from John Wiley and Sons. Copyright © 2013 Orthopaedic Research Society. Published by Wiley Periodicals, Inc.
Figure 2.
Figure 2.
(I) BMP-9 triggered Smad signaling pathway is resistant to Noggin in Mesenchymal Stem Cells (MSCs). (A) Noggin inhibition of Smad activation in BMP 2. Adenoviral (Ad) expressing Noggin (Ad-Noggin) or Ad-Red Fluorescent Protein (RFP) were exposed to the C2C12 cells; cells were cultured overnight in Fetal Bovine Serum (1%) overnight. Three different media were categorized as cmBMP2 (a, b), cmBMP9 (c, d), and cmGFP (Green Fluorescent Protein) (e, f) in which the infected cells were treated for 2 h. Immunofluorescence staining using anti-Smad 1/5/8 antibody (from Santa Cruz Biotechnology); Negative control used for the experiment was either control IgG or absence of primary antibody staining. (B) Smad 6/7, induced by the BMP-9 signaling cascade, is expressed in the presence of Noggin; proves the resistance of BMP-9 towards Noggin inhibition. Sub confluent C2C12 cells were used for this experiment; these cells were infected with Ad-BMP 2/9 and Ad-Noggin or Ad-RFP for 30 h. Reverse transcription-polymerase chain reaction (RT-PCR) analysis using mouse Smad 6 and Smad 7 primers was done on the isolated total RNA from the infected cells. Normalization control used was GAPDH with triplicates done for all assays. Noggin vs. RFP expression (Smad 5 and Smad 7) ** p value < 0.01, # p value < 0.05. (II) Noggin resistance is displayed by BMP-9 during ectopic bone formation. (A). Ectopic bone masses formed with two different cell lines, C2C12 and mouse embryonic fibroblasts (MEFs), infected with the Ad-BMP-9 and then injected subcutaneously injected into athymic mice with and without Noggin. These samples were from 4 weeks post-injection. (B) Histological evaluation of the samples harvested from Ad-BMP-9 infected C2C12 cell injection site; (a) H& E staining, (b) Trichrome staining, and (c) Alcian blue staining. (C) Histological evaluation of the samples harvested from Ad-BMP-9 infected MEFs cell injection site; (a) H& E staining, (b) Trichrome staining, and (c) Alcian blue staining. X200 magnification. BM – Bone matrix; CM – chondroid or cartilage matrix. Figures 2. (I) and (II) reprinted from [45] with permission from John Wiley and Sons. Copyright © 2013 Orthopaedic Research Society. Published by Wiley Periodicals, Inc.
Figure 3.
Figure 3.
Inadequate bone formation was observed with MiR-21 deficiency in Calvarial bone defects. (A) Calvarial bone defects (4 mm by 4 mm each) for wild-type (WT) and MiR-21 knockout (miR-21-KO) mice with respect to zero time and 2 months. (B) After 2 months of surgery, the MiR-21 knockout samples showed a significantly smaller amount of bone formation in those calvarial defects; the comparison was done at a p value < 0.01. (C) Histology analysis displayed significant bone healing in WT in comparison to knockout mice; B – host bone, NB – new bone. (D) At a p value < 0.05, the comparison between the two groups exhibited a significant difference in defect length; an increase in the defect length infers a slower new bone formation for closing the defect. All data are shown as means ± SD; * p value < 0.05 and ** p value < 0.01; all experiments done with triplicates. Figure 3 reprinted from [89] with permission from Elsevier. Copyright © 2017 Elsevier Inc.
Figure 4.
Figure 4.
OVX rat model with induced osteoporosis response to in vivo activity of the LNP delivery system. (A) X-ray radiographs showing (a) sham control rat, (b) OVX rat as vehicle control, (c) OVX rat with BMP-9 containing LNP, and (d) OVX rat with BMP-9 peptide containing LNP. (B) Left and right femur bone quantitative data for cortical thickness among separate groups. (C) Endosteal diameter quantitative analysis results for left and right femur bones among separate groups. * p value ≤ 0.05 and ** p value ≤ 0.01 in comparison with vehicle control group; # p value ≤ 0.05 and ## p value ≤ 0.01 in comparison with vehicle control group; ns – not statistically significant difference. Figure 4 reprinted from [127] with permission from Elsevier. Copyright © 2019 Elsevier B.V.
Figure 5.
Figure 5.
(I) Bone marrow mesenchymal stem cells (BMMSCs) seeded on the nHACM/BMP-9 scaffolds; BMP-9 has been denoted as B9. Electron microscopy micrograph for cell attachment after 72 h of incubation. A randomized distribution pattern is observed for the cell on the BMP-9 containing scaffold. Scale = 10 μm. (II) Osteogenic differentiation upregulation is facilitated by BMP-9 containing scaffolds. (a) ALP activity reports significant enhancement with BMP-9 (denoted as B9) presence on the scaffolds after 4 days of culture with BMMSCs, as compared to controls cell only and scaffold without BMP-9; Days 7 and 10 show further significant enhancement in ALP activity. (b) qPCR evaluation of mRNA expressions that are a quintessential part of osteogenic differentiation – Col1α1, OCN, and OPN while culturing BMMSCs on scaffolds. BMP-9 (denoted as B9) containing scaffold group significantly showed the highest expression of these osteogenic marker genes. (III) Radiographs from in vivo samples after 12 weeks of bone healing post-surgery. (a) Micro-CT images showing significantly larger bone formation area for the BMP-9 (denoted as B9) containing nHACM scaffold group, as compared to the control BMMSCs and scaffold only (nHACM + BMMSCs); red circles mark the site of the original bone defect. (b) Significantly higher bone proportion formation was observed with BMP-9 (denoted as B9) containing nHACM scaffold group. (IV) Histology analysis of 12-week old samples post-surgery. (a) New bone formation observed in scaffold containing groups, as compared to the control group. Remaining fragments of biodegradation of nHACM were also seen. (b) Bone volume quantification for the new bone formation process revealed significantly higher bone defect healing for the scaffold containing groups, and the BMP-9 (denoted as B9) + nHACM group significantly as the highest bone repair potential under those experimental conditions. The control group was reported to be filled with connective tissue. All data represented as Means ± SD; experiments were done in triplicates; * p value < 0.05, ** p value < 0.01, and *** p value < 0.001. Figure 5. (I), (II), (III), and (IV) reprinted (adapted) from [129]. Open Access Permission from Hindawi (https://www.hindawi.com/). Copyright © 2019 Ran Zhang et al.
Figure 5.
Figure 5.
(I) Bone marrow mesenchymal stem cells (BMMSCs) seeded on the nHACM/BMP-9 scaffolds; BMP-9 has been denoted as B9. Electron microscopy micrograph for cell attachment after 72 h of incubation. A randomized distribution pattern is observed for the cell on the BMP-9 containing scaffold. Scale = 10 μm. (II) Osteogenic differentiation upregulation is facilitated by BMP-9 containing scaffolds. (a) ALP activity reports significant enhancement with BMP-9 (denoted as B9) presence on the scaffolds after 4 days of culture with BMMSCs, as compared to controls cell only and scaffold without BMP-9; Days 7 and 10 show further significant enhancement in ALP activity. (b) qPCR evaluation of mRNA expressions that are a quintessential part of osteogenic differentiation – Col1α1, OCN, and OPN while culturing BMMSCs on scaffolds. BMP-9 (denoted as B9) containing scaffold group significantly showed the highest expression of these osteogenic marker genes. (III) Radiographs from in vivo samples after 12 weeks of bone healing post-surgery. (a) Micro-CT images showing significantly larger bone formation area for the BMP-9 (denoted as B9) containing nHACM scaffold group, as compared to the control BMMSCs and scaffold only (nHACM + BMMSCs); red circles mark the site of the original bone defect. (b) Significantly higher bone proportion formation was observed with BMP-9 (denoted as B9) containing nHACM scaffold group. (IV) Histology analysis of 12-week old samples post-surgery. (a) New bone formation observed in scaffold containing groups, as compared to the control group. Remaining fragments of biodegradation of nHACM were also seen. (b) Bone volume quantification for the new bone formation process revealed significantly higher bone defect healing for the scaffold containing groups, and the BMP-9 (denoted as B9) + nHACM group significantly as the highest bone repair potential under those experimental conditions. The control group was reported to be filled with connective tissue. All data represented as Means ± SD; experiments were done in triplicates; * p value < 0.05, ** p value < 0.01, and *** p value < 0.001. Figure 5. (I), (II), (III), and (IV) reprinted (adapted) from [129]. Open Access Permission from Hindawi (https://www.hindawi.com/). Copyright © 2019 Ran Zhang et al.
Figure 6.
Figure 6.
(I) Osteogenic differentiation of hMSCs. (A) Cumulative release profile of BMP-9 from the BMP-9 coated microparticles; initial burst release evident. (B) Sustained release scenario for BMP-9 while the gel acts as a reservoir of initial burst release of BMP-9 from microparticles. VEGF added to the gel blend also follows a sustained release profile, however, at a faster rate than BMP-9. (C) ALP activity of hMSCs seeded with gel scaffold with or without BMP-9 presence (B – BMP-9, V – VEGF, MPs – Microparticles, Gel – Gel blend only). (D, E, F) RT-PCR quantification of osteogenic markers (number of folds change). The red dotted line represents the reference level of MPs + Gel as control. (II) Calvarial bone defect (of size 3.5 mm in diameter) healing in a rat model. (A) Micro-CT images of bone healing in the bone defects.3D reconstruction of bone defect sites at 6 weeks and 12 weeks. (B) Quantitative analysis for bone volume in the defect site. * p value < 0.05 and ** p value < 0.001. Figure 6. (I) and (II) reprinted (adapted) with permission from [139]. Modifications: Changed numbering scheme to the uppercase alphabet in Figure 6. (I) and (II). Copyright © 2019 American Chemical Society.
Figure 6.
Figure 6.
(I) Osteogenic differentiation of hMSCs. (A) Cumulative release profile of BMP-9 from the BMP-9 coated microparticles; initial burst release evident. (B) Sustained release scenario for BMP-9 while the gel acts as a reservoir of initial burst release of BMP-9 from microparticles. VEGF added to the gel blend also follows a sustained release profile, however, at a faster rate than BMP-9. (C) ALP activity of hMSCs seeded with gel scaffold with or without BMP-9 presence (B – BMP-9, V – VEGF, MPs – Microparticles, Gel – Gel blend only). (D, E, F) RT-PCR quantification of osteogenic markers (number of folds change). The red dotted line represents the reference level of MPs + Gel as control. (II) Calvarial bone defect (of size 3.5 mm in diameter) healing in a rat model. (A) Micro-CT images of bone healing in the bone defects.3D reconstruction of bone defect sites at 6 weeks and 12 weeks. (B) Quantitative analysis for bone volume in the defect site. * p value < 0.05 and ** p value < 0.001. Figure 6. (I) and (II) reprinted (adapted) with permission from [139]. Modifications: Changed numbering scheme to the uppercase alphabet in Figure 6. (I) and (II). Copyright © 2019 American Chemical Society.
Figure 7
Figure 7
(I) Recombinant BMP-9 induced ectopic bone formation using the sonoporation or electroporation method. Micro-CT images in high resolution for the detection of ectopic bone formation in thigh muscles of the mouse model using (a) sonoporation and (b) electroporation; 3D representation of the ectopic bone formation induced in vivo. 2D image of representative ectopic bone formation showed an enlarged format on the left of (a). Ectopic bone formation quantitative analysis of bone volume (c), volume density of the formed bone (d), and mineral density of the ectopic bone segment (e). Standard error bars shown for n=9. (II) Histology evaluation of the ectopic bone formation induced by rhBMP-9 in the in vivo mouse model. After 6 weeks post-sonoporation (a and b) H&E staining results and (c and d) Masson trichrome staining data; BF – bone formation, BM – bone marrow, M – skeletal muscle; osteocytes are identified with the yellow arrows. Figure 7. (I) and (II) - Reprinted by permission from Springer Nature: Gene Therapy [144], D. Sheyn, N. Kimelman-Bleich, G. Pelled, Y. Zilberman, D. Gazit, Z. Gazit, Ultrasound-based nonviral gene delivery induces bone formation in vivo. Copyright © 2007, Springer Nature.
Figure 8.
Figure 8.
(I) Ectopic bone formation induced by BMP-9 containing GL powder. (A) Micro-CT images of the ectopic bone formation. (a) 3D reconstruction of the harvested ectopic bone samples with iMEFs infected with BMP-9 and BMP-9 + GL powder. Ad-GFP control infected iMEFs and iMEFs + GL powder group was reported to have no significant ectopic bone formation induced. (b) Quantification of mean bone volume of the sample groups using Amira data visualization and processing program. (B) Histology analysis of extracted ectopic bone masses; (a and b) H & E staining. (c) Trabecular bone area formation quantification using ImageJ image processing program. GL – GL powder, MP – mineralized bone matrix, MSCs – stem cells left undifferentiated. ** p value <0.05 in comparison with BMP-9 only group. Figure 8. (I) reprinted (adapted) with permission from [155]. Copyright © 2017, American Chemical Society. (II) In vivo analysis of new bone formation. (A) Ectopic bone formation analysis using H & E staining. (B) Alveolar bone defect implantation surgical procedure (a, b, c, and d). H & E staining showing new bone formation from the alveolar bone defects (e, f, g, h); Scale = 5 μm; CHA – Coralline hydroxyapatite scaffold, NB – new bone, red arrow denotes macrophages, black arrow denotes blood vessels. (C) Micro-CT and 3D reconstructed representative images of the alveolar defects with new bone formation for each experiment group. (D) New bone formation comparison by area. (E) Comparison of new bone volume. (F) Ratio of new bone formation bone volume (BV) over total bone volume (TV): BV/TV. * p value < 0.05, ** p value < 0.01, *** p value < 0.001 in comparison to the blank group, # p value < 0.05, ## p value < 0.01, ### p value < 0.001 in comparison to the CHA group, ++ p value < 0.01, +++ p value < 0.001 compared with rDFCs/CHA group. Modifications: Added alphabetical numbering in 8 (II B). Figure 8. (II) - Reprinted from [156] by permission from Springer Nature (Open Access): Copyright © 2017, Springer Nature.

References

    1. Downey PA, Siegel MI, Bone biology and the clinical implications for osteoporosis, Physical therapy 86(1) (2006) 77–91. - PubMed
    1. Buckwalter J, Glimcher M, Cooper R, Recker R, Bone biology, J Bone Joint Surg Am 77(8) (1995) 1256–1275.
    1. Florencio-Silva R, Sasso G.R.d.S., Sasso-Cerri E, Simões MJ, Cerri PS, Biology of bone tissue: structure, function, and factors that influence bone cells, BioMed research international 2015 (2015). - PMC - PubMed
    1. Robling AG, Castillo AB, Turner CH, Biomechanical and molecular regulation of bone remodeling, Annu. Rev. Biomed. Eng 8 (2006) 455–498. - PubMed
    1. Datta H, Ng W, Walker J, Tuck S, Varanasi S, The cell biology of bone metabolism, Journal of clinical pathology 61(5) (2008) 577–587. - PubMed

Substances

LinkOut - more resources