

Identification and prognostic value of a glycolysis-related gene signature in patients with bladder cancer
- PMID: 33545950
- PMCID: PMC7837905
- DOI: 10.1097/MD.0000000000023836
Identification and prognostic value of a glycolysis-related gene signature in patients with bladder cancer
Abstract
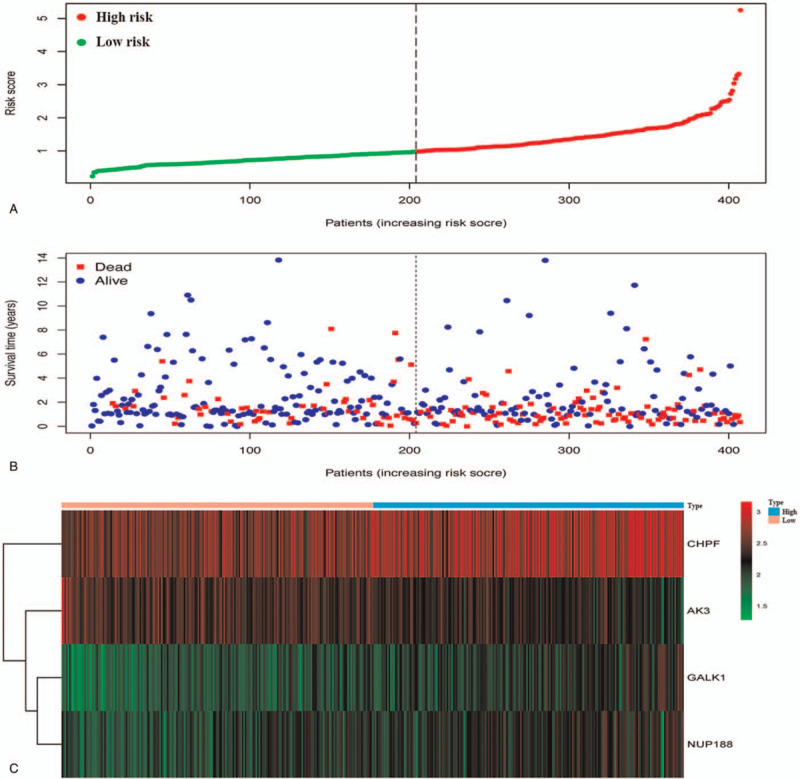
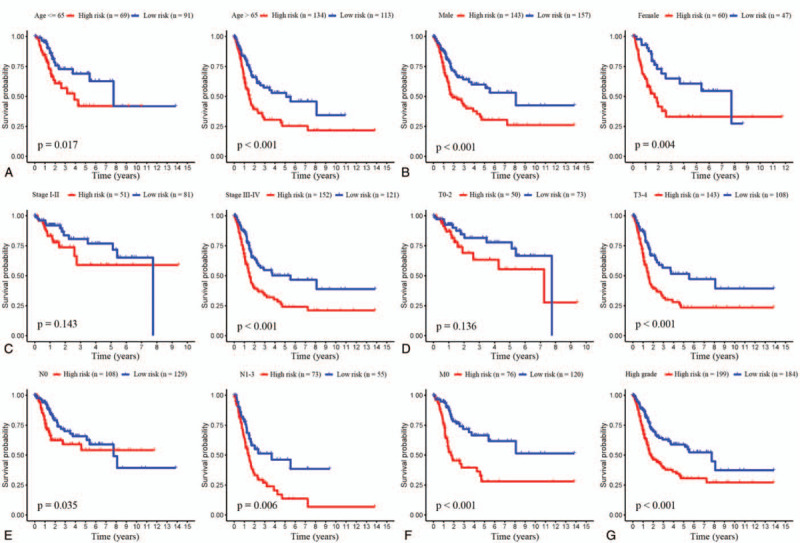
Bladder cancer (BC) is one of the most common malignancies worldwide. Several biomarkers related to the prognosis of patients with BC have previously been identified. However, these prognostic models use only one gene and are thus not reliable or accurate enough. The purpose of our study was to develop an innovative gene signature that has greater prognostic value in BC. So, in this study, we performed mRNA expression profiling of glycolysis-related genes in BC (n = 407) cohorts by mining data from The Cancer Genome Atlas (TCGA) database. The glycolysis-related gene sets were confirmed using the Gene Set Enrichment Analysis (GSEA). Using Cox regression analysis, a risk score staging model was built based on the genes that were determined to be significantly associated with BC outcome. Eventually, the system of risk score was structured to predict a patient's survival, and we identified four genes (CHPF, AK3, GALK1, and NUP188) that were associated with the outcomes of BC patients. According to the above-mentioned gene signature, patients were divided into two risk subgroups. The analysis showed that our constructed risk model was independent of clinical features and that the risk score was a highly powerful tool for predicting the overall survival (OS) of BC patients. Taking together, we identified a gene signature associated with glycolysis that could effectively predict the prognosis of BC patients. Our findings offer a new perspective for the clinical research and treatment of BC.
Copyright © 2021 the Author(s). Published by Wolters Kluwer Health, Inc.
Conflict of interest statement
The authors have no conflicts of interest to disclose.
Figures


References
-
- Bray F, Ferlay J, Soerjomataram I, et al. Global cancer statistics 2018: GLOBOCAN estimates of incidence and mortality worldwide for 36 cancers in 185 countries. CA Cancer J Clin 2018;68:394–424. - PubMed
-
- Babjuk M, Burger M, Compérat EM, et al. European Association of Urology guidelines on non-muscle-invasive bladder cancer (TaT1 and carcinoma In Situ)-2019 update. Eur Urol 2019. - PubMed
-
- Moch H, Cubilla AL, Humphrey PA, et al. The 2016 WHO classification of tumours of the urinary system and male genital organs—part A: renal, penile, and testicular tumours. Eur Urol 2016;70:93–105. - PubMed
-
- Sanli O, Dobruch J, Knowles MA, et al. Bladder cancer. Nat Rev Dis Primers 2017;3:1–9. - PubMed
-
- Babjuk M, Böhle A, Burger M, et al. EAU guidelines on non–muscle-invasive urothelial carcinoma of the bladder: update 2016. Eur Urol 2017;71:447–61. - PubMed
MeSH terms
Substances
Grants and funding
LinkOut - more resources
Full Text Sources
Other Literature Sources
Medical
Miscellaneous
