. 2021 Feb 3;22(4):1508.
doi: 10.3390/ijms22041508.

Long-Range PCR-Based NGS Applications to Diagnose Mendelian Retinal Diseases

Affiliations

Long-Range PCR-Based NGS Applications to Diagnose Mendelian Retinal Diseases

Jordi Maggi et al. Int J Mol Sci. .

Abstract

The purpose of this study was to develop a flexible, cost-efficient, next-generation sequencing (NGS) protocol for genetic testing. Long-range polymerase chain reaction (PCR) amplicons of up to 20 kb in size were designed to amplify entire genomic regions for a panel (n = 35) of inherited retinal disease (IRD)-associated loci. Amplicons were pooled and sequenced by NGS. The analysis was applied to 227 probands diagnosed with IRD: (A) 108 previously molecularly diagnosed, (B) 94 without previous genetic testing, and (C) 25 undiagnosed after whole-exome sequencing (WES). The method was validated with 100% sensitivity on cohort A. Long-range PCR-based sequencing revealed likely causative variant(s) in 51% and 24% of proband from cohorts B and C, respectively. Breakpoints of 3 copy number variants (CNVs) could be characterized. Long-range PCR libraries spike-in extended coverage of WES. Read phasing confirmed compound heterozygosity in 5 probands. The proposed sequencing protocol provided deep coverage of the entire gene, including intronic and promoter regions. Our method can be used (i) as a first-tier assay to reduce genetic testing costs, (ii) to elucidate missing heritability cases, (iii) to characterize breakpoints of CNVs at nucleotide resolution, (iv) to extend WES data to non-coding regions by spiking-in long-range PCR libraries, and (v) to help with phasing of candidate variants.

Keywords: ABCA4; BEST1; CNV; NGS; PRPH2; diagnostics; genetic testing; long-range PCR; missing heritability; phasing; retinal diseases; sequencing.


Conflict of interest statement

The authors declare no conflict of interest. The funders had no role in the design of the study; in the collection, analyses, or interpretation of data; in the writing of the manuscript, or in the decision to publish the results.

Figures
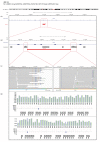
Figure A1
Figure A1
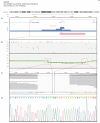
ABCA4 chr1:g.(94507656_94507700)_(94511700_94511710)del (3999–4033 bp), heterozygous. (a) Chromosomal overview and zoom into the ABCA4 locus. The red bar highlights the location and size of the deletion. (b) Magnification of the region encompassing exons 19 to 23 of ABCA4. The red bar shows the relative position and size of the deletion. The black bars mark the location of repeat elements from RepeatMasker. Two Alu elements are present in close proximity with both the proximal and distal breakpoints. (c) NGS alignment of the proximal breakpoint region (left, red square in (b)) and of the distal breakpoint region (right, red square in (b)). The alignment shows the location of variants with different colors. The relative location of the Alu elements on the proximal and distal side is highlighted with a blue and an orange line, respectively. The green line shows a 10 bp-long homologous sequence present on both sides of the deleted region. (d) Screenshot from the MLPA module of Sequence Pilot v5.2 (JSI medical systems, Ettenheim, Germany), depicting MLPA results for kit SALSA Probemix P151 ABCA4 mix-1 (top) and P152 ABCA4 mix-2 (bottom). Blue and green bars represent relative peak areas (RPAs) for controls and proband, respectively. The RPA ratio is illustrated underneath the respective RPA bars, highlighting a heterozygous deletion of exons 21 (mix-1), and 20 and 22 (mix-2).
Figure A2
Figure A2
KCNV2 chr9:g.2716981_2787016del (70,036 bp), heterozygous. (a) Chromosomal overview and zoom into the KCNV2 and neighboring genes region. The figure highlights the deletions published previously by Wissinger et al. in 2011 (blue bars) [109], as well as the position of the one identified in the present study (red bar). (b) CytoSNP-850K BeadChip results for the KCNV2 region (corresponding to the red square in (a)). B-allele frequency plot shown on top and the corresponding log R ratio plot is displayed on the bottom. (c) NGS alignment results for the breakpoint regions. On the left, the 5’ side breakpoint alignments are shown. The sequence is illustrated underneath the reads. The blue line underneath the sequence highlights the part of the junction region that originates from the proximal side of the deletion. The green line marks the 3 bp-long homologous sequence that is present on both sides of the deleted region. Finally, the orange line shows the part of the sequence coming from the distal side. (d) Electropherogram of the junction fragment for the index patient. The resulting sequence is reported above the peaks. The fragments of the proximal, distal and the shared homologous sequences are highlighted with blue, orange, and green lines, respectively.
Figure A3
Figure A3
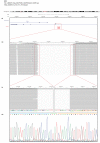
RS1 chrX:g.18675498_18676502del (1005 bp), hemizygous. (a) Chromosomal overview and zoom into the RS1 and neighbouring gene region. The red bar shows the position and size of the deletion. (b) NGS alignment to the red square region in (a). (c) Magnification of the 5′ (left) and 3′ (right) breakpoint regions. The corresponding sequence is reported underneath the alignment figure. The blue line under the sequence shows the part of the junction region that originates from the proximal side of the deletion. The green line highlights the 4 bp-long homologous sequence that is present on both sides of the deleted region. The orange line marks the part of the sequence coming from the distal side. (d) Electropherogram of the Sanger sequencing results of the junction fragment for the index patient. The blue line above the sequence shows the part of the junction region that originates from the proximal side of the deletion, which can also be seen in the NGS results (c). The green line shows the 4 bp-long homologous sequence that is present on both sides of the deleted region (also marked in (c)). The orange line highlights the part of the sequence coming from the distal side.
Figure 1
Figure 1
ABCA4 coverage comparison of different assays. Screenshot of the Alamut Visual software showing the coverage results for the ABCA4 locus from different next-generation sequencing assays. On the top, the software illustrates the relative exon locations. Below the gene structure, coverage plots for a typical whole-exome sequencing assay (top), custom capture probes assay (middle), and, finally, the long-range polymerase chain reaction method (bottom).
Figure 2
Figure 2
Read phasing: (a) Conceptual representation of read phasing. The grey bars represent sequencing reads aligned to the genome. Mate pair reads are connected by a black line. Single nucleotide variants are shown by a colored line and highlighted by black boxes. In this representation, variants at position 1 and 3 are the two putative pathogenic variants. The mate pair read on the top left is evidence that variants 1 and 2 are in cis. On the other hand, mate pair reads on the second and third lines attest that variants 2 and 3 are in trans. Therefore, variants 1 and 3 are in trans. (b) Screenshot from Integrative Genomics Viewer (IGV) of a simple example of read phasing from this study. The illustration shows the location of the two potentially pathogenic variants for patient S220 (CNGB3:c.1148del and CNGB3:c.1167_1168insC).
Figure 3
Figure 3
Diagnostic yields and main contributing loci for the macular dystrophies cohort and for the Stargardt disease sub-cohort. Nested pie charts depicting diagnostic yield (inner ring) and the identified contributing loci (outer ring) for macular dystrophies (top) and Stargardt disease (bottom). The loci included in the long-range polymerase chain reaction (PCR) panel are shown in different shades of blue, whilst other retinal diseases-associated loci not included in the panel are shown in green. ABCA4 and PRPH2 are the main contributors in both cohorts.

References

    1. Berger W., Kloeckener-Gruissem B., Neidhardt J. The molecular basis of human retinal and vitreoretinal diseases. Prog. Retin. Eye Res. 2010;29:335–375. doi: 10.1016/j.preteyeres.2010.03.004. - DOI - PubMed
    1. Sahel J.-A., Marazova K., Audo I. Clinical Characteristics and Current Therapies for Inherited Retinal Degenerations. Cold Spring Harb. Perspect. Med. 2015;5:a017111. doi: 10.1101/cshperspect.a017111. - DOI - PMC - PubMed
    1. Roberts L., Ratnapriya R., Du Plessis M., Chaitankar V., Ramesar R., Swaroop A. Molecular Diagnosis of Inherited Retinal Diseases in Indigenous African Populations by Whole-Exome Sequencing. Investig. Opthalmol. Vis. Sci. 2016;57:6374–6381. doi: 10.1167/iovs.16-19785. - DOI - PMC - PubMed
    1. Tiwari A., Lemke J., Altmueller J., Thiele H., Glaus E., Fleischhauer J., Nürnberg P., Neidhardt J., Berger W. Identification of Novel and Recurrent Disease-Causing Mutations in Retinal Dystrophies Using Whole Exome Sequencing (WES): Benefits and Limitations. PLoS ONE. 2016;11:e0158692. doi: 10.1371/journal.pone.0158692. - DOI - PMC - PubMed
    1. Toulis V., Cortés-González V., De Castro-Miró M., Sallum J.M.F., Català-Mora J., Villanueva-Mendoza C., Ciccioli M., Gonzàlez-Duarte R., Valero R., Marfany G. Increasing the Genetic Diagnosis Yield in Inherited Retinal Dystrophies: Assigning Pathogenicity to Novel Non-canonical Splice Site Variants. Genes. 2020;11:378. doi: 10.3390/genes11040378. - DOI - PMC - PubMed

MeSH terms

Grants and funding