. 2021 Feb 3;13(4):480.
doi: 10.3390/polym13040480.

A 3D Bioprinted Material That Recapitulates the Perivascular Bone Marrow Structure for Sustained Hematopoietic and Cancer Models

Affiliations

A 3D Bioprinted Material That Recapitulates the Perivascular Bone Marrow Structure for Sustained Hematopoietic and Cancer Models

Caitlyn A Moore et al. Polymers (Basel). .

Abstract

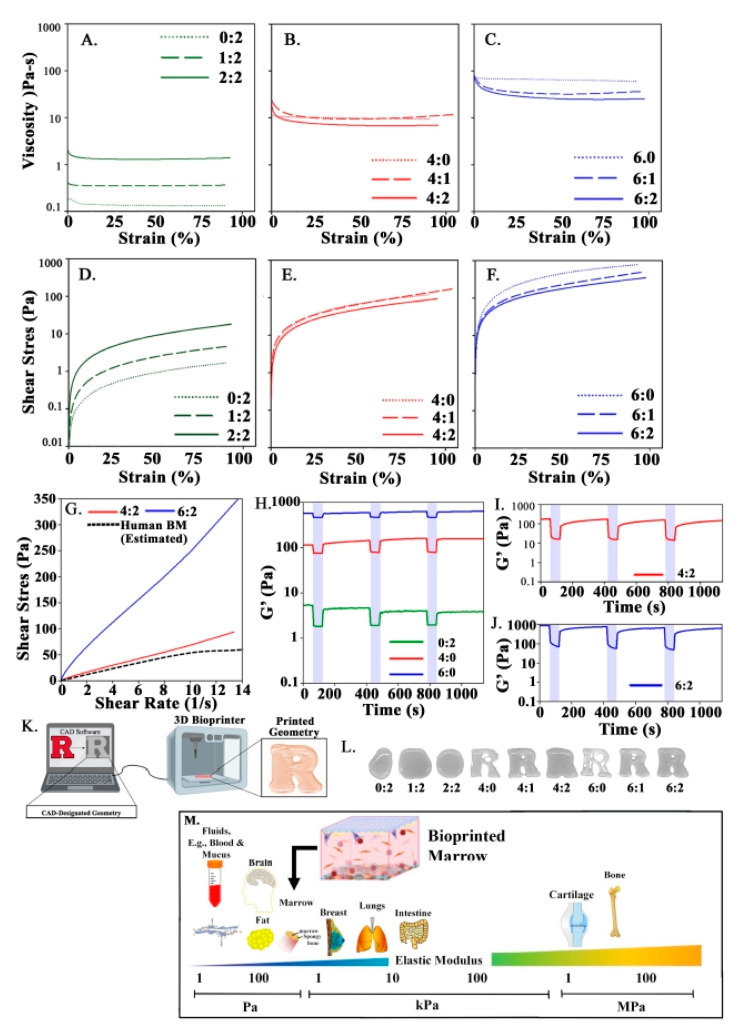
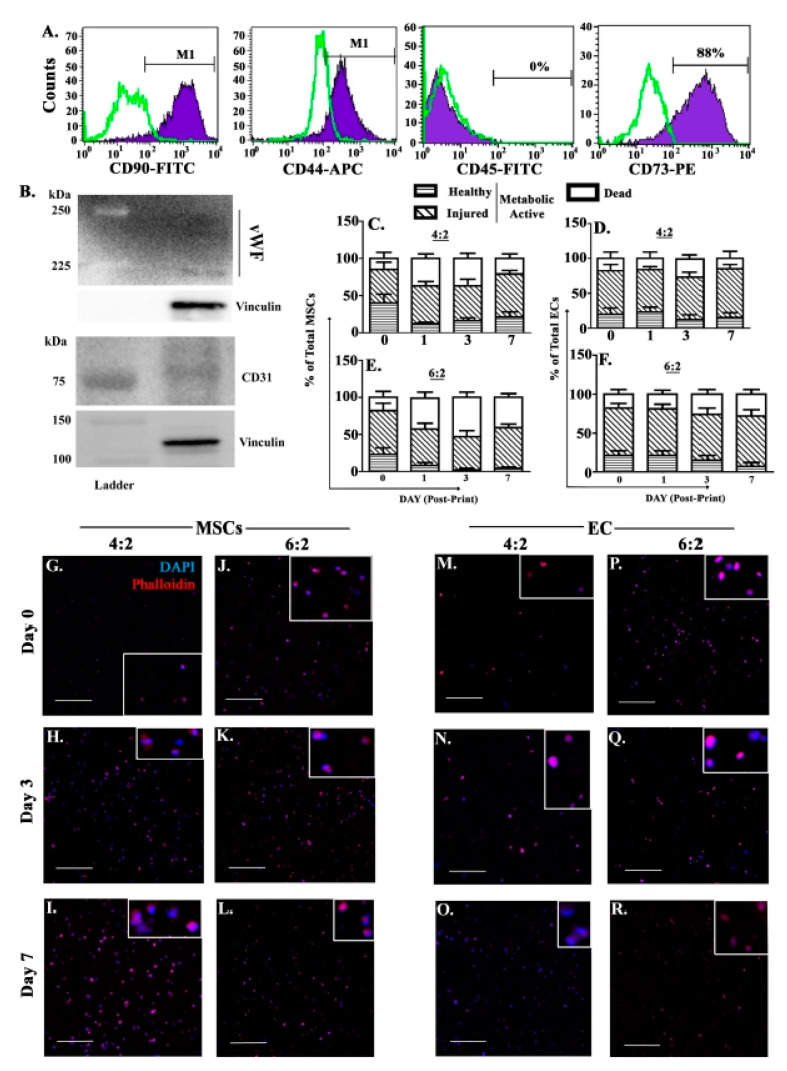
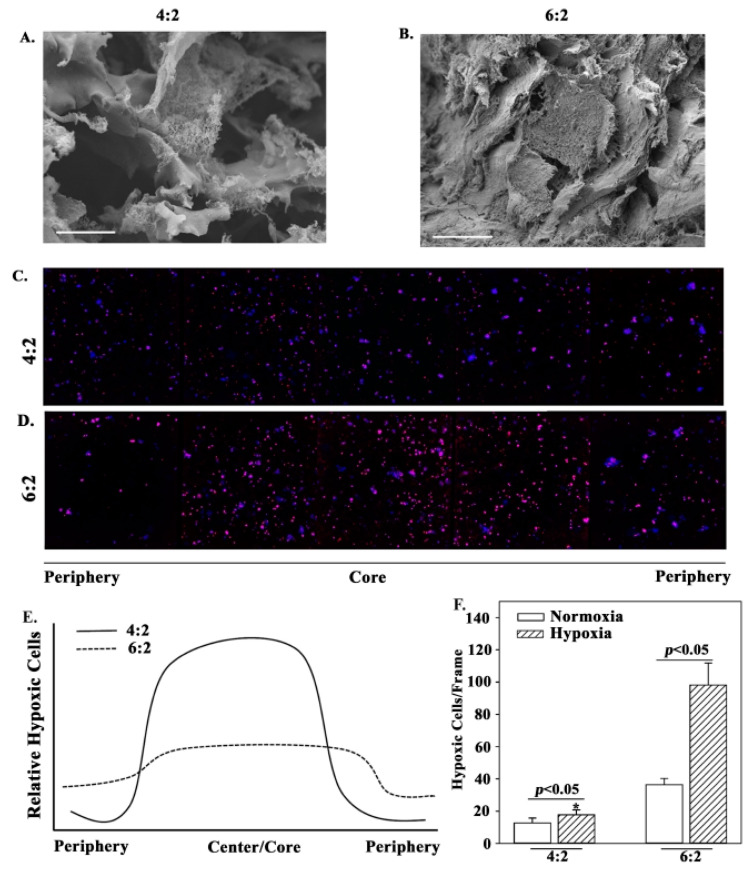
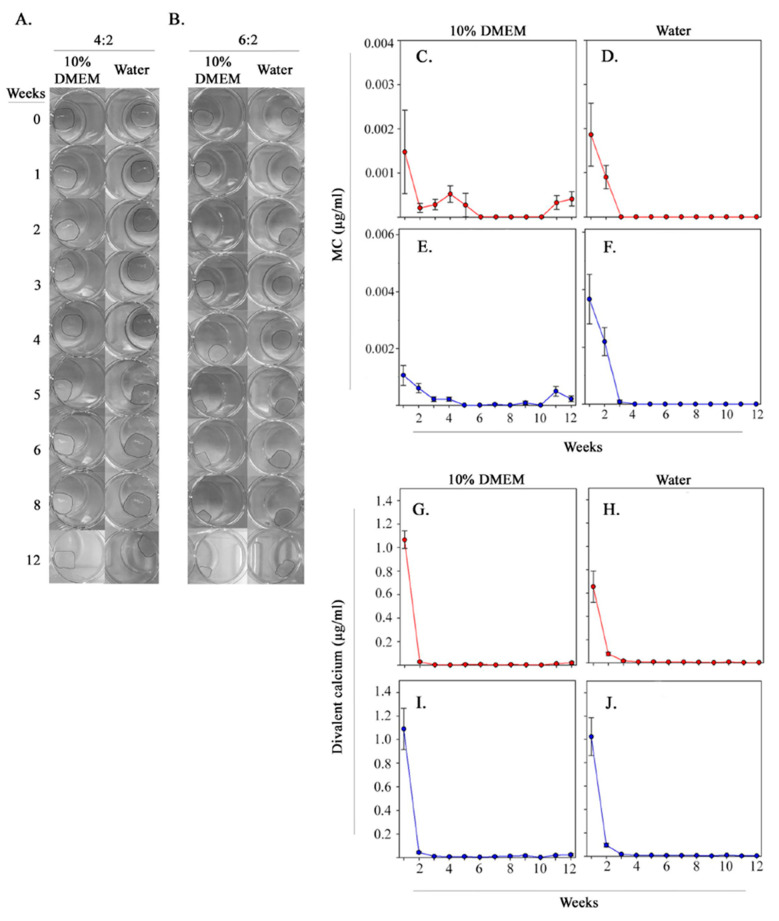
Translational medicine requires facile experimental systems to replicate the dynamic biological systems of diseases. Drug approval continues to lag, partly due to incongruencies in the research pipeline that traditionally involve 2D models, which could be improved with 3D models. The bone marrow (BM) poses challenges to harvest as an intact organ, making it difficult to study disease processes such as breast cancer (BC) survival in BM, and to effective evaluation of drug response in BM. Furthermore, it is a challenge to develop 3D BM structures due to its weak physical properties, and complex hierarchical structure and cellular landscape. To address this, we leveraged 3D bioprinting to create a BM structure with varied methylcellulose (M): alginate (A) ratios. We selected hydrogels containing 4% (w/v) M and 2% (w/v) A, which recapitulates rheological and ultrastructural features of the BM while maintaining stability in culture. This hydrogel sustained the culture of two key primary BM microenvironmental cells found at the perivascular region, mesenchymal stem cells and endothelial cells. More importantly, the scaffold showed evidence of cell autonomous dedifferentiation of BC cells to cancer stem cell properties. This scaffold could be the platform to create BM models for various diseases and also for drug screening.

Keywords: alginate; bioprinting; bone marrow; breast cancer; hydrogel; methylcellulose; stem cells.


Conflict of interest statement

The authors declare no conflict of interest.

Figures

Figure 1
Figure 1
Rheological analyses of hydrogels. Strain sweeps were performed using oscillatory rheometry to measure viscosity (AC) and flow (DF) behaviors of hydrogels containing 0–2% (w/v) MC (green), 4% MC (red), and 6% MC (blue). (G) Flow curves for 4:2 (red) and 6:2 (blue) bioinks were compared to that of human BM from a 44 year old male reported by Sobotková [30]. Shear recovery analyses for (H) single component bioinks, (I) 4:2 bioink, and (J) 6:2 bioink. (K) Shape fidelity refers to the ability of a hydrogel to maintain the designated geometry once it is printed. (L) Assessment of shape fidelity of bioinks with printing of Rutgers University logo and assessing the gross degree to which the structures resembled the designated geometry. (M) Diagrammatic summary of the spectrum of elastic moduli (G’) of various bodily tissues and biomaterials as reported across the literature. Shown is femur, between 100 Pa and 100 kPa. The marrow is shown below 1 kPa, which is consistent with the perivascular and central niches.
Figure 2
Figure 2
Cell viability and vitality are maintained by 4:2 and 6:2 bioinks. Flow cytometric analyses with MSCs labeled with anti-CD90, -44, -45 and -73 (A). Western blot with whole EC extracts for CD31 and vWF. Shown are the ladders that reflect the corresponding molecular weights of the test proteins (B). Primary human BM-derived MSCs and ECs were printed into 4:2 (C,D) and 6:2 (E,F) scaffolds, respectively. Timeline cell viability and vitality analyses were assessed up to day 7 as described in Materials and Methods. Viable cells are those deemed to be healthy and injured. The analyses represent 4 independent experiments, each with a different donor. Confocal microscopy imaged the cells at days 1, 3 and 7 within the scaffolds: MSCs in 4:2 (GI) and 6:2 (JL); ECs in 4:2 (MO) and 6:2 (PR). Shown are representative images at 10X magnification. Blue: DAPI (nuclei). Red: rhodamine phalloidin (actin). Scale bar: 250 µm.
Figure 3
Figure 3
Scaffold ultrastructure and cell hypoxia. The ultrastructure of (A) 4:2 and (B) 6:2 cell-free scaffolds, by scanning electron microscopy (SEM). Shown are representative images at 2500X magnification. Scale bar: 10 µm. (C) Cells in 4:2 (C) and 6:2 (D) scaffolds were visualized by confocal microscopy for hypoxic cells from periphery to core. The number of hypoxic cells (expressing the Lox1 fluorescent hypoxia probe) in normoxic (open bar) or hypoxic (diagonal-stripped bar) incubation systems. Cells within (C) 4:2 and (D) 6:2 scaffolds treated with a Lox1 fluorescent hypoxia probe were imaged using confocal microscopy at 10X magnification. The relative differences between ‘C’ and ‘D’ along the structures are diagrammatically presented in (E). The number of normoxic and hypoxic cells were counted across 5 frames and the values presented as mean cells±SD (F), * p < 0.05 vs. 6:2 hypoxic cells. The images represent three different independent experiments.
Figure 4
Figure 4
Stability of scaffold components in long-term culture conditions. Photographic images of (A) 4:2 and (B) 6:2 scaffolds were taken weekly for 12 weeks in 10% DMEM and deionized water, showing little bulk degradation of scaffold structure. MC (CF) and calcium (GJ) concentrations in solution were measured weekly over 12 weeks for both 4:2 and 6:2 scaffolds to assess crosslink breakage over the culture period.
Figure 5
Figure 5
Behavior of bioprinted BC cell subsets in 4:2 scaffolds. MDA-MB-231 breast cancer cells (BCCs) were sorted (AC) as Oct4a GFP-high (cancer stem cell, CSC), (DF) GFP-medium, and (GI) GFP-low cells. The three BCC subsets were printed into 4:2 scaffolds. Confocal images of fixed scaffolds were acquired at days 1 (A,D,G), 7 (B,E,H), and 28 (C,F,I). Representative images at 10× magnification are shown (n = 3 with 4 technical replicates). Blue: DAPI (nuclei). Green: GFP (Oct4a). Scale bar: 250 µm.

References

    1. DiMasi J.A., Grabowski H.G., Hansen R.W. Innovation in the pharmaceutical industry: New estimates of R&D costs. J. Health Econ. 2016;47:20–33. doi: 10.1016/j.jhealeco.2016.01.012. - DOI - PubMed
    1. Thomas D.W., Burns J., Audette J., Carroll A., Dow-Hygelund C., Hay M. Clinical Development Success Rates 2006–2015. BIO Biomedtracker Amplion. 2016;1:16.
    1. Hwang T.J., Carpenter D., Lauffenburger J.C., Wang B., Franklin J.M., Kesselheim A.S. Failure of Investigational Drugs in Late-Stage Clinical Development and Publication of Trial Results. JAMA Intern. Med. 2016;176:1826–1833. doi: 10.1001/jamainternmed.2016.6008. - DOI - PubMed
    1. Murphy S.V., Atala A. 3D bioprinting of tissues and organs. Nat. Biotechnol. 2014;32:773–785. doi: 10.1038/nbt.2958. - DOI - PubMed
    1. Baker B.M., Chen C.S. Deconstructing the third dimension: How 3D culture microenvironments alter cellular cues. J. Cell Sci. 2012;125:3015–3024. doi: 10.1242/jcs.079509. - DOI - PMC - PubMed

LinkOut - more resources