

Loss of Smell and Taste Can Accurately Predict COVID-19 Infection: A Machine-Learning Approach
- PMID: 33546319
- PMCID: PMC7913595
- DOI: 10.3390/jcm10040570
Loss of Smell and Taste Can Accurately Predict COVID-19 Infection: A Machine-Learning Approach
Abstract
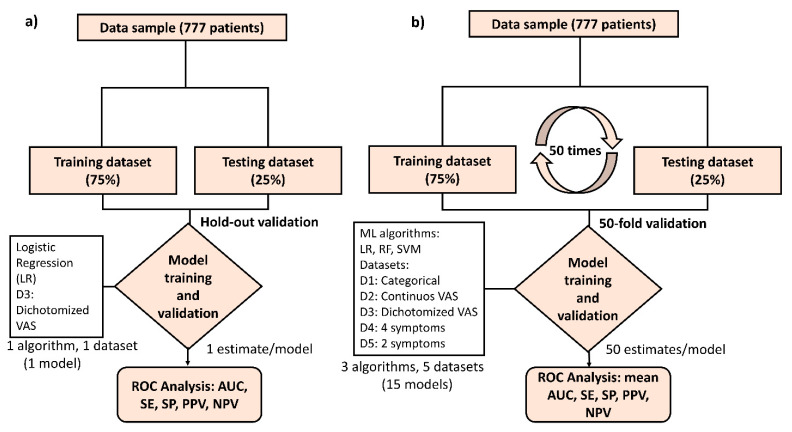
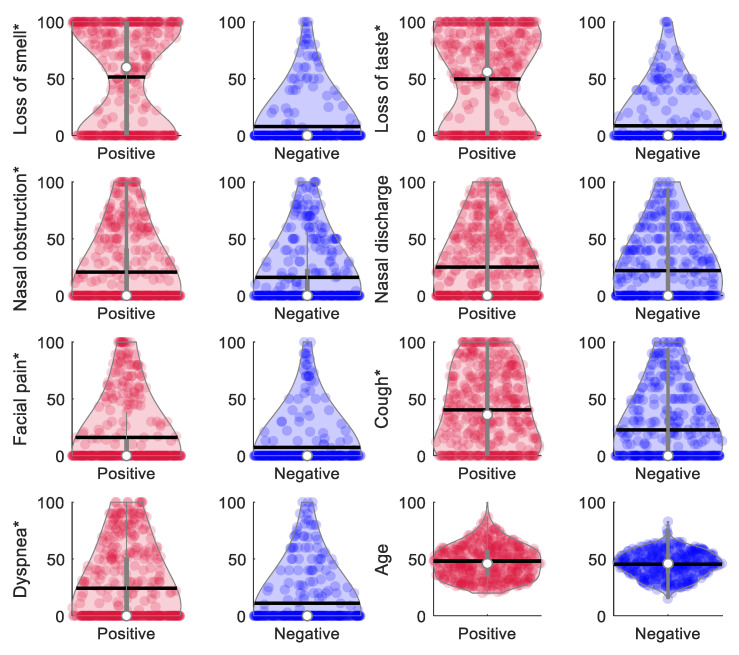
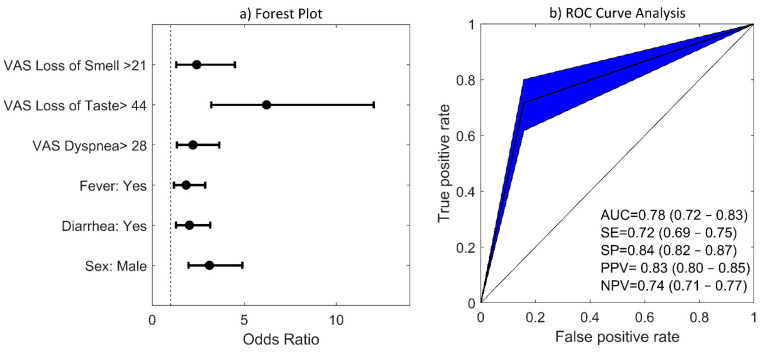
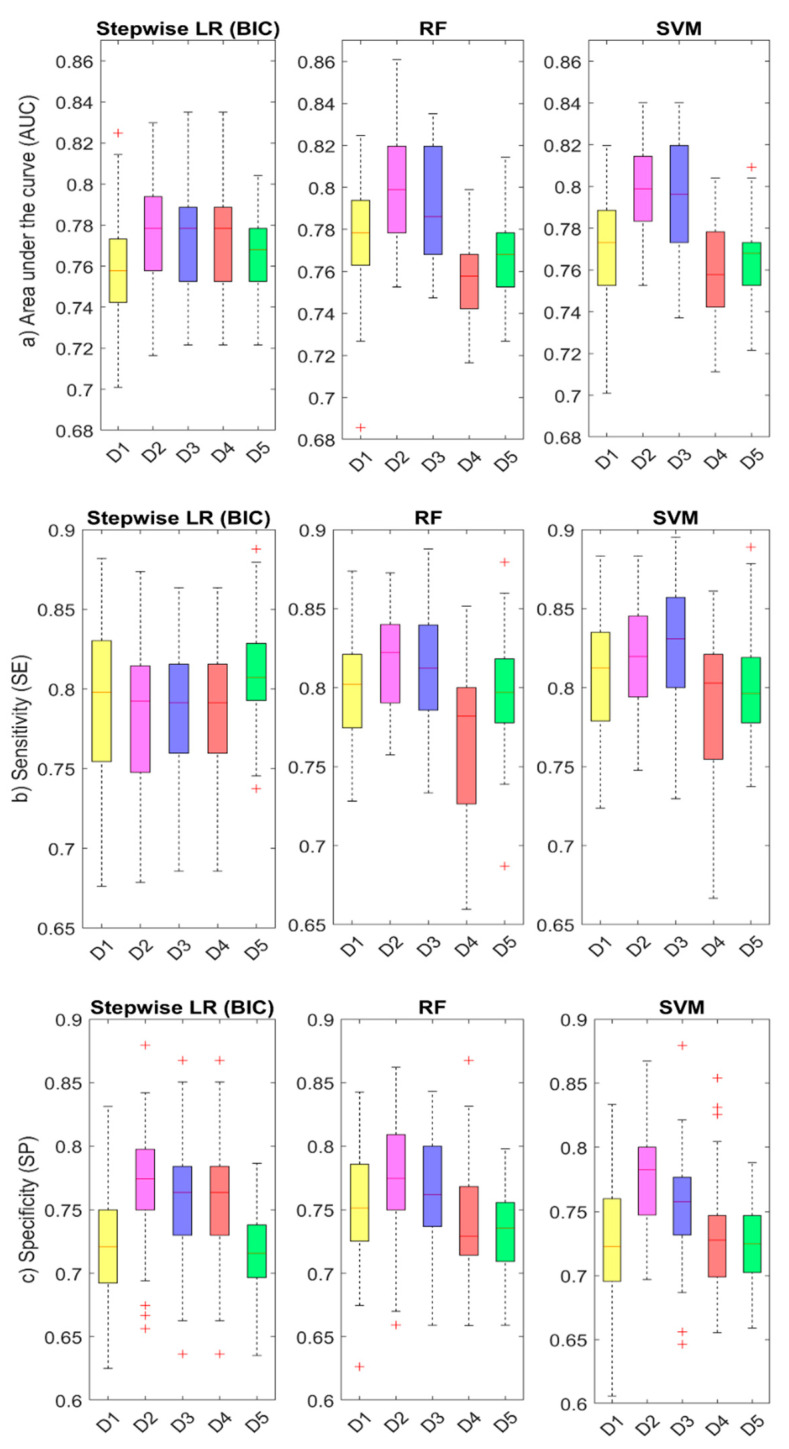
The COVID-19 outbreak has spread extensively around the world. Loss of smell and taste have emerged as main predictors for COVID-19. The objective of our study is to develop a comprehensive machine learning (ML) modelling framework to assess the predictive value of smell and taste disorders, along with other symptoms, in COVID-19 infection. A multicenter case-control study was performed, in which suspected cases for COVID-19, who were tested by real-time reverse-transcription polymerase chain reaction (RT-PCR), informed about the presence and severity of their symptoms using visual analog scales (VAS). ML algorithms were applied to the collected data to predict a COVID-19 diagnosis using a 50-fold cross-validation scheme by randomly splitting the patients in training (75%) and testing datasets (25%). A total of 777 patients were included. Loss of smell and taste were found to be the symptoms with higher odds ratios of 6.21 and 2.42 for COVID-19 positivity. The ML algorithms applied reached an average accuracy of 80%, a sensitivity of 82%, and a specificity of 78% when using VAS to predict a COVID-19 diagnosis. This study concludes that smell and taste disorders are accurate predictors, with ML algorithms constituting helpful tools for COVID-19 diagnostic prediction.
Keywords: COVID-19; SARS-CoV-2; machine learning; prediction model; smell; taste; visual analog scale.
Conflict of interest statement
The authors declare no conflict of interest.
Figures
Similar articles
-
Machine learning predictive modeling of the persistence of post-Covid19 disorders: Loss of smell and taste as case studies.Heliyon. 2024 Jul 27;10(15):e35246. doi: 10.1016/j.heliyon.2024.e35246. eCollection 2024 Aug 15. Heliyon. 2024. PMID: 39170549 Free PMC article.
-
Smell and Taste Dysfunction in COVID-19 Is Associated With Younger Age in Ambulatory Settings: A Multicenter Cross-Sectional Study.J Investig Allergol Clin Immunol. 2020;30(5):346-357. doi: 10.18176/jiaci.0595. Epub 2020 Jun 17. J Investig Allergol Clin Immunol. 2020. PMID: 32554337
-
Simultaneously complete but not partial taste and smell losses were associated with SARS-CoV-2 infection.Int J Infect Dis. 2021 May;106:329-337. doi: 10.1016/j.ijid.2021.03.083. Epub 2021 Apr 2. Int J Infect Dis. 2021. PMID: 33819604 Free PMC article.
-
A review of smell and taste dysfunction in COVID-19 patients.Med J Malaysia. 2020 Sep;75(5):574-581. Med J Malaysia. 2020. PMID: 32918429 Review.
-
Universal screening for SARS-CoV-2 infection: a rapid review.Cochrane Database Syst Rev. 2020 Sep 15;9(9):CD013718. doi: 10.1002/14651858.CD013718. Cochrane Database Syst Rev. 2020. PMID: 33502003 Free PMC article.
Cited by
-
A novel scoring system for early assessment of the risk of the COVID-19-associated mortality in hospitalized patients: COVID-19 BURDEN.Eur J Med Res. 2023 Jan 3;28(1):4. doi: 10.1186/s40001-022-00908-4. Eur J Med Res. 2023. PMID: 36597151 Free PMC article.
-
Cross sectional study of the clinical characteristics of French primary care patients with COVID-19.Sci Rep. 2021 Jun 14;11(1):12492. doi: 10.1038/s41598-021-91685-3. Sci Rep. 2021. PMID: 34127693 Free PMC article.
-
A non-invasive AI-based system for precise grading of anosmia in COVID-19 using neuroimaging.Heliyon. 2024 Jun 12;10(12):e32726. doi: 10.1016/j.heliyon.2024.e32726. eCollection 2024 Jun 30. Heliyon. 2024. PMID: 38975154 Free PMC article.
-
Is There Less Alteration of Smell Sensation in Patients With Omicron SARS-CoV-2 Variant Infection?Front Med (Lausanne). 2022 Apr 12;9:852998. doi: 10.3389/fmed.2022.852998. eCollection 2022. Front Med (Lausanne). 2022. PMID: 35492353 Free PMC article.
-
Transient loss and recovery of oral chemesthesis, taste and smell with COVID-19: A small case-control series.Physiol Behav. 2023 Nov 1;271:114331. doi: 10.1016/j.physbeh.2023.114331. Epub 2023 Aug 16. Physiol Behav. 2023. PMID: 37595820 Free PMC article.
References
Grants and funding
LinkOut - more resources
Full Text Sources
Other Literature Sources
Miscellaneous
