Comparative Study
. 2021 Feb 3;13(2):240.
doi: 10.3390/v13020240.

Anti-SU Antibody Responses in Client-Owned Cats Following Vaccination against Feline Leukaemia Virus with Two Inactivated Whole-Virus Vaccines (Fel-O-Vax® Lv-K and Fel-O-Vax® 5)

Affiliations
Comparative Study

Anti-SU Antibody Responses in Client-Owned Cats Following Vaccination against Feline Leukaemia Virus with Two Inactivated Whole-Virus Vaccines (Fel-O-Vax® Lv-K and Fel-O-Vax® 5)

Mark Westman et al. Viruses. .

Abstract

A field study undertaken in Australia compared the antibody responses induced in client-owned cats that had been vaccinated using two inactivated whole feline leukaemia virus (FeLV) vaccines, the monovalent vaccine Fel-O-Vax® Lv-K and the polyvalent vaccine Fel-O-Vax® 5. Serum samples from 428 FeLV-uninfected cats (118 FeLV-vaccinated and 310 FeLV-unvaccinated) were tested for anti-FeLV neutralising antibodies (NAb) using a live virus neutralisation assay to identify 378 FeLV-unexposed (NAb-negative) and 50 FeLV-exposed (NAb-positive; abortive infections) cats, following by anti-surface unit (SU) FeLV-A and FeLV-B antibody ELISA testing. An additional 42 FeLV-infected cats (28 presumptively regressively infected, 14 presumptively progressively infected) were also tested for anti-SU antibodies. NAb-positive cats displayed significantly higher anti-SU antibody ELISA responses compared to NAb-negative cats (p < 0.001). FeLV-unexposed cats (NAb-negative) that had been vaccinated less than 18 months after a previous FeLV vaccination using the monovalent vaccine (Fel-O-Vax® Lv-K) displayed higher anti-SU antibody ELISA responses than a comparable group vaccinated with the polyvalent vaccine (Fel-O-Vax® 5) (p < 0.001 for both anti-FeLV-A and FeLV-B SU antibody responses). This difference in anti-SU antibody responses between cats vaccinated with the monovalent or polyvalent vaccine, however, was not observed in cats that had been naturally exposed to FeLV (NAb-positive) (p = 0.33). It was postulated that vaccination with Fel-O-Vax® 5 primed the humoral response prior to FeLV exposure, such that antibody production increased when the animal was challenged, while vaccination with Fel-O-Vax® Lv-K induced an immediate preparatory antibody response that did not quantitatively increase after FeLV exposure. These results raise questions about the comparable vaccine efficacy of the different FeLV vaccine formulations and correlates of protection.

Keywords: Australia; FeLV infection; FeLV vaccination; humoral immunity; vaccine efficacy; veterinary science.


Conflict of interest statement

The authors declare no conflict of interest.

Figures

Figure 1
Figure 1
Algorithm used for classifying the FeLV exposure and infection status of cats recruited for the current study (grey cat with black outline). Cats unexposed to FeLV are represented as a white cat with a black outline; FeLV-uninfected cats that had been exposed to FeLV (NAb-positive; abortive infections) are represented as a white cat with a black outline and surrounded by FeLV, to demonstrate their robust immune response to clear early FeLV infection and protect them from further FeLV challenge; presumptively regressively infected cats are represented as a grey cat with a white outline and a question mark to represent a possible predisposition to developing lymphoma; and presumptively progressively infected cats are represented as a black cat with a white outline and a tombstone to represent their poor prognosis. FeLV-infected cats were classified as “presumptively” infected since testing was only performed at a single time point. NAb = neutralising antibody, qPCR = real-time polymerase chain reaction.
Figure 2
Figure 2
Results from anti-SU antibody ELISA testing according to NAb titre ((A) anti-FeLV-A SU antibody ELISA results, (B) anti-FeLV-B SU antibody ELISA results). Anti-SU antibody levels against FeLV-A for strongly neutralising samples (≥32) were significantly higher than other NAb-positive samples (i.e., 4, 8 and 16) (p = 0.03; REML testing), but anti-SU antibody levels against FeLV-B were not significantly different between NAb-positive groups (p = 0.32; REML testing). All NAb-positive groups had significantly higher median anti-SU antibody levels against both FeLV-A and FeLV-B SU than NAb-negative samples (p < 0.001; least significant difference testing). Data points are plotted as open circles, centre lines show the medians, box limits indicate the 25th and 75th percentiles, and whiskers extend 1.5 times the interquartile range from the 25th and 75th percentiles. NOD = normalised optical density, NAb = neutralising antibody, SU = surface unit.
Figure 2
Figure 2
Results from anti-SU antibody ELISA testing according to NAb titre ((A) anti-FeLV-A SU antibody ELISA results, (B) anti-FeLV-B SU antibody ELISA results). Anti-SU antibody levels against FeLV-A for strongly neutralising samples (≥32) were significantly higher than other NAb-positive samples (i.e., 4, 8 and 16) (p = 0.03; REML testing), but anti-SU antibody levels against FeLV-B were not significantly different between NAb-positive groups (p = 0.32; REML testing). All NAb-positive groups had significantly higher median anti-SU antibody levels against both FeLV-A and FeLV-B SU than NAb-negative samples (p < 0.001; least significant difference testing). Data points are plotted as open circles, centre lines show the medians, box limits indicate the 25th and 75th percentiles, and whiskers extend 1.5 times the interquartile range from the 25th and 75th percentiles. NOD = normalised optical density, NAb = neutralising antibody, SU = surface unit.
Figure 3
Figure 3
Comparison of anti-SU antibody ELISA responses to examine the effect of FeLV exposure/infection ((A) anti-FeLV-A SU antibody ELISA results, (B) anti-FeLV-B SU antibody ELISA results). Anti-SU ELISA results likely reflect differences between groups with regard to virus-neutralising antibody (NAb) titres. The field control group consisted of unvaccinated and unexposed cats (n = 303). The FeLV-infected cats consisted of presumptively progressive infections (n = 14) and presumptively regressive infections (n = 28). The abortive group (uninfected/exposed; n = 50) consisted of cats vaccinated with Fel-O-Vax® 5 (n = 29), cats vaccinated with Fel-O-Vax® Lv-K (n = 14) and FeLV-unvaccinated cats (n = 7). Statistically significant differences in median NOD values are shown (Mann–Whitney U-tests). Data points are plotted as open circles, centre lines show the medians, box limits indicate the 25th and 75th percentiles, and whiskers extend 1.5 times the interquartile range from the 25th and 75th percentiles. Results from vaccinated cats are shown in Figure 4. NOD = normalised optical density, SU = surface unit.
Figure 4
Figure 4
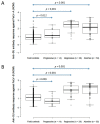
Comparison of anti-SU antibody ELISA responses to examine the effect of FeLV vaccination and natural exposure to FeLV following vaccination ((A) anti-FeLV-A SU antibody ELISA results, (B) anti-FeLV-B SU antibody ELISA results). The field control group consisted of unvaccinated and unexposed cats (n = 303) and is included to provide a baseline. Ten unexposed cats had been vaccinated on-time with Fel-O-Vax® Lv-K and 40 unexposed cats had been vaccinated on-time with Fel-O-Vax® 5. In total, 43 vaccinated/uninfected cats had been exposed to FeLV (abortive infections), including 14 cats vaccinated with Fel-O-Vax® Lv-K and 29 cats vaccinated with Fel-O-Vax® 5. Statistically significant differences in median NOD values between vaccinated groups after exposure are shown. The monovalent vaccine (Fel-O-Vax® Lv-K) induced significantly higher antibody levels in unexposed cats against both FeLV-A and FeLV-B SU than the polyvalent vaccine (Fel-O-Vax® 5) (p < 0.001 for both; Mann–Whitney U-tests). Cats vaccinated with the polyvalent Fel-O-Vax® 5 vaccine and exposed to FeLV displayed a booster effect of natural FeLV exposure (p < 0.001 for both FeLV-A and FeLV-B SU; Mann–Whitney U-tests); cats vaccinated with the monovalent Fel-O-Vax® Lv-K vaccine and exposed to FeLV displayed no such booster effect (p = 0.33 for FeLV-A and p = 0.82 for FeLV-B; Mann–Whitney U-tests). Data points are plotted as open circles, centre lines show the medians, box limits indicate the 25th and 75th percentiles, and whiskers extend 1.5 times the interquartile range from the 25th and 75th percentiles. NOD = normalised optical density, SU = surface unit, LvK = Fel-O-Vax® Lv-K, F5 = Fel-O-Vax® 5.
Figure 4
Figure 4
Comparison of anti-SU antibody ELISA responses to examine the effect of FeLV vaccination and natural exposure to FeLV following vaccination ((A) anti-FeLV-A SU antibody ELISA results, (B) anti-FeLV-B SU antibody ELISA results). The field control group consisted of unvaccinated and unexposed cats (n = 303) and is included to provide a baseline. Ten unexposed cats had been vaccinated on-time with Fel-O-Vax® Lv-K and 40 unexposed cats had been vaccinated on-time with Fel-O-Vax® 5. In total, 43 vaccinated/uninfected cats had been exposed to FeLV (abortive infections), including 14 cats vaccinated with Fel-O-Vax® Lv-K and 29 cats vaccinated with Fel-O-Vax® 5. Statistically significant differences in median NOD values between vaccinated groups after exposure are shown. The monovalent vaccine (Fel-O-Vax® Lv-K) induced significantly higher antibody levels in unexposed cats against both FeLV-A and FeLV-B SU than the polyvalent vaccine (Fel-O-Vax® 5) (p < 0.001 for both; Mann–Whitney U-tests). Cats vaccinated with the polyvalent Fel-O-Vax® 5 vaccine and exposed to FeLV displayed a booster effect of natural FeLV exposure (p < 0.001 for both FeLV-A and FeLV-B SU; Mann–Whitney U-tests); cats vaccinated with the monovalent Fel-O-Vax® Lv-K vaccine and exposed to FeLV displayed no such booster effect (p = 0.33 for FeLV-A and p = 0.82 for FeLV-B; Mann–Whitney U-tests). Data points are plotted as open circles, centre lines show the medians, box limits indicate the 25th and 75th percentiles, and whiskers extend 1.5 times the interquartile range from the 25th and 75th percentiles. NOD = normalised optical density, SU = surface unit, LvK = Fel-O-Vax® Lv-K, F5 = Fel-O-Vax® 5.

References

    1. Jarrett W.F.H., Crawford E.M., Martin W.B., Davie F. Leukaemia in the cat: A virus-like particle associated with leukaemia (lymphosarcoma) Nature. 1964;202:567–568. doi: 10.1038/202567a0. - DOI - PubMed
    1. Shelton G.H., Grant C.K., Cotter S.M., Gardner M.B., Hardy W.D., Jr., DiGiacomo R.F. Feline immunodeficiency virus and feline leukemia virus infections and their relationships to lymphoid malignancies in cats: A retrospective study (1968–1988) J. Acquir. Immune. Defic. Syndr. 1990;3:623–630. - PubMed
    1. Cristo T.G., Biezus G., Noronha L.F., Pereira L., Withoeft J.A., Furlan L.V., Costa L.S., Traverso S.D., Casagrande R.A. Feline lymphoma and a high correlation with feline leukaemia virus infection in Brazil. J. Comp. Pathol. 2019;166:20–28. doi: 10.1016/j.jcpa.2018.10.171. - DOI - PubMed
    1. Gabor L.J., Jackson M.L., Trask B., Malik R., Canfield P.J. Feline leukaemia virus status of Australian cats with lymphosarcoma. Aust. Vet. J. 2001;79:476–481. doi: 10.1111/j.1751-0813.2001.tb13017.x. - DOI - PubMed
    1. Jackson M.L., Haines D.M., Meric S.M., Misra V. Feline leukemia virus detection by immunohistochemistry and polymerase chain reaction in formalin-fixed, paraffin-embedded tumor tissue from cats with lymphosarcoma. Can. J. Vet. Res. 1993;57:269–276. - PMC - PubMed

Publication types

MeSH terms

LinkOut - more resources