. 2021 Feb 5;19(1):22.
doi: 10.1186/s12915-021-00948-y.

Functional analysis of sense organ specification in the Tribolium castaneum larva reveals divergent mechanisms in insects

Affiliations

Functional analysis of sense organ specification in the Tribolium castaneum larva reveals divergent mechanisms in insects

Marleen Klann et al. BMC Biol. .

Abstract

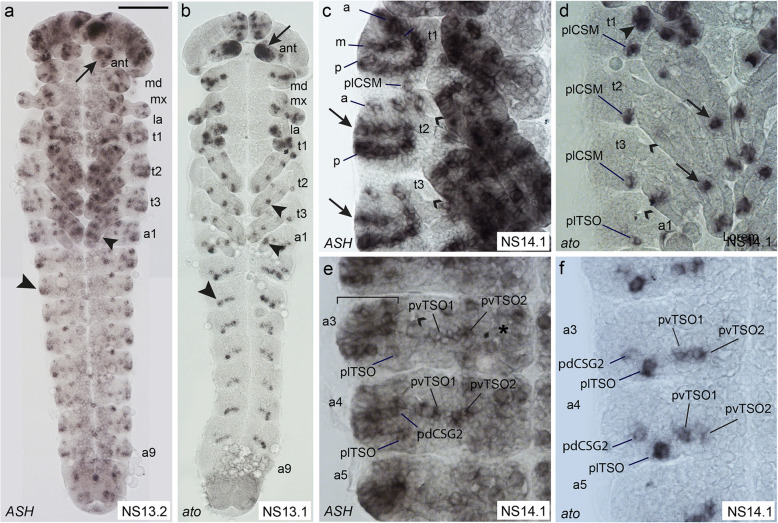
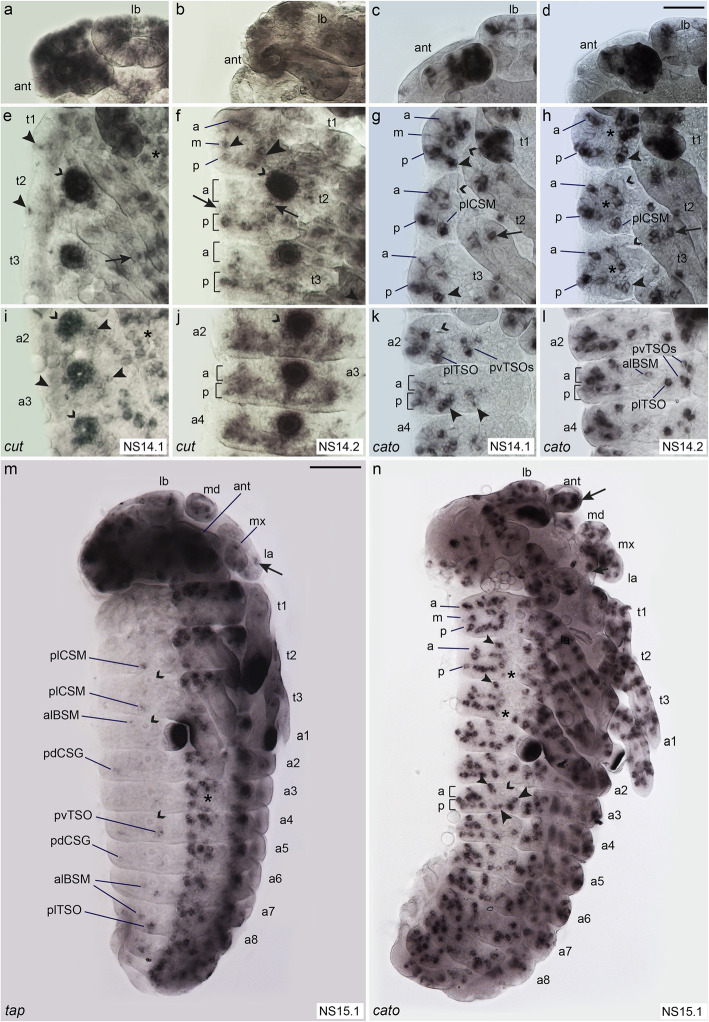
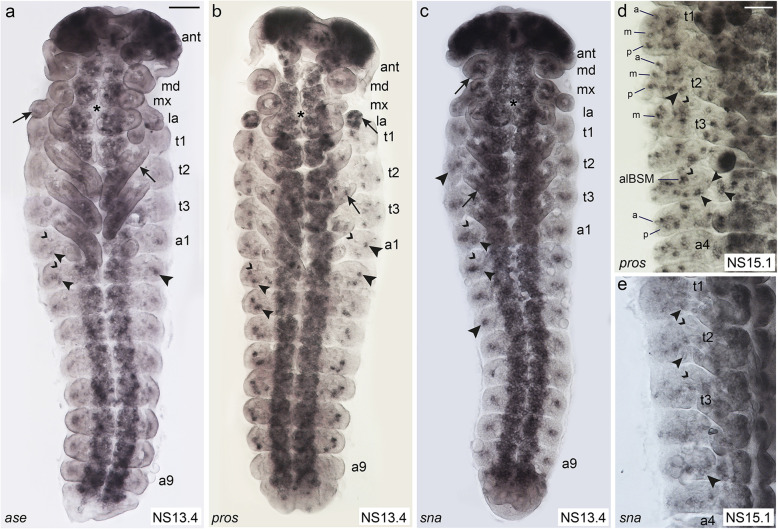
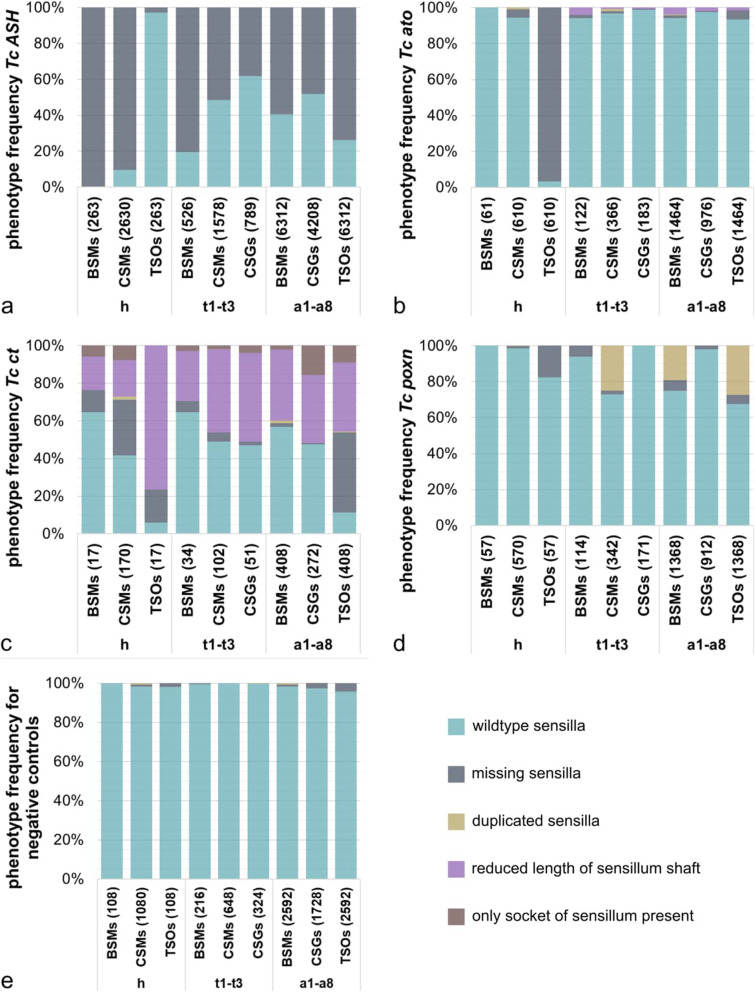
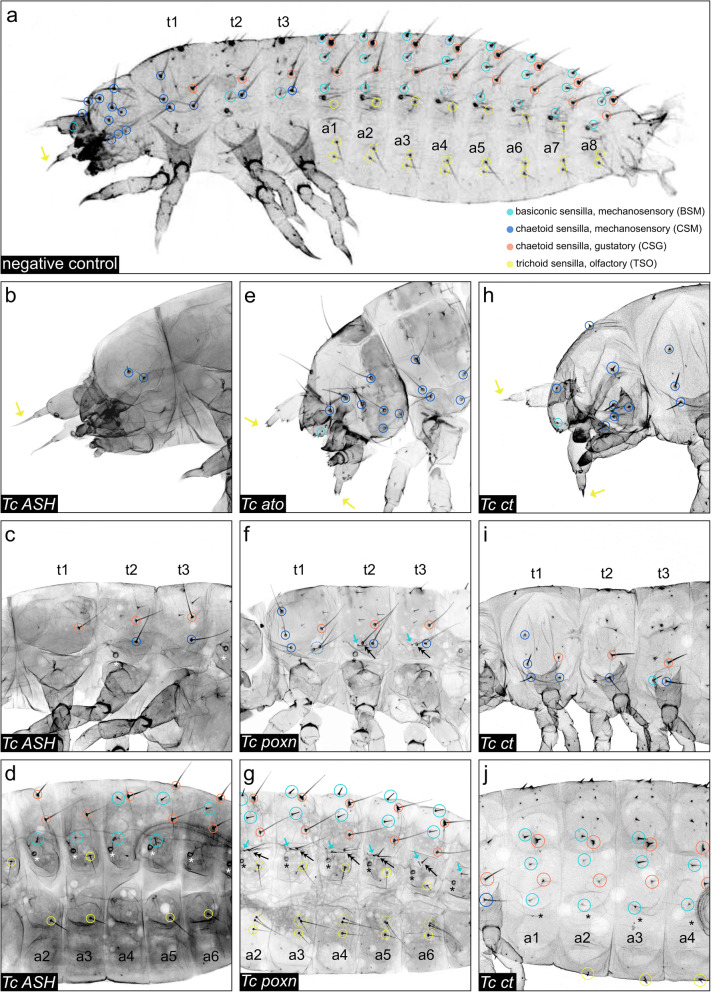
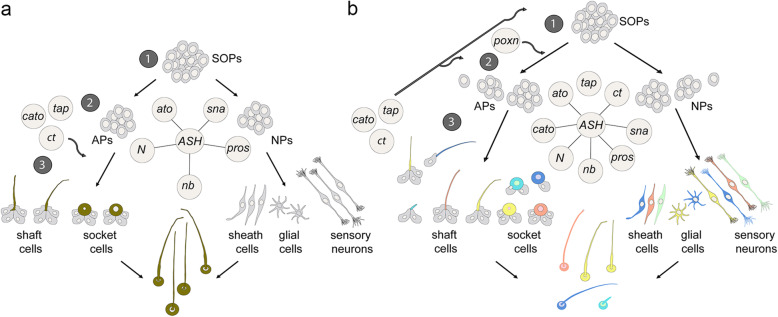
Insects and other arthropods utilise external sensory structures for mechanosensory, olfactory, and gustatory reception. These sense organs have characteristic shapes related to their function, and in many cases are distributed in a fixed pattern so that they are identifiable individually. In Drosophila melanogaster, the identity of sense organs is regulated by specific combinations of transcription factors. In other arthropods, however, sense organ subtypes cannot be linked to the same code of gene expression. This raises the questions of how sense organ diversity has evolved and whether the principles underlying subtype identity in D. melanogaster are representative of other insects. Here, we provide evidence that such principles cannot be generalised, and suggest that sensory organ diversification followed the recruitment of sensory genes to distinct sensory organ specification mechanism. RESULTS: We analysed sense organ development in a nondipteran insect, the flour beetle Tribolium castaneum, by gene expression and RNA interference studies. We show that in contrast to D. melanogaster, T. castaneum sense organs cannot be categorised based on the expression or their requirement for individual or combinations of conserved sense organ transcription factors such as cut and pox neuro, or members of the Achaete-Scute (Tc ASH, Tc asense), Atonal (Tc atonal, Tc cato, Tc amos), and neurogenin families (Tc tap). Rather, our observations support an evolutionary scenario whereby these sensory genes are required for the specification of sense organ precursors and the development and differentiation of sensory cell types in diverse external sensilla which do not fall into specific morphological and functional classes. CONCLUSIONS: Based on our findings and past research, we present an evolutionary scenario suggesting that sense organ subtype identity has evolved by recruitment of a flexible sensory gene network to the different sense organ specification processes. A dominant role of these genes in subtype identity has evolved as a secondary effect of the function of these genes in individual or subsets of sense organs, probably modulated by positional cues.

Keywords: Evolution; Gene expression; RNA interference; Sense organ development; Sense organ subtypes; Tribolium castaneum.


Conflict of interest statement

The authors declare that they have no competing interests.

Figures

Fig. 1
Fig. 1
Distribution and morphology of selected external sensilla in T. castaneum larvae. Scanning electron micrographs (SEMs) of ESO morphology and distribution in the 1st larval stage (ai), and morphology of sensilla in the 2nd larval stage (j). Anterior is towards the left in ak. a Whole larva: asterisks, position of tracheal pits; ant, antenna; h, head; t1–t3, thoracic segments 1–3; l1–l3, walking legs 1–3; a1–a8, abdominal segments 1–8; u, urogomphi; p, pygopods. b High magnification of head (ventral view) showing mouthparts: lb, labrum; mx, maxillae; md, mandibles; la, labium; and head sensilla grouped into clusters lab_qua, ver_tri, gen_tri, max_esc [41]. c, d Thoracic segments. e Abdominal segments (ventro-lateral view). f Abdominal TSOs, g ant_TSO, h BSM. i In the 1st larval stage, the CSGs have a bulb-shaped tip. j Open pore at the tip of a CSG at 2nd larval stage. k Schematic representation of 1st stage larvae showing the different types of ESOs, dorso-lateral view. Grey lettering indicates sensilla, which were not analysed in the RNAi experiments. The dashed line indicates the dorsal midline. Sensilla abbreviations, head: ant_TSO, antennal trichoid sensillum (olfactory); lab_qua, labrum quartet; ver_tri, vertex triplet; gen_tri, gena triplet; max_esc, maxilla escort. Thorax: adBSM, anterior-dorsal basiconic sensillum (mechanosensory); alBSM, anterior-lateral basiconic sensillum (mechanosensory); alCSM, anterior-lateral chaetoid sensillum (mechanosensory); dCSG, dorsal chaetoid sensillum (gustatory); dCSM1–2, dorsal chaetoid sensillum (mechanosensory) 1–2; mdBSM1–3, median-dorsal basiconic sensilla (mechanosensory) 1–3; pdBSM1–3, posterior-dorsal basiconic sensilla (mechanosensory) 1–3; plCSM, posterior-lateral chaetoid sensillum (mechanosensory). Abdomen: adBSM1–3, anterior-dorsal basiconic sensillum (mechanosensory) 1–3; alBSM, anterior-lateral basiconic sensillum (mechanosensory); dCSG1–2, dorsal chaetoid sensillum (gustatory); lTSO, lateral trichoid sensillum (olfactory); pdBSM, posterior-dorsal basiconic sensillum (mechanosensory); vTSO1–2, ventral trichoid sensilla (olfactory) 1–2
Fig. 2
Fig. 2
Comparison of Tc ASH and Tc ato expression patterns in the developing peripheral nervous system. Light micrographs of flat preparations stained with DIG labelled RNA probes. Anterior is towards the top. Open arrowheads: tracheal pits. a, b Tc ASH and Tc ato expression pattern in whole embryos at NS13. Arrows: expression in the antennae. Tc ato is strongly expressed in the whole tip of the antenna, while Tc ASH is expressed in small groups of cells. Small arrowheads: expression in the legs. Large arrows: expression in the lateral body wall. c In the three thoracic segments, Tc ASH is expressed in three dorso-ventral rows (anterior-dorsal (a), medio-dorsal (m), and posterior-dorsal (p)) dorsal to the appendages, covering all areas of ESOs development. Arrows: medio-lateral expression domain in t2 and t3 corresponding to an area which is devoid of ESOs in 1st stage larvae. Transcripts are visible in the legs. d In the thorax, Tc ato is expressed in a single group of cells at the posterior base of the legs, corresponding to plCSM, and a few groups in the legs (arrows). At approximately the same position, the Tc ato positive plTSO cluster is visible in the abdominal segments. Arrowhead in t1: additional Tc ato positive cluster. e In the most dorsal part of the abdominal segments (bracket), Tc ASH is expressed in many cells, covering the area from which the pdCSGs and BSMs arise. Tc ASH is also expressed in the ventro-lateral areas from which the three TSOs arise and in the ventral neuroectoderm (asterisk). f Tc ato is expressed in pdCSG2 and the three TSOs in the abdominal segments. For abbreviations, see Fig. 1. Scale bar in a, 100 μm in a, b; 25 μm in c, d, e, f
Fig. 3
Fig. 3
Comparison of the expression patterns of sense organ subtype-specific genes. Light micrographs of flat preparations stained with DIG labelled RNA probe of Tc ct, Tc cato, and Tc tap. Open arrowheads: tracheal pits; a, m, and p indicate the anterior-dorsal, medio-dorsal, and posterior-dorsal rows of expression, respectively, corresponding to the larval sensilla rows. ad Tc ct and Tc cato are expressed in the labrum and antennae. e NS14.1, arrowheads: Tc ct expression lateral to the appendages. Arrow: leg expression; asterisks: VNE expression. f NS14.2, ring-like arrangement of Tc ct+ cells in t1; row m has two clusters, dorsal (small arrowhead) and ventral (large arrowhead). In t2–3, Tc ct+ cells are aligned in row p and two clusters in row m (arrows). Scattered, cells are visible in row a. g NS14.1: Tc cato+ clusters arranged in a, m, and p rows in t1–3. Arrowheads: plSCM clusters. Arrow: leg expression. h NS14.2, Tc cato is expressed in rows a, p, and a medial cluster (asterisks) in t1–3. Arrowheads: plCSM. i NS14.1—arrowheads: expression of Tc ct around abdominal tracheal pits; asterisk: VNE. j NS14.2: Tc ct is expressed in row p; row a is only partially covered. k NS14.1, Tc cato+ clusters are visible in rows a, p. plTSO and pvTSO1–2 have prominent positions posterior and ventral to the tracheal pits, respectively (arrowheads). l NS14.2: plTSO, pvTSO1–2, and alBSM indicated. m NS15.1, Tc tap is expressed in plCSMs, alBSMs, and pdCSGs. Arrows: expression in appendages. n NS15.1, clear arrangement of Tc cato positive cells in a, m, and p rows. plCSM expression is decreased (asterisks); small arrowheads: alBSM; large arrowheads: plTSO and pvTSO1–2; arrow: expression in antenna. For abbreviations, see Fig. 1. Scale bar in d, 25 μm in al; scale bar in m, 100 μm in m, n
Fig. 4
Fig. 4
Comparison of the expression patterns of pan-neural genes. Light micrographs of flat preparations stained with DIG labelled RNA probe of Tc ase, Tc pros, and Tc sna. Open arrowheads: tracheal pits. a Tc ase is strongly expressed in the developing brain, the antennae, and the VNE (asterisk). Arrows: scattered Tc ase+ cells in the remaining appendages (arrows) and the lateral body wall (large arrowhead). Small arrowheads: plTSOs. b Small arrowheads: Tc pros expression in plTSOs. Large arrowheads: Tc pros expression dorsal to the tracheal pits in alBSMs. Tc pros is also strongly expressed in the developing brain, in clusters of cells in all appendages (arrows) and the VNE (asterisk). c Similarly, Tc sna is expressed in the brain, clusters of cells in the appendages (arrows) and VNE (asterisk). Large arrowheads: Tc sna is expressed in large clusters in the lateral body wall. The expression extending below the tracheal pits might correspond to the developing plTSOs (small arrowheads). d At NS15.1, groups and single cells express Tc pros in the lateral body wall, which seem to cover all areas of ESO formation. Additionally, the medial row that does not give rise to ESOs expresses Tc pros. Due to their prominent positions relative to the tracheal pits, the alBSM clusters, the plCSM clusters (large arrowhead), and the three TSO clusters (small arrowheads; plTSO, pvTSO1–2) are easily identifiable. e Tc sna shows a transient expression pattern in groups and single cells, some of which cover the areas where sensilla appear next to landmarks, such as the plCSMs (small arrowheads) in the thoracic segments and the plTSOs in the abdominal segments (large arrowhead). For abbreviations, see Fig. 1. Scale bar in a, 50 μm in ac; scale bar in d, 50 μm in d, e
Fig. 5
Fig. 5
Quantification of the RNAi phenotypes of external larval sensilla. The bars represent the percentages of phenotypes identified for the different ESO subtypes (BSMs, CSMs, CSGs, and TSOs) on the head (h), the thoracic (t1–t3), and the abdominal segments (a1–a8) of Tc ASH (a), Tc ato (b), Tc ct (c), Tc poxn RNAi (d), and the negative control cuticles (e), respectively. Sensilla that were not affected are categorised as ‘wildtype sensilla’. Sensilla showing a phenotype are divided into the four categories ‘missing sensilla’, ‘duplicated sensilla’, ‘reduced length of sensillum shaft’, and ‘only socket of sensillum present’, if applicable. a We analysed 387 specimens for both non-overlapping dsRNA fragments (NOF1 and 2) of Tc ASH larvae in total, of which 263 showed a specific phenotype (sensilla missing). b We analysed 119 specimens of Tc ato RNAi (NOF1 and NOF2 collectively), of which 61 showed a phenotype. Tc ato RNAi cuticles were missing the ant_TSOs (96.72%, see 3rd bar), and also observed a small percentage of duplicated sensilla and sensilla with reduced shaft lengths. c We were able to analyse only 26 specimens in total for both NOFs of Tc ct (n = 17 showed a phenotype). Sensilla of Tc ct cuticles could be grouped into the four different categories of phenotypes. The most abundant phenotype for all ESOs types was identified as ‘sensilla with reduced shaft lengths’ (purple). d We performed pRNAi in T. castaneum pupae to examine the function of Tc poxn. We analysed 111 specimens in total. 51.35% of the analysed specimens showed a phenotype which were identified as duplicated sensilla (CSMs on thorax, BSMs and TSOs on abdomen). See Additional file 1: Table S4 for summary of RNAi injection results
Fig. 6
Fig. 6
RNAi phenotypes of cuticles. Laser-scanning confocal images of L1 cuticles; anterior is to the left. a Sensilla analysed in RNAi experiments in a negative control cuticle. Please note that alBSM is not visible in a4 (empty turquoise circle). b On the head of the Tc ASH RNAi cuticle, only few CSGs and the ant_TSOs are present. c On t1–3 of Tc ASH RNAi cuticles, only pdCSG (t1), plCSMs and pdCSGs (t2 and t3) are present. The remaining CSMs and the two BSMs are missing. d On a1–8 of the Tc ASH RNAi cuticle, all three types of sensilla (BSMs, CSGs, and TSOs) are affected. e The Tc ato RNAi cuticle of the head shows missing ant_TSOs (yellow arrows). f, g The Tc poxn RNAi cuticle shows duplications of specific sensilla (plCSM, alBSM, and pvTSO1) on thorax and abdomen. f On the thorax, the plCSMs (dotted blue circle) are duplicated, and an additional sensillum is found between alBSM and plCSM on t2 and t3, which has the morphological characteristics of plCSMs (black arrows). g On a2–a8, pvTSO1s are duplicated in Tc poxn RNAi cuticles (dotted yellow circles). An additional sensillum is found posterior to the alBSMs in a1–6 (black arrows). The additional sensillum exhibits a longer shaft compared to the wildtype BSMs. h On the head of Tc ct RNAi cuticles, ant_TSOs (yellow arrows), CSMs and BSMs have shorter shafts (blue and turquoise circles). ver_tri1–2 are missing. i On t1, adCSM1, plCSM, and pdCSG develop a socket only. On t2, the alBSM is missing. j The shafts of the CSGs and alBSMs are shorter or only developed as sockets. plTSOs are missing; pvTSOs have shorter shafts. Asterisks in i and j indicate missing tracheal pits. Scale bar in a, 100 μm; scale bar in b, 50 μm
Fig. 7
Fig. 7
Evolutionary model of sense organ diversification in arthropods. The different colours represent additional diversity of morphology and function achieved by changes in the temporal expression and regulation of sensory genes. The numbers refer to the subsequent processes of sense organ development. See text for details. APs, accessory cell precursors; NPs, neural precursors

Similar articles

Cited by

References

    1. Barth FG. A spider’s world - senses and behavior: Springer; 2001. www.springer.com/de/book/9783540420460. Accessed 20 Nov 2017
    1. Dangles O, Irschick D, Chittka L, Casas J. Variability in sensory ecology: expanding the bridge between physiology and evolutionary biology. Q Rev Biol. 2009;84:51–74. doi: 10.1086/596463. - DOI - PubMed
    1. Hansson BS, Stensmyr MC. Evolution of insect olfaction. Neuron. 2011;72:698–711. doi: 10.1016/j.neuron.2011.11.003. - DOI - PubMed
    1. Stevens M. Sensory ecology, behaviour, and evolution. Oxford: Oxford University Press; 2013.
    1. Shanbhag SR, Müller B, Steinbrecht RA. Atlas of olfactory organs of Drosophila melanogaster: 1. Types, external organization, innervation and distribution of olfactory sensilla. Int J Insect Morph Embryol. 1999;28:377–397. doi: 10.1016/S0020-7322(99)00039-2. - DOI

Publication types