. 2021 Feb 5;12(1):8.
doi: 10.1186/s13229-020-00410-w.

Touch and olfaction/taste differentiate children carrying a 16p11.2 deletion from children with ASD

Affiliations

Touch and olfaction/taste differentiate children carrying a 16p11.2 deletion from children with ASD

Joana Maria Almeida Osório et al. Mol Autism. .

Abstract

Background: Sensory processing atypicalities are frequent in Autism Spectrum Disorder (ASD) and neurodevelopmental disorders (NDD). Different domains of sensory processing appear to be differentially altered in these disorders. In this study, we explored the sensory profile of two clinical cohorts, in comparison with a sample of typically developing children.

Methods: Behavioral responses to sensory stimuli were assessed using the Sensory Processing Measure (parent-report questionnaire). We included 121 ASD children, 17 carriers of the 16p11.2 deletion (Del 16p11.2) and 45 typically developing (TD) children. All participants were aged between 2 and 12 years. Additional measures included the Tactile Defensiveness and Discrimination Test-Revised, Wechsler Intelligence Scales and Autism Diagnostic Observation Schedule (ADOS-2). Statistical analyses included MANCOVA and regression analyses.

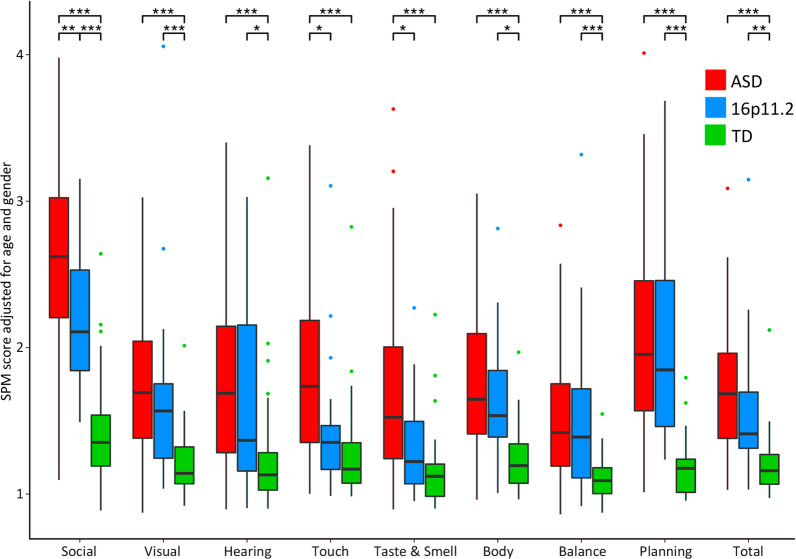
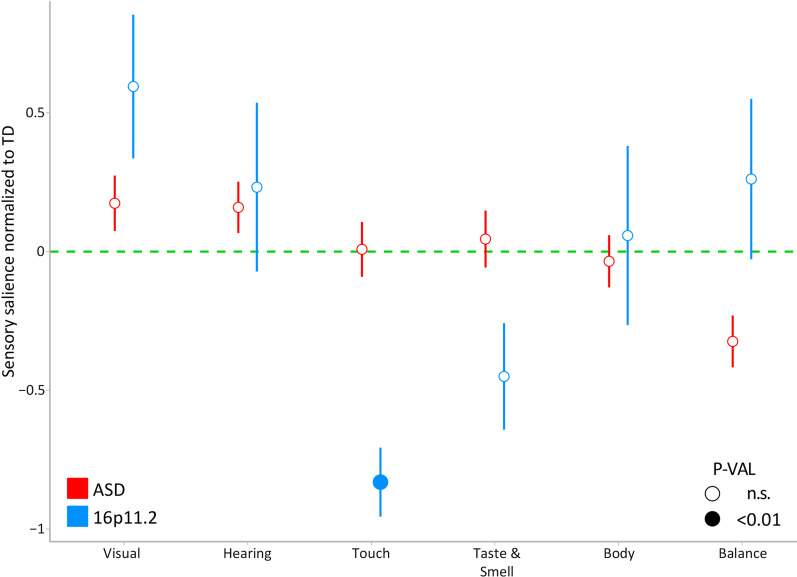
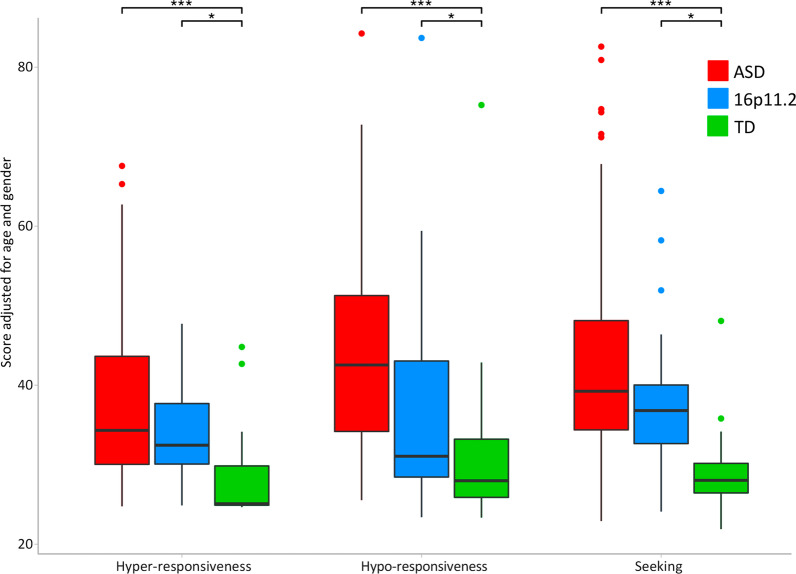
Results: ASD children score significantly higher on all SPM subscales compared to TD. Del16p11.2 also scored higher than TD on all subscales except for tactile and olfactory/taste processing, in which they score similarly to TD. When assessing sensory modulation patterns (hyper-, hypo-responsiveness and seeking), ASD did not significantly differ from del16p11.2. Both groups had significantly higher scores across all patterns than the TD group. There was no significant association between the SPM Touch subscale and the TDDT-R.

Limitations: Sensory processing was assessed using a parent-report questionnaire. Even though it captures observable behavior, a questionnaire does not assess sensory processing in all its complexity. The sample size of the genetic cohort and the small subset of ASD children with TDDT-R data render some of our results exploratory. Divergence between SPM Touch and TDDT-R raises important questions about the nature of the process that is assessed.

Conclusions: Touch and olfaction/taste seem to be particularly affected in ASD children compared to del16p11.2. These results indicate that parent report measures can provide a useful perspective on behavioral expression. Sensory phenotyping, when combined with neurobiological and psychophysical methods, might have the potential to provide a better understanding of the sensory processing in ASD and in other NDD.

Keywords: 16p11.2 deletion; Autism spectrum disorder (ASD); Children; Copy number variants (CNV); Olfaction; Sensory processing; Sensory processing measure (SPM); Touch.


Conflict of interest statement

The authors declare that they have no competing interests.

Figures

Fig. 1
Fig. 1
Group comparison on the SPM mean raw scores, adjusted for age and gender. Sensory scores as a function of modality and group (ASD, 16p11.2 deletion carriers and TD). Boxplots represent the SPM raw scores adjusted for age and gender. The bold black line inside each boxplot shows the median, and the bottom and top of the box show the 25th (quartile 1 [Q1]) and the 75th (quartile 3 [Q3]) percentile, respectively. The upper whisker ends at highest observed data value within the span from Q3 to Q3 + 1.5 times the interquartile range (Q3–Q1), and lower whisker ends at lowest observed data value within the span for Q1 to Q1-(1.5 * interquartile range). Points not reached by the whiskers are outliers. Significant post hoc group differences are labeled with stars on the top of the figure (*p < 0.05, **p < 0.01 and ***p < 0.001 after Bonferroni correction)
Fig. 2
Fig. 2
Salience of SPM scores. Salience score of the SPM adjusted for age and gender across modalities in both clinical groups (ASD, 16p11.2 deletion carriers). Scores are means normalized to TD (green dotted line). Error bars represent the standard error of the mean
Fig. 3
Fig. 3
Group comparison on modulation patterns. Sensory scores as a function of the modulation pattern of response (hyper-, hypo-responsiveness, and seeking) and group (ASD, 16p11.2 deletion carriers and TD). Boxplots represent the SPM raw scores adjusted for age and gender. The bold black line inside each boxplot shows the median, and the bottom and top of the box show the 25th (quartile 1 [Q1]) and the 75th (quartile 3 [Q3]) percentile, respectively. The upper whisker ends at highest observed data value within the span from Q3 to Q3 + 1.5 times the interquartile range (Q3–Q1), and lower whisker ends at lowest observed data value within the span for Q1 to Q1-(1.5 * interquartile range). Points not reached by the whiskers are outliers. Significant post hoc group differences are labeled with stars on the top of the figure (*p < 0.05, **p < 0.01 and ***p < 0.001 after Bonferroni correction)
Fig. 4
Fig. 4
Association between SPM total score and other continuous phenotypes. Estimated change (regression slope) in the expected value of several phenotypes for a given value of SPM total score. Y-axis values are the effect of a 1-unit increase in SPM total score in the expected value of NVIQ, ADOS-2 SA, ADOS-2 RBB and ADOS-2 Total scores, separately for ASD (red) and 16p11.2 deletion carriers (blue). Error bars represent standard error. The significance threshold was set at p < 0.05

References

    1. Rogers SJ, Ozonoff S. Annotation: what do we know about sensory dysfunction in autism? A critical review of the empirical evidence. J Child Psychol Psychiatry. 2005;46(12):1255–1268. doi: 10.1111/j.1469-7610.2005.01431.x. - DOI - PubMed
    1. Ben-Sasson A, Gal E, Fluss R, Katz-Zetler N, Cermak SA. Update of a meta-analysis of sensory symptoms in ASD: a new decade of research. J Autism Dev Disord. 2019;49(12):4974–4996. doi: 10.1007/s10803-019-04180-0. - DOI - PubMed
    1. Dellapiazza F, Vernhet C, Blanc N, Miot S, Schmidt R, Baghdadli A. Links between sensory processing, adaptive behaviours, and attention in children with autism spectrum disorder: a systematic review. Psychiatry Res. 2018;270:78–88. doi: 10.1016/j.psychres.2018.09.023. - DOI - PubMed
    1. Tomchek SD, Dunn W. Sensory processing in children with and without autism: a comparative study using the short sensory profile. Am J Occup Ther. 2007;61:190–200. doi: 10.5014/ajot.61.2.190. - DOI - PubMed
    1. Balasco L, Provenzano G, Bozzi Y. Sensory abnormalities in autism spectrum disorders: a focus on the tactile domain, from genetic mouse models to the clinic. Front Psychiatry. 2019;10:1016. doi: 10.3389/fpsyt.2019.01016. - DOI - PMC - PubMed

Publication types

MeSH terms

Supplementary concepts