. 2021 Feb 5;7(6):eabd0105.
doi: 10.1126/sciadv.abd0105. Print 2021 Feb.

Migratory earthquake precursors are dominant on an ice stream fault

Affiliations

Migratory earthquake precursors are dominant on an ice stream fault

G Barcheck et al. Sci Adv. .

Abstract

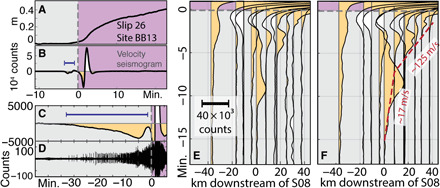
Simple fault models predict earthquake nucleation near the eventual hypocenter (self-nucleation). However, some earthquakes have migratory foreshocks and possibly slow slip that travel large distances toward the eventual mainshock hypocenter (migratory nucleation). Scarce observations of migratory nucleation may result from real differences between faults or merely observational limitations. We use Global Positioning System and passive seismic records of the easily observed daily ice stream earthquake cycle of the Whillans Ice Plain, West Antarctica, to quantify the prevalence of migratory versus self-nucleation in a large-scale, natural stick-slip system. We find abundant and predominantly migratory precursory slip, whereas self-nucleation is nearly absent. This demonstration that migratory nucleation exists on a natural fault implies that more-observable migratory precursors may also occur before some earthquakes.


Figures

Fig. 1
Fig. 1. Map of Whillans Ice Plain and example ice stream earthquakes showing slow precursory slip.
(A) Map of Whillans Ice Plain. Dark gray in background indicates grounded ice and light gray is floating ice. Darker gray line is the grounding line (22). The geodetic coupling overlay reflects the percent of total ice surface motion accommodated during ice stream earthquakes (14). Circles indicate GPS sites used. Important GPS proximal to the Central and Grounding Zone epicenters are light blue and orange, respectively. Stars are locations of the Central (purple) and Grounding Zone (yellow) epicenters (9). Triangles show broadband seismometer locations, with black triangles and labels indicating sites with data shown in Fig. 4. Black arrow shows ice flow direction at Central (blue) GPS. Map coordinates are in Antarctic Polar Stereographic (PS71). (B) Downstream displacement at all GPS during a type I event. Slow precursory slip occurs in a grounding zone proximal region [orange, red, and gray circles in (A) and same-colored lines in (B)], and high-speed slip is seen first at the Central GPS (light blue), indicating that high-speed slip began at the Central epicenter (purple star, A). (C) Downstream displacement at all GPS during a type II event. Slow precursory slip occurs near the Central GPS (light blue), and high-speed slip is seen first at the Grounding Zone GPS (orange), indicating that high-speed slip began at the Grounding Zone epicenter (yellow star, A). Hatched, colored bars in (B) and (C) show approximate duration of precursory motion at the correspondingly colored GPS, and the black bar shows approximate duration of ice stream earthquake, with onset of high-speed slip at the start.
Fig. 2
Fig. 2. Slip predictability of ice stream earthquakes.
Total displacement during each ice stream earthquake in the dataset as a function of recurrence time. (A) Displacement at the Central GPS (light blue circle, Fig. 1). (B) Displacement at the Grounding Zone GPS (orange circle, Fig. 1). (A and B): Colors correspond to event types described in Table 1.
Fig. 3
Fig. 3. Cartoon illustrations, example GPS data, and counts of dominant ice stream earthquake rupture types from Table 1.
(A, B, E, F, I, J, N, O, P, and Q) In cartoons, stars and circles correspond to epicenters and GPS locations from Fig. 1, and the dark gray line is the grounding line (22). Black triangle indicates seismic site S08. Dashed lines indicate precursory slip starting near the same-colored GPS. Solid colors indicate the main phase of high-speed unstable slip starting at same-colored GPS. The top panel of the GPS data (C, G, and K) is displacement in the downstream direction, and the bottom panel (D, H, and L) is the same data differentiated to velocity. (M) The same data as (K) over a longer time span. Downstream displacement in (K) has been normalized to zero at 45 min before the ice stream earthquake. GPS data color corresponds to site colors in Fig. 1. Gray bars indicate the velocity range spanning the middle 90% of velocity values.
Fig. 4
Fig. 4. Broadband seismic evidence of a migrating long-period precursor showing migrating basal slip.
(A) GPS downstream displacement and (B) corresponding broadband seismic data at site BB13 for event no. 26, starting 20:36, 30 December 2010 (9). Note the small precursory negative seismic excursion (blue bar). (C) Minimally processed seismic data from site S08, event no. 1 [starting 12:50, 14 December 2010 (9)], with a ~30-min-long negative long-period precursor (blue bar). (D) Same data with a 10- to 50-Hz bandpass filter applied, showing abundant basal icequakes, indicating that basal slip is occurring. (E and F) Two examples of spatial migration of the long-period seismic precursor, event no. 14, starting 01:01, 23 December 2010 (E), and event no. 7, starting 22:45, 18 December 2020 (F) (9). Black lines are minimally processed East component seismic data, rotated vertically and offset along the x axis by distance downstream of site S08. Tan fill indicates negative data, emphasizing the broadband seismic precursor. As plotted, seismic data go off-scale following onset of high-speed slip. Red dashed lines and values in (F) indicate approximate onset of long-period negative seismic precursor and approximate migration rates along flow. (All) Gray dashed line is the high-speed slip origin time (9). Duration of main ice stream earthquake is purple, with other data overlaid.

References

    1. Rice J. R., Ruina A. L., Stability of steady frictional slipping. J. Appl. Mech. 50, 343–349 (1983).
    1. Dieterich J. H., Earthquake nucleation on faults with rate- and state-dependent strength. Tectonophysics 211, 115–134 (1992).
    1. Tal Y., Hager B. H., Ampuero J. P., The effects of fault roughness on the earthquake nucleation process. J. Geophys. Res. Solid Earth 123, 437–456 (2018).
    1. McLaskey G. C., Earthquake initiation from laboratory observations and implications for foreshocks. J. Geophys. Res. Solid Earth 124, 12882–12904 (2019).
    1. Ruiz S., Metois M., Fuenzalida A., Ruiz J., Leyton F., Grandin R., Vigny C., Madariaga R., Campos J., Intense foreshocks and a slow slip event preceded the 2014 Iquique Mw 8.1 earthquake. Science 345, 1165–1169 (2014). - PubMed