. 2021 Feb 5;7(6):eabd6263.
doi: 10.1126/sciadv.abd6263. Print 2021 Feb.

Targeting oncoproteins with a positive selection assay for protein degraders

Affiliations

Targeting oncoproteins with a positive selection assay for protein degraders

Vidyasagar Koduri et al. Sci Adv. .

Abstract

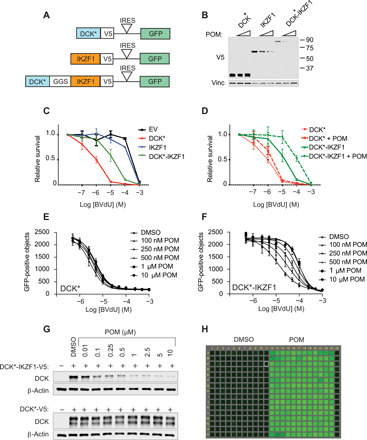
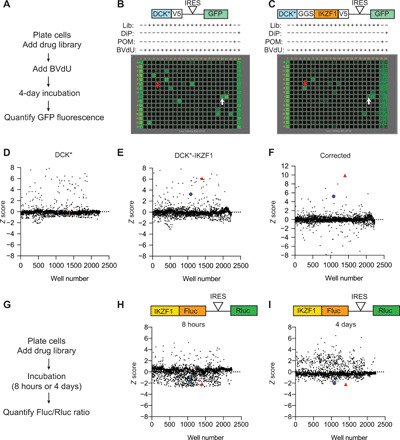
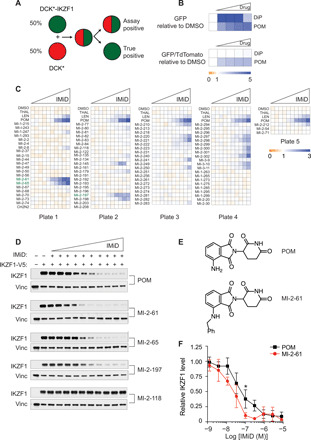
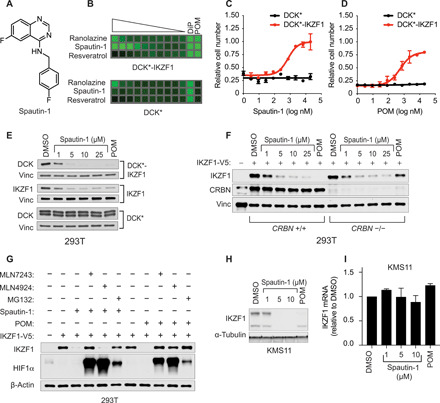
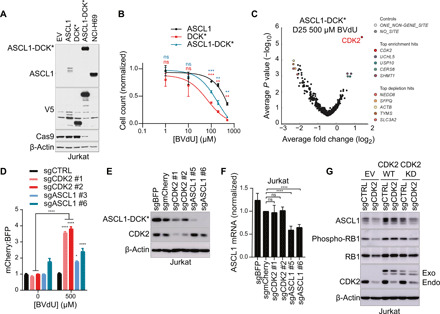
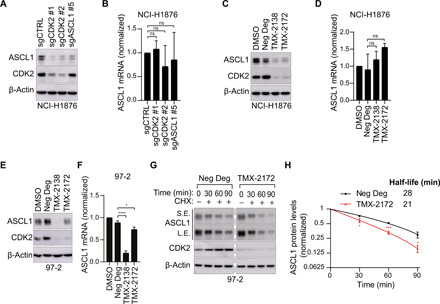
Most intracellular proteins lack hydrophobic pockets suitable for altering their function with drug-like small molecules. Recent studies indicate that some undruggable proteins can be targeted by compounds that can degrade them. For example, thalidomide-like drugs (IMiDs) degrade the critical multiple myeloma transcription factors IKZF1 and IKZF3 by recruiting them to the cereblon E3 ubiquitin ligase. Current loss of signal ("down") assays for identifying degraders often exhibit poor signal-to-noise ratios, narrow dynamic ranges, and false positives from compounds that nonspecifically suppress transcription or translation. Here, we describe a gain of signal ("up") assay for degraders. In arrayed chemical screens, we identified novel IMiD-like IKZF1 degraders and Spautin-1, which, unlike the IMiDs, degrades IKZF1 in a cereblon-independent manner. In a pooled CRISPR-Cas9-based screen, we found that CDK2 regulates the abundance of the ASCL1 oncogenic transcription factor. This methodology should facilitate the identification of drugs that directly or indirectly degrade undruggable proteins.


Figures

Fig. 1
Fig. 1. Design of positive selection assay for protein degraders.
(A) Vector schematic. DCK*, variant deoxycytidine kinase with Ser74Glu, Arg104Met, and Asp133Ala substitutions; V5, V5 epitope tag; GGS, Gly-Gly-Ser spacer; IRES, internal ribosomal entry site. (B) Immunoblot analysis of 293FT cells infected with the lentiviral vectors depicted in (A) and then treated with 1 or 10 μM POM, as indicated by the triangles, for 24 hours. (C and D) Relative survival of 293FT cells infected with the lentiviral vectors depicted in (A) and then treated with the indicated concentrations of BVdU for 4 days. In (D), cells were also treated with 1 μM (POM) starting 24 hours before BVdU was added. n = 3 biological replicates. (E and F) Number of GFP-positive 293FT cells infected to produce DCK* (E) or DCK*-IKZF1 (F) using the vectors in depicted in (A) and then treated with indicated concentrations of POM and BVdU in 384-well plate format. POM was added 24 hours before treatment with BVdU for 4 days. n = 4 biological replicates. (G) Immunoblot analyses of cells treated as in (E) and (F). (H) Fluorescence data of 384-well plate containing 293FT cells expressing DCK*-IKZF1 treated with DMSO (columns 1 to 11 and 24) or 1 μM POM (columns 12 to 23), followed 24 hours later by the addition of 100 μM BVdU for 4 days (columns 1 to 24).
Fig. 2
Fig. 2. Comparison of positive selection and negative selection protein degradation assays.
(A) Scheme for positive selection protein degradation assay. (B and C) Representative fluorescence data of 384-well plates containing 293FT cells expressing DCK* (B) or DCK*-IKZF1 (C) treated with compounds in the Selleck BioActive Library (one compound per well), followed 24 hours later by the addition of BVdU at the EC85 (10 and 100 μM, respectively) for 4 days. BVdU was omitted in column 1. Columns 23 and 24 contained 10 μM POM and 12.5 μM dipyridamole (DiP), respectively. Library wells containing POM and DiP are indicated by the red and white arrows, respectively. (D and E) Z-distribution of GFP fluorescence of DCK* cells (D) and DCK*-IKZF1 cells (E) screened with the full Selleck BioActive Library. LEN and POM are indicted by the blue circle and red triangle, respectively. n = 2 biological replicates. (F) Corrected z scores obtained by subtracting z scores in (D) from z scores in (E). (G) Scheme for negative selection screening using the dual-luciferase reporter assay. (H and I) Z scores of Fluc/Rluc ratio of 293FT IKZF1-Fluc-IRES-Rluc cells after screening with the Selleck BioActive Library for 8 hours (H) or 4 days (I). n = 2 biological replicates.
Fig. 3
Fig. 3. Identification of novel IMiDs using multiplexed positive selection protein degradation assay.
(A) Scheme for in-well GFP/TdTomato competition assay. 293FT cells were infected to produce DCK*-IKZF1 and GFP or DCK* and TdTomato using bicistronic vectors analogous to those depicted in Fig. 1A. (B) Top: Heatmap of the fold change (relative to treatment with DMSO) of GFP fluorescence of a 1:1 mixture of GFP-positive DCK*-IKZF1 and TdTomato-positive DCK* cells treated with 3.125, 6.25, 12.5, or 25 μM POM or dipyridamole or with vehicle (DMSO) and followed 1 day later by the addition of 100 μM BVdU for 4 days. Bottom: Heatmap of the fold change (relative to treatment with DMSO) of the ratio of GFP fluorescence to TdTomato fluorescence of the cells treated in (A). n = 2 biological replicates. (C) Heatmap of the fold change (relative to treatment with DMSO) of the ratio of GFP to TdTomato fluorescence of a 1:1 mixture of GFP-positive DCK*-IKZF1 and TdTomato-positive DCK* cells treated with 1.3 nM, 3.8 nM, 11.4 nM, 34 nM, 102 nM, 310 nM, 920 nM, 2.78 μM, 8.33 μM, and 25 μM of the indicated IMiDs, as indicated by the triangles, or with vehicle (DMSO), and followed 1 day later by the addition of 100 μM BVdU for 4 days. n = 2 biological replicates. (D) Immunoblot analysis of 293FT cells lentivirally transduced to express IKZF1-V5 and treated with the indicated IMiD derivatives for 24 hours using the same concentration range as in (C). (E) Structures of POM and IMiD MI-2-61. (F) Quantification of immunoblot data in (D); n = 2 biological replicates.
Fig. 4
Fig. 4. Spautin-1 targets IKZF1 for proteasomal degradation in a cereblon-independent manner.
(A) Chemical structure of Spautin-1. (B) GFP fluorescence of DCK*-IKZF1 and DCK* 293FT cells treated with ranolazine, Spautin-1, and resveratrol at concentrations of 25 μM, 8.33 μM, 2.78 μM, 920 nM, 310 nM, 102 nM, 34 nM, 11.4 nM, 3.8 nM, and 1.3 nM, as indicated by the triangle, followed 24 hours later by the addition of BVdU at the EC85. Shown for comparison are cells treated with POM (10 μM) or dipyridamole (DiP) (12.5 μM) before adding BVdU. n = 2 biological replicates. (C and D) Quantification of GFP fluorescence from (B) for Spautin-1 (C) and for an analogous titration with POM (D). (E) Immunoblot analysis of 293FT cells infected with lentiviruses as in Fig. 1A and treated with the indicated concentrations of Spautin-1 for 24 hours. (F) Immunoblot analysis of isogenic 293FT CRBN +/+ and CRBN −/− cells transduced to express IKZF1-V5 and treated with the indicated concentrations of Spautin-1 or POM (1 μM) for 24 hours. (G) Immunoblot analysis of 293FT cells stably expressing IKZF1-V5 and simultaneously treated with MLN7243 (1 μM), MLN4924 (1 μM), MG132 (1 μM), Spautin-1 (10 μM), or POM (1 μM) for 24 hours as indicated. (H and I) Immunoblot (H) and RT-qPCR (I) analysis of KMS11 multiple myeloma cells treated with indicated concentrations of Spautin-1 or POM (1 μM) for 24 hours. n = 3 biological replicates.
Fig. 5
Fig. 5. Identification of CDK2 as an ASCL1 protein stabilizer using CRISPR-Cas9 positive selection screening.
(A) Immunoblot analysis of Jurkat cells first infected to express Cas9 and then superinfected to express exogenous ASCL1, DCK*, or the ASCL1-DCK* fusion. NCI-H69 cells are included as a benchmark for ASCL1 endogenous expression. (B) Growth inhibition (%), based on viable cell numbers relative to untreated controls, of the indicated cell lines from (A) treated with BVdU for 6 days. n = 2 biological replicates. (C) Hypergeometric analysis of BVdU positive selection CRISPR-Cas9 screen on day 25 relative to day 10 (early time point before BVdU treatment) of ASCL1-DCK* Cas9 Jurkat cells treated with 500 μM BVdU. n = 2 biological replicates. (D) Quantification of fold change in mCherry:BFP ratio after 18 days of 500 μM BVdU or DMSO (0) treatment of ASCL1-DCK* Cas9 Jurkat cells expressing the indicated sgRNAs and mCherry or a nontargeting control sgRNA and blue fluorescent protein (BFP) (initially mixed 1:3). n = 3 biological replicates. (E) Immunoblot and (F) RT-qPCR analysis of ASCL1-DCK* Cas9 Jurkat cells superinfected to express the indicated sgRNAs. n = 4 biological replicates. (G) Immunoblot analysis of Jurkat cells first infected with a lentivirus to stably express exogenous ASCL1, then infected with Dox-inducible (DOX-On) sgRNA-resistant CDK2 wild-type (WT) or CDK2 kinase-dead (KD) mutant, and lastly superinfected with a CDK2 or nontargeting sgRNA. Following superinfection with the sgRNA lentiviruses, cells were grown in DOX to maintain exogenous CDK2 expression. n = 4 biological replicates. Exo, exogenous CDK2; Endo, endogenous CDK2. Error bars represent SD. ns, nonsignificant; *P < 0.05; ***P < 0.001; ****P < 0.0001.
Fig. 6
Fig. 6. CDK2 inactivation destabilizes ASCL1 protein in SCLC cell lines.
(A) Immunoblot and (B) RT-qPCR analysis of the NCI-H1876 SCLC cell line that endogenously expresses ASCL1 infected to express the indicated sgRNAs. n = 3 biological replicates. (C and E) Immunoblot and (D and F) RT-qPCR analysis of NCI-H1876 human SCLC cells (C and D) and 97-2 mouse SCLC cells (E and F) after treatment with the CDK2 PROTAC degraders (TMX-2138 and TMX-2172) or the indicated negative controls, all used at 500 nM for either 36 hours (C and D) or 8 hours (E and F). Neg Deg, negative control degrader ZXH-7035. n = 3 biological replicates. (G) Immunoblot analysis and (H) quantification of ASCL1 protein levels in 97-2 cells first treated with the CDK2 PROTAC degrader or negative control (500 nM) for 4 hours and then treated with cycloheximide (CHX) (150 μg/ml) for the indicated times. S.E., short exposure; L.E., long exposure. n = 4 biological replicates. In all experiments, error bars represent SD except in (H), where error bars represent SEM. *P < 0.05; ***P < 0.001; ****P < 0.0001.

References

    1. Krönke J., Udeshi N. D., Narla A., Grauman P., Hurst S. N., Conkey M. M., Svinkina T., Heckl D., Comer E., Li X., Ciarlo C., Hartman E., Munshi N., Schenone M., Schreiber S. L., Carr S. A., Ebert B. L., Lenalidomide causes selective degradation of IKZF1 and IKZF3 in multiple myeloma cells. Science 343, 301–305 (2014). - PMC - PubMed
    1. Lu G., Middleton R. E., Sun H., Naniong M. V., Ott C. J., Mitsiades C. S., Wong K.-K., Bradner J. E., Kaelin W. G. Jr., The myeloma drug lenalidomide promotes the cereblon-dependent destruction of Ikaros proteins. Science 343, 305–309 (2014). - PMC - PubMed
    1. Kaelin W. G. Jr., Common pitfalls in preclinical cancer target validation. Nat. Rev. Cancer 17, 441–450 (2017). - PubMed
    1. Neschadim A., Wang J. C. M., Sato T., Fowler D. H., Lavie A., Medin J. A., Cell fate control gene therapy based on engineered variants of human deoxycytidine kinase. Mol. Ther. 20, 1002–1013 (2012). - PMC - PubMed
    1. Gandhi A. K., Kang J., Havens C. G., Conklin T., Ning Y., Wu L., Ito T., Ando H., Waldman M. F., Thakurta A., Klippel A., Handa H., Daniel T. O., Schafer P. H., Chopra R., Immunomodulatory agents lenalidomide and pomalidomide co-stimulate T cells by inducing degradation of T cell repressors Ikaros and Aiolos via modulation of the E3 ubiquitin ligase complex CRL4CRBN. Br. J. Haematol. 164, 811–821 (2014). - PMC - PubMed

Publication types

MeSH terms