. 2021 Feb 5;7(6):eabe1100.
doi: 10.1126/sciadv.abe1100. Print 2021 Feb.

Fairy circles reveal the resilience of self-organized salt marshes

Affiliations

Fairy circles reveal the resilience of self-organized salt marshes

Li-Xia Zhao et al. Sci Adv. .

Abstract

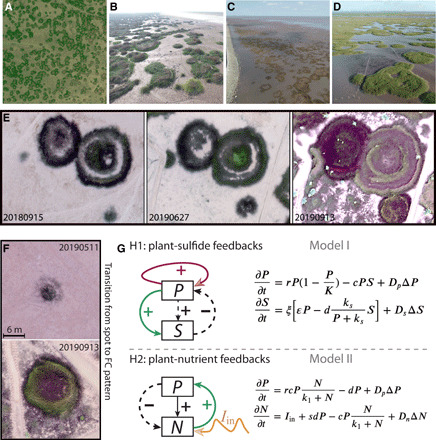
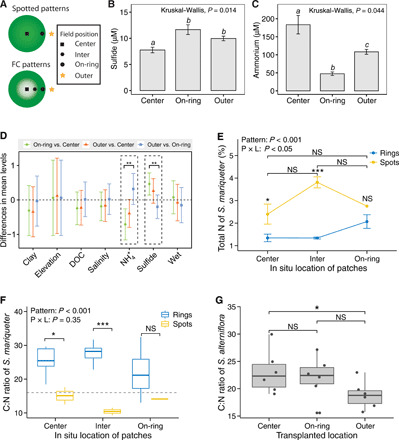
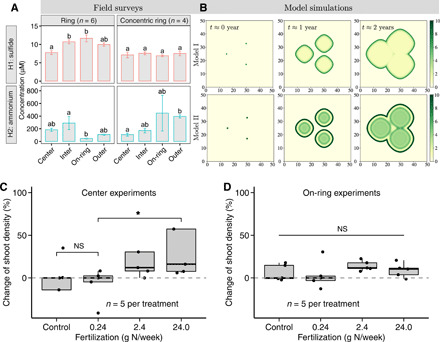
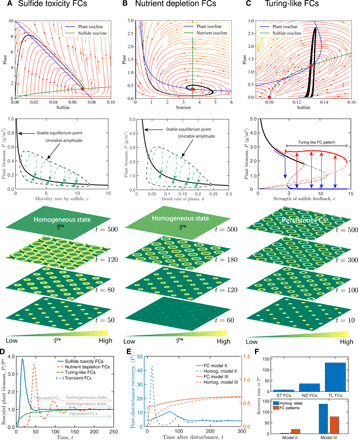
Spatial patterning is a fascinating theme in both theoretical and experimental ecology. It reveals resilience and stability to withstand external disturbances and environmental stresses. However, existing studies mainly focus on well-developed persistent patterns rather than transient patterns in self-organizing ecosystems. Here, combining models and experimental evidence, we show that transient fairy circle patterns in intertidal salt marshes can both infer the underlying ecological mechanisms and provide a measure of resilience. The models based on sulfide accumulation and nutrient depletion mechanisms reproduced the field-observed fairy circles, providing a generalized perspective on the emergence of transient patterns in salt marsh ecosystems. Field experiments showed that nitrogen fertilization mitigates depletion stress and shifts plant growth from negative to positive in the center of patches. Hence, nutrient depletion plays an overriding role, as only this process can explain the concentric rings. Our findings imply that the emergence of transient patterns can identify the ecological processes underlying pattern formation and the factors determining the ecological resilience of salt marsh ecosystems.


Figures

Fig. 1
Fig. 1. Widespread spatial distributions of FC patterns and the typical spatiotemporal dynamics in intertidal salt marshes of the Chinese coast.
(A) South of Hangzhou Bay, coexistence of spots, and FC patterns in S. alterniflora. (B) Yangtze Estuary North Branch, spots, and FCs in S. alterniflora in April 2017. (C) CDNR, FCs in S. mariqueter in October 2018. (D) Nanhui shoal of Shanghai, coexistence of spots, FCs, and concentric rings in S. mariqueter in July 2018. (E) Temporal evolution of representative FC patterns within an annual cycle. Drone images of FC patterns for S. mariqueter in Nanhui shoal, Shanghai (30°59′50.99″N, 121°56′33.29″E). (F) Drone images in May and September 2019 showing transition from spot to FC patterns. (G) Two main hypotheses and corresponding mathematical models explaining the observed FC patterns in the salt marsh ecosystems. Model I describes a fast-slow system between plants and hydrogen sulfide (H2S) that could function as an inhibitor to plant growth. Model II represents the nutrient depletion hypothesis when high densities of plants appear at the center of patches. The models are described mathematically in the right panels (see Materials and Methods and table S1 for more detailed definitions of the variables and parameters in the models). Photo credit: Li-Xia Zhao (A to D) and Quan-Xing Liu (E and F).
Fig. 2
Fig. 2. In situ field measurements and salt marsh grass transplantations used to test the potential mechanisms that trigger FC pattern formation in salt marsh ecosystems.
(A) Schematic illustration of measuring positions in spot and FC patterns to infer the potential mechanisms of FC patterns. (B and C) Concentration changes of the sulfide and ammonium in the center, on-ring, and outer of ring-type patterns. Letters above bars indicate significant differences (P < 0.05). (D) Physical, chemical, and sediment properties were sampled along a spatial gradient of FC patterns. Black dashed boxes indicate statistically significant properties at P < 0.05, while error bars indicate ±SD (n = 7). The detailed concentrations at each position were shown in fig. S7. (E) Total nitrogen composition of S. mariqueter leaves collected at different locations. Error bars indicate ±1 SD from the patch means (n = 6 patches). Pattern (P) × location (L), F2,23 = 4.27, P = 0.03. (F) Stoichiometric changes in the C:N ratio of plant leaves of S. mariqueter at three different locations (n = 6). Pattern × location, F2,23 = 1.12, P = 0.35. A reference stoichiometric ratio C:N of 16:1 is indicated by the dashed black line. (G) Leaf C:N stoichiometric analysis of S. alterniflora seedlings transplanted into different locations in ring-type patterns of S. alterniflora. Box plots depict the median (horizontal line), first and third quartiles (box), and the lowest and highest data points within 1.5-fold of the interquartile range of the first and third quartiles, respectively. Significant differences are denoted by different symbols, with ***P < 0.001, **P < 0.01, *P < 0.05, and “NS” for P > 0.05 (see tables S2 to S4 for detailed statistical analyses).
Fig. 3
Fig. 3. Theoretical models and field experiments to confirm underlying mechanisms.
(A) Spatial variations of H2S and NH4+ concentrations collected from ring-type patterns and concentric rings, respectively. Different lowercase letters above error bars represent statistically different groups identified by post hoc least significant difference tests with level of significance set at P < 0.05. The error bars indicate mean ± SE (n = 7, the numbers of sampled patches) (see tables S5 and S6 for detailed explanation of statistical parameters). (B) Theoretical simulations of models I and II, respectively, for FC pattern formation. Both models were implemented starting from the same initial conditions (three solutions). The color bars depict the plant biomass per square meter (g/m2). Left to right: Spatial patterns corresponding to each time point at yearly increments from seed colonization. The parameters used in these numerical simulations are shown in table S1. These simulations are shown over time in movies S1 and S2, respectively. (C and D) Effect of fertilization on plant growth in terms of the percentage change of net shoot density at the patch center and on the rings, respectively. Box plots depict the median (horizontal line), first and third quartiles (box), and the lowest and highest data points within 1.5-fold of the interquartile range of the first and third quartiles, respectively. Significant differences are denoted by P values using the nonparametric Wilcoxon rank sum test followed by post hoc comparison.
Fig. 4
Fig. 4. Attraction and stabilities of the homogeneous vegetation state, as well as resilience of transient FCs and persistent Turing-like FCs.
(A to C) Dynamics behaviors of three self-organized mechanisms of FC patterning. Top row: Attraction and stability of the positive equilibrium (vegetation state) with the phase portrait of system kinetics for transient and persistent FCs. Both transient FCs are global asymptotic stability, whereas persistent FCs are local asymptotic stability. Middle row: Bifurcation diagrams showing the amplitudes of FC patterned solutions and their stability were plotted in terms of plant biomass as a function of the parameter, c. Solid lines mark stable portions of the branch; dashed lines mark unstable portions. Bottom row: Typical spatial patterns and transition from the same spatial regular seedling clusters to FCs or a homogeneous steady state. (D) Trajectories of the distinctive patterned models when they return to pre-disturbance equilibrium after a temporary disturbance. (E) Recovery speed of the transient FCs and persistent FCs for self-organized patterns and spatial homogeneous scenarios. For all simulations, the plants were seeded at 40% of their positive equilibrium point (P*, red solid circles as shown in the top row). (F) Statistical comparisons for the recovery time of FC patterns among simulation models as well as the homogeneous state. Here, time was taken for 95% recovery to P*. ST FCs, sulfide toxicity FCs; ND FCs, nutrient depletion FCs; TL FCs, Turing-like FCs. The actual phase planes were shown for models with parameter values listed in table S1.
Fig. 5
Fig. 5. Observed spatiotemporal behavior of FC patterns obtained from 2012, 2013, 2014, 2015, and 2018 satellite images and patch growth curves.
(A) The satellite images show the spots spanning over many meters in the radial direction from their centers and forming the FC patterns over time. Satellite images were taken from Google Earth of the Shanghai coastal area at coordinate 31°14′14.94″N, 121°49′38.25″E, where the dominant species is Z. latifolia within the focused area. (B) Patch size growth rate versus patch size in the radial direction, where the data were extracted from these satellite images. The growth rate reveals a stretched Allee-like effect behavior (solid black curve) rather than one based on positive feedback alone (blue dashed curve). Curves were calculated (fit lines) using the mathematical formulas f(x) = r(xN1)(1 − x/N2) exp(−α x) (AIC = 1631.9, R2 = 0.49, P < 0.001) and a positive feedback g(x) = exp(−0.29x + 1.56) (AIC = 1361.8, R2 = 0.43, P < 0.001) with parameters r = 2.2, α = 0.2, N1 = 2.0, and N2 = 12.0. The fixed points of f(x) = 0 correspond to the critical sizes needed to survive (see table S7 for detailed statistical properties of exponential model and Allee effect model).

References

    1. Klausmeier C. A., Regular and irregular patterns in semiarid vegetation. Science 284, 1826–1828 (1999). - PubMed
    1. Rietkerk M., Dekker S. C., de Ruiter P. C., van de Koppel J., Self-organized patchiness and catastrophic shifts in ecosystems. Science 305, 1926–1929 (2004). - PubMed
    1. Pringle R. M., Tarnita C. E., Spatial self-organization of ecosystems: Integrating multiple mechanisms of regular-pattern formation. Annu. Rev. Entomol. 62, 359–377 (2017). - PubMed
    1. van de Koppel J., Gascoigne J. C., Therautaz G., Rietkerk M., Mooij W. M., Herman P. M. J., Experimental evidence for spatial self-organization and its emergent effects in mussel bed ecosystems. Science 322, 739–742 (2008). - PubMed
    1. van de Koppel J., Rietkerk M., Dankers N., Herman P. M. J., Scale-dependent feedback and regular spatial patterns in young mussel beds. Am. Nat. 165, E66–E77 (2005). - PubMed

Publication types