. 2021 Feb 25;148(4):dev197566.
doi: 10.1242/dev.197566.

Precision of tissue patterning is controlled by dynamical properties of gene regulatory networks

Affiliations

Precision of tissue patterning is controlled by dynamical properties of gene regulatory networks

Katherine Exelby et al. Development. .

Abstract

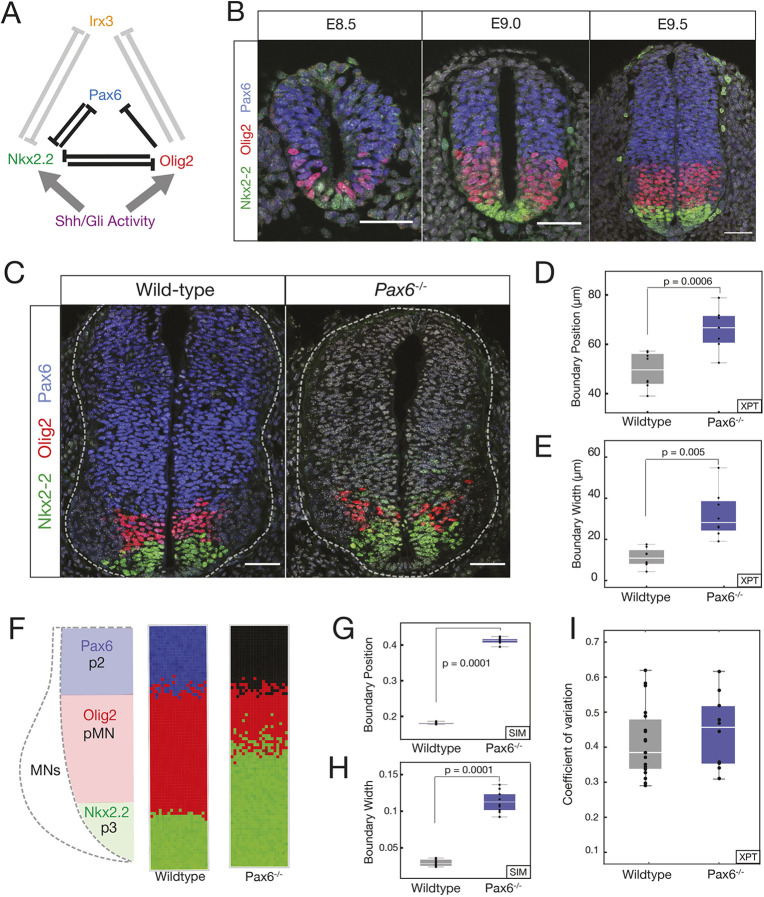
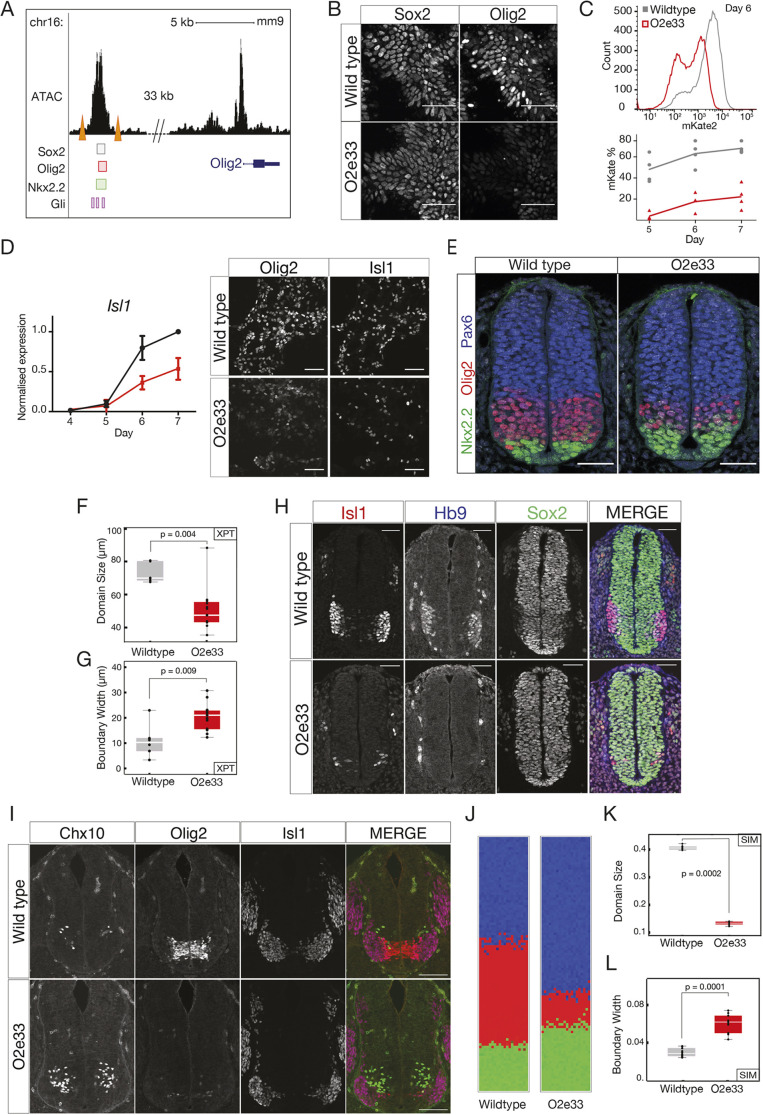
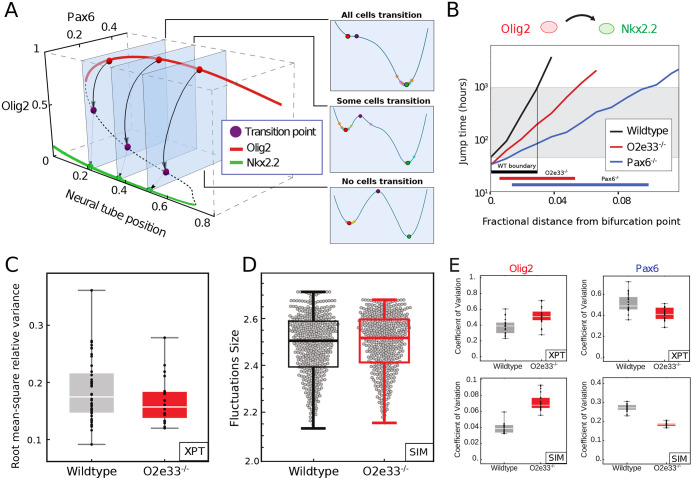
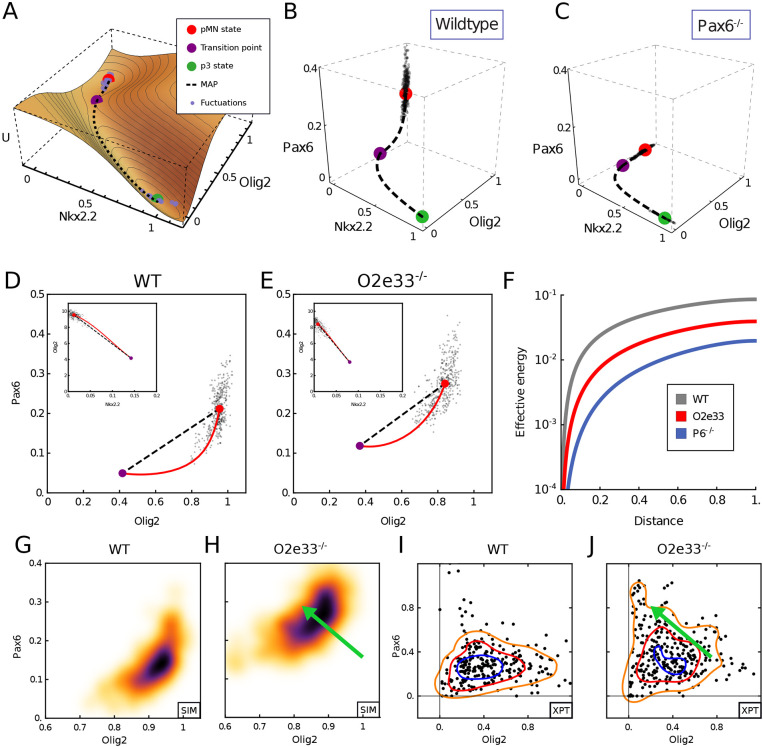
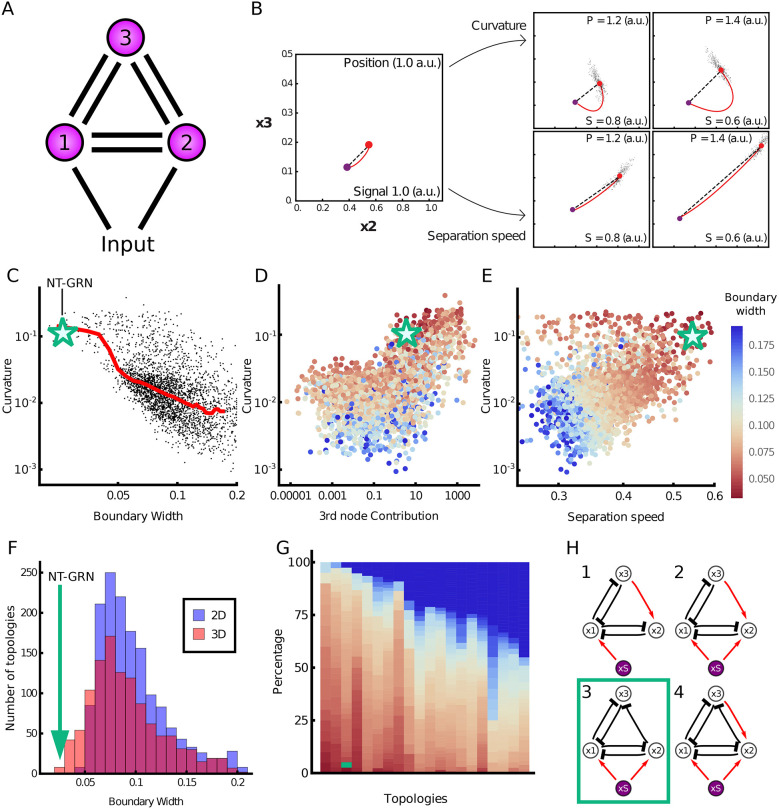
During development, gene regulatory networks allocate cell fates by partitioning tissues into spatially organised domains of gene expression. How the sharp boundaries that delineate these gene expression patterns arise, despite the stochasticity associated with gene regulation, is poorly understood. We show, in the vertebrate neural tube, using perturbations of coding and regulatory regions, that the structure of the regulatory network contributes to boundary precision. This is achieved, not by reducing noise in individual genes, but by the configuration of the network modulating the ability of stochastic fluctuations to initiate gene expression changes. We use a computational screen to identify network properties that influence boundary precision, revealing two dynamical mechanisms by which small gene circuits attenuate the effect of noise in order to increase patterning precision. These results highlight design principles of gene regulatory networks that produce precise patterns of gene expression.

Keywords: Dynamical systems theory; Gene regulatory network; Morphogen signaling; Neural tube; cis regulatory elements.


Conflict of interest statement

Competing interestsThe authors declare no competing or financial interests.

Figures

Fig. 1.
Fig. 1.
Pax6 contributes to boundary precision. (A) Schematic of the GRN responsible for positioning the p3 and pMN domains. (B) Immunofluorescence assays of Pax6 (blue), Olig2 (red) and Nkx2.2 (green) in neural progenitors from E8.5 to E9.5. (C) WT and Pax6−/− embryos assayed for Olig2, Pax6 and Nkx2.2. (D) Position of the pMN-p3 boundary in WT (grey) and Pax6−/− (blue). n=7 (WT), n=8 (Pax6−/−), P=0.005. (E) Width of pMN-p3 boundary in WT (grey) and Pax6−/− (blue) (P=0.0006). (F) Stochastic simulations of the GRN in WT (middle) and Pax6−/− (right). (G,H) Boundary position and width from simulations. Width is given as the fraction of total neural tube size. n=10 (WT), n=10 (Pax6−/−), P=0.0001 for position and boundary width. (I) CV of Olig2 levels for WT and Pax6−/− (P=0.422). Box plots show upper and lower quartile and mean. Statistical significance was determined using a Mann–Whitney test. Scale bars: 50 μm
Fig. 2.
Fig. 2.
An Olig2 enhancer affects precision of the pMN-p3 boundary. (A) Chromatin accessibility (ATAC-seq) and predicted TF binding locations around Olig2. Orange triangles indicate the CRISPR target sites for deletion of the O2e33−/− (Metzis et al., 2018; Kutejova et al., 2016; Peterson et al., 2012; Oosterveen et al., 2012). (B) Sox2 (expressed in all neural progenitors) and Olig2 at day 6 in neural progenitors differentiated from WT and O2e33−/− ESCs exposed to 500 nM SAG. (C) Flow cytometry (top) for mKate2 fluorescence in Olig2-T2A-mKate2 ESC-derived neural progenitors exposed to 500 nM SAG. (D) RT-qPCR indicates that Isl1 is decreased in O2e33−/− (red) cells compared with WT (black) cells differentiated under spinal cord conditions. Similarly, Olig2- and Isl1-expressing cells are reduced in mutant compared with WT. Data are mean±s.d. (E) Olig2, Pax6 and Nkx2.2 in transverse sections of E9.5 neural tube from WT and O2e33−/− (red, Olig2; green, Nkx2.2). (F,G) Domain size and boundary width in WT (grey) and O2e33−/− mutants (red). n=6 (WT), n=12 (O2e33), P=0.004. The p3-pMN boundary is wider in O2e33−/− mutants compared with WT (P=0.009). (H) Isl1- and Hb9-expressing motor neurons are reduced in O2e33−/− embryos compared with WT. (I) Chx10-expressing V2 neurons increase in the 02e33−/− mutant. (J) Simulations of the O2e33−/− model recapitulate in vivo observations of a narrower pMN domain and decreased precision of the p3-pMN boundary. (K,L) Boundary width (I) and position (H) from simulations. n=10 (WT), n=10 (O2e33), P=0.0001. Box plots show upper and lower quartile and mean. Statistical significance was determined using a Mann–Whitney test. Scale bars: 50 μm (B,D,E,H); 100 μm (I).
Fig. 3.
Fig. 3.
The rate of transition between progenitor states is determined by the GRN structure. (A) A three-dimensional bifurcation diagram illustrates bistability for pMN (red; expressing Olig2 and Pax6) and p3 (green; expressing Nkx2.2) with a transition point (unstable fixed point of dynamics, purple). Noise-driven transition pathway (formally, MAP) from pMN to p3 is indicated by black arrows. Right panels: Conceptual representations of the transitions as one-dimensional Waddington landscape sketches. (B) Fate jump times calculated from simulations: pMN to p3 in WT (black), Pax6−/− (blue) and O2e33−/− mutants (red). Fractional distance refers to distance from the bifurcation point. Grey shading indicates where transitions can occur on developmental timescales. (C) Total variance in gene expression per embryo (Olig2 and Pax6) within the pMN domain for WT (grey) and O2e33−/− embryos (red). Relative root-mean-square variance of WT and O2e33−/− embryos captures the total noise of the system. There was no significant change in the noise levels between genotypes (P>0.05). (D) Measurements of noise in silico in the pMN domain in WT and O2e33−/−. Each grey point represents an individual configuration (supplementary Materials and Methods, P>0.05). (E) CV for Olig2 (left) and Pax6 (right) in WT (grey) and O2e33−/− (red) from experimental data (top) and in silico simulations (bottom). Box plots show upper and lower quartile and mean. Statistical significance was determined using a Mann–Whitney test.
Fig. 4.
Fig. 4.
Mutant phenotypes affect the configuration of gene expression fluctuations. (A) A quasi-potential (U) representation of the neural tube dynamical system in the region in which noise-driven transitions result in heterogeneity between pMN and p3 states. The landscape is a sketch to aid visualisation of the MAP, which is directly calculated from the system. (B,C) Gene expression space view of the transition path from pMN (red point) to p3 (green point) steady states via the transition point (purple point). Simulated trajectory (dots) shows stochastic fluctuations from the pMN steady state. Axes show relative expression levels. WT (left) and Pax6−/− (right) for neural tube position at fraction 0.1 of total neural tube length dorsal to the bifurcation point. (D,E) Projection into Olig2-Pax6 gene expression space of the MAP (red) predicted from the model and simulated trajectory (dots) in WT (I) and O2e33−/− (J) at the same position as G and H. Insets show projection onto Nkx2.2-Olig2 axes. (F) Effective energy barrier (cumulative action) for noise-induced transitions, plotted along the transition path (normalised to unit length) at the same neural tube positions as G and J. WT (grey) has a higher barrier than O2e33−/− (red), leading to longer jump times; O2e33−/− in turn has a higher barrier than Pax6−/− (blue). (G,H) Simulated Pax6 and Olig2 expression levels (black dots) for WT and O2e33−/− in regions proximal to the p3-pMN boundary. A shift to lower Olig2 and higher Pax6 for O2e33–/– can be observed (green arrow). (I,J) A shift to higher levels of Pax6 and reduced levels of Olig2 is observed in cells from O2e33−/− mutants in vivo compared with controls. Axes show fluorescence intensity (arbitary units). Contour lines correspond to densities of the distribution of points, 0.6 (orange), 1.6 (red) and 2.6 (blue).
Fig. 5.
Fig. 5.
Computational screen reveals the design principles of precision. (A) Three-node networks, comprising all possible interactions and a morphogen input into two nodes. (B) Two mechanisms for producing a precise boundary. Close to the boundary (position 1.0 a.u.; signal 1.0 a.u.) the steady state (red point) is near the transition point (purple point) in gene expression space. Further away (increasing position; decreasing signal), curvature of the MAP (red line) with respect to the shortest pathway (top row), or the rate at which the steady state separates from the transition point (bottom row), can contribute to increasing boundary precision. (C) For each network recovered from the screen (points), the boundary width was compared with the deviation of the MAP from the shortest path to the transition (curvature). Median value (red line) illustrates that sharper boundaries (smaller width) tend to have higher MAP curvature. The green star represents the WT neural tube network. (D) Curvature compared with the effective contribution of the third node in the network (boundary width indicated by the colour of the point). (E) Curvature compared with signal sensitivity. The colour of the points by boundary width indicates that both high curvature and high signal sensitivity contribute to the sharpest boundaries. (F) Histogram of boundary width in three-dimensional (red) and two-dimensional (blue) networks. The green arrow represents the WT network. (G) The most common topologies, arranged in order of the fraction of networks with precise boundaries; each column represents an individual topology. Dark blue indicates networks with a wider boundary. Topologies are shown in Fig. S16. (H) Four topologies that favour the sharpest boundaries. These networks comprise inhibition from node 2 to node 3, and lack repression from node 3 to node 2. The WT neural tube network has topology 3 (green box). a.u., arbitrary units.

Similar articles

Cited by

References

    1. Addison, M., Xu, Q., Cayuso, J. and Wilkinson, D. G. (2018). Cell identity switching regulated by retinoic acid signaling maintains homogeneous segments in the hindbrain. Dev. Cell 45, 606-620.e3. 10.1016/j.devcel.2018.04.003 - DOI - PMC - PubMed
    1. Akam, M. (1987). The molecular basis for metameric pattern in the Drosophila embryo. Development 101, 1-22. - PubMed
    1. Balaskas, N., Ribeiro, A., Panovska, J., Dessaud, E., Sasai, N., Page, K. M., Briscoe, J. and Ribes, V. (2012). Gene regulatory logic for reading the sonic hedgehog signaling gradient in the vertebrate neural tube. Cell 148, 273-284. 10.1016/j.cell.2011.10.047 - DOI - PMC - PubMed
    1. Balaskas, N., Abbott, L. F., Jessell, T. M. and Ng, D. (2019). Positional strategies for connection specificity and synaptic organization in spinal sensory-motor circuits. Neuron 102, 1143-1156.e4. 10.1016/j.neuron.2019.04.008 - DOI - PMC - PubMed
    1. Balázsi, G., Van Oudenaarden, A. and Collins, J. J. (2011). Cellular decision making and biological noise: from microbes to mammals. Cell144, 910-925. 10.1016/j.cell.2011.01.030 - DOI - PMC - PubMed

Publication types

LinkOut - more resources