. 2021 Feb 5;12(2):158.
doi: 10.1038/s41419-021-03445-w.

Sensing soluble uric acid by Naip1-Nlrp3 platform

Affiliations

Sensing soluble uric acid by Naip1-Nlrp3 platform

Tarcio Teodoro Braga et al. Cell Death Dis. .

Abstract

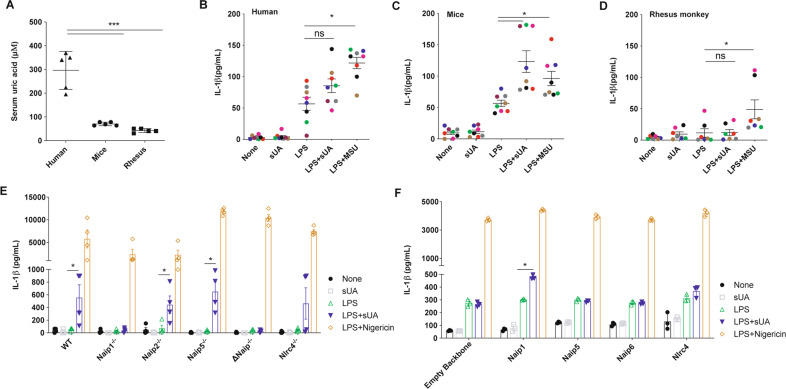
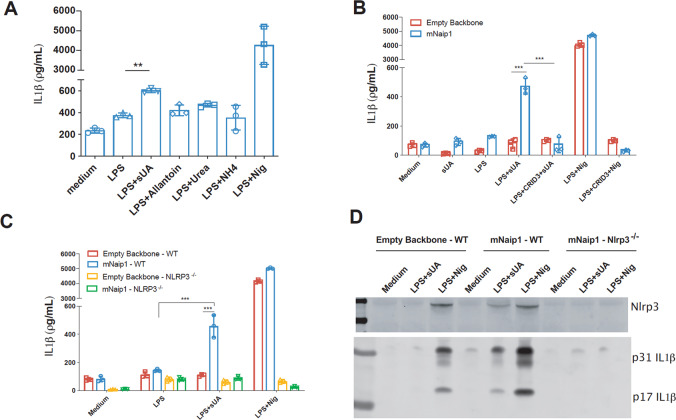
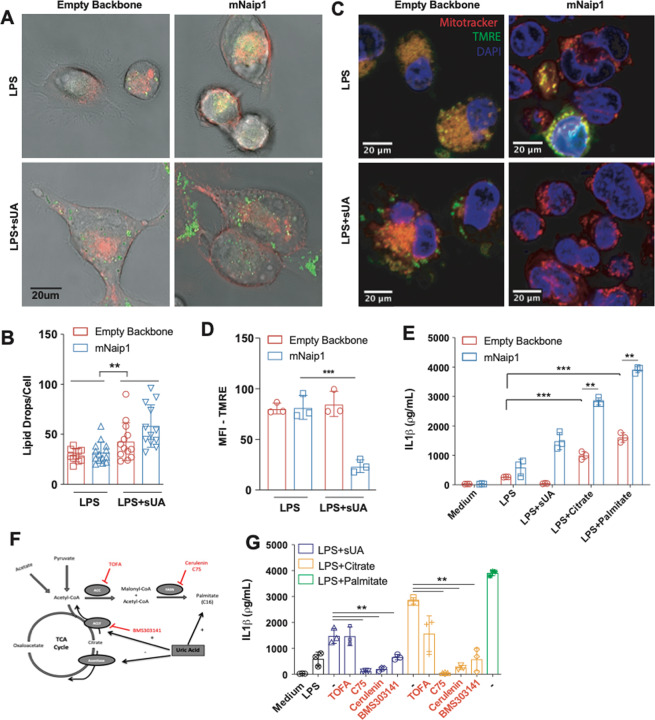
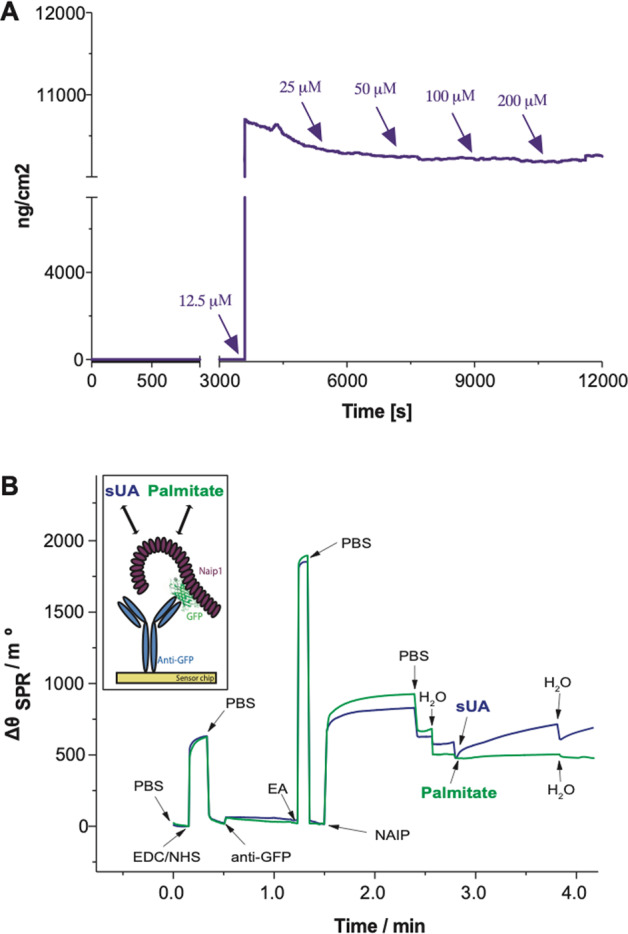
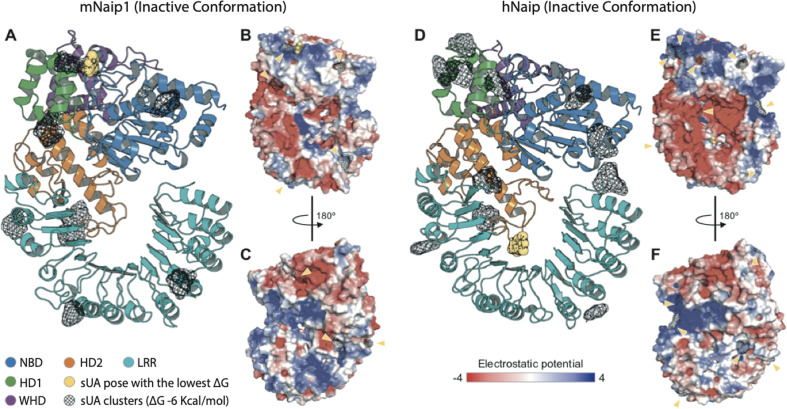
Uric acid (UA), a product of purine nucleotide degradation able to initiate an immune response, represents a breakpoint in the evolutionary history of humans, when uricase, the enzyme required for UA cleavage, was lost. Despite being inert in human cells, UA in its soluble form (sUA) can increase the level of interleukin-1β (IL-1β) in murine macrophages. We, therefore, hypothesized that the recognition of sUA is achieved by the Naip1-Nlrp3 inflammasome platform. Through structural modelling predictions and transcriptome and functional analyses, we found that murine Naip1 expression in human macrophages induces IL-1β expression, fatty acid production and an inflammation-related response upon sUA stimulation, a process reversed by the pharmacological and genetic inhibition of Nlrp3. Moreover, molecular interaction experiments showed that Naip1 directly recognizes sUA. Accordingly, Naip may be the sUA receptor lost through the human evolutionary process, and a better understanding of its recognition may lead to novel anti-hyperuricaemia therapies.


Conflict of interest statement

The authors declare that they have no conflict of interest.

Figures

Fig. 1
Fig. 1. Human cells do not produce IL-1β upon sUA + LPS stimulus, unless they express mNaip1.
A Uric acid levels measured in the serum of humans, mice and rhesus monkeys. IL-1β Elisa of B monocyte-derived macrophages collected from healthy people, C murine bone marrow-derived macrophages and D monocyte-derived macrophages collected from rhesus monkeys, all stimulated under different conditions. In BD, LPS was added for 1 h at 100 ng/mL and the media were posteriorly changed. MSU (100 μg/mL) and sUA (200 μΜ) were added for 6 h. Each coloured dot represents a different individual. E IL-1β Elisa of BMDM derived from Naip1−/−, Naip2−/−, Naip5−/−, ΔNaip−/− and Nlrc4−/− mice under different stimulus. F IL-1β Elisa of human THP1 cells virally transduced with plasmids carrying Naip1, Naip5, Naip6, Nlrc4 and empty vector using lentivirus constructs and posteriorly stimulated under different conditions. In E, F, LPS was added for 1 h at 100 ng/mL and the media were posteriorly changed. sUA (200 μΜ) was added for 6 h and nigericin (10 μΜ) was added for 90 min. In A, n = 5 for each analysed species. Triangle refers to human’s sample, Circle refers to murine’s sample and Square refers to rhesus’ sample. In B, C, we collected cells from eight different individuals; in D, we collected cells from seven different individuals. In E, F, data are plotted as the median of a triplicate of three to four independent experiments. *p < 0.05 and ***p < 0.001; n.s. not significant.
Fig. 2
Fig. 2. Naip1 and NLRP3 are required for LPS-primed THP1 cells to produce IL-1β upon sUA.
A IL-1β Elisa of mNaip1-transduced LPS-primed THP1 cells, stimulated with the products of uric acid degradation allantoin, urea and ammonium, the control non-treated cells (Medium) and LPS-primed treated with nigericin. B IL-1β Elisa of THP1 cells virally transduced with an empty backbone or with mNaip1 after 1 h pretreatment with LPS (1 µg/mL), 6 h treatment with sUA (200 μM), 30 min treatment with nigericin or control non-treated cells (Medium). Some groups were pretreated with the Nlrp3 inhibitor CRID3 at 1 μΜ 30 min before LPS priming. C IL-1β Elisa of WT THP1 and Nlrp3−/− THP1 cells virally transduced with an empty backbone or with mNaip1 after 1 h pretreatment with LPS, 6 h treatment with sUA, 30 min treatment with nigericin or control non-treated cells (Medium). D IL-1β and Nlrp3 western blotting images of WT THP1 and Nlrp3−/− THP1 cells virally transduced with an empty backbone or with mNaip1 in control non-treated condition (Medium), or LPS-primed and treated with sUA for 6 h, or with nigericin for 30 min. In A blue bars represent the levels of produced IL1beta (pg/mL), analysed by Elisa. In D, data are representative of three independent experiments. All experiments were performed three different times and data are plotted as a median of a triplicate. **p < 0.01, and ***p < 0.001.
Fig. 3
Fig. 3. Naip1 activation upon sUA stimulus may be potentiated after the elevation of the cellular content of neutral lipid.
A Representative images of THP1 cells transduced with an empty backbone or mNaip1 at LPS-primed condition or LPS-primed and stimulated with sUA for 6 h. The membrane is in red and lipid droplets are stained for LD540, in green. B Quantification of lipid droplets per cell. C Representative images of empty backbone- and mNaip1-transduced cells primed with LPS or LPS-primed and sUA-stimulated stained with MitoTracker (red), tetramethylrhodamine ethyl ester (TMRE) (green) and DAPI (blue). The bars in each image represent 20 μm D TMRE quantification, indicating polarized mitochondria of the experiments in panel (C). E IL-1β Elisa of empty backbone- (red bars) and mNaip1- (blue bars) transduced cells, both at non-stimulated (Medium) condition or LPS-primed and stimulated for 6 h with sUA, citrate or palmitate. F Schematic representation of the TCA cycle and the fatty acid synthesis pathway given emphasis to the inhibitors and stimulus used in panel (J). G IL-1β Elisa of mNaip1-transduced and LPS-primed cells, stimulated for 6 h with sUA (200 μΜ), citrate (5 mΜ) or palmitate (100 μΜ), in the presence or absence of ATP citrate lyase inhibitor (BMS303141 at 25 μΜ), acetyl-CoA carboxylase inhibitor (TOFA at 10 μg/mL), or fatty acid synthase inhibitors (C75 at 50 μΜ or cerulenin at 5 μg/mL). In A, B, data are representative of three independent experiments and n = 12. In D, data are plotted as a median of ten different micrography fields of three independent experiments. In E, F, the experiments were performed three different times and n = 3. **p < 0.01 and ***p < 0.001.
Fig. 4
Fig. 4. QCM monitoring and SPR sensorgram evidencing all steps involved in the detection of the interaction between sUA and Naip1 protein.
A QCM responses over time within sUA injection after Naip1 immobilization upon anti-GFP adsorption on the gold quartz crystals surface at 37 °C. The arrows indicate sample injection. B Schematic representation of the constructed SPR sensor chip (in the box). Sequential addition of compounds into the system: addition of the buffer solution (PBS, 10 mmol/L at pH 7.4); mixture consisting of EDC (150 mmol/L) and NHS (150 mmol/L); PBS; immobilization of anti-GFP (10 µg/mL); PBS; addition of ethanolamine (EA); addition of cell lysates containing Naip1 protein (2 µg/mol/L). It is possible to observe a very intensive response for the interaction of the Naip1 protein with anti-GFP; PBS; addition of pure H2O; addition of sUA (2 µmol/L, purple line) and palmitate (2 µmol/L, green line). It is possible to observe the significant variation of the SPR angle (ΔθSPR) due to the interaction between sUA and Naip protein. In A, B, data are representative of three independent experiments.
Fig. 5
Fig. 5. Structural analysis of the inactive conformations of hNaip and mNaip1, modelled by homology using an inactive form of Nlrc4 structure (PDB 4KXF) as a template.
A Cartoon representation of a mNaip1 (Uniprot: Q9QWK5) homology model. The distinct colours represent functional regions commonly found in proteins of the NLR family (NBD-HD1-WHD-HD2-LRR), coloured as shown in Zhang et al.. Clusters of uric acid (URC) molecules are shown as black meshes, which represent points on the Naip surface where two or more URC were found to bind, in multiple independent rigid docking simulations. The pose with the lowest ΔG is shown as a yellow sphere representation. B Surface electrostatic potential calculated for mNaip1. Its solvent-accessible surface is shown with a potential gradient ranging from <−4 kBT (red) to >4 kBT (blue). Yellow arrows highlight URC clusters shown in panel (A). C A 180° rotation of mNaip1 around its Y-axis. D Cartoon representation of a hNaip (Uniprot: Q13075) homology model. E Its surface electrostatic potential. F A 180° rotation of hNaip around its Y-axis. See legend for more details.

References

    1. Land WG. How evolution tells us to induce allotolerance. Exp. Clin. Transplant. 2015;13:46–54. - PubMed
    1. Bottomly K, Janeway CA., Jr. Antigen presentation by B cells. Nature. 1989;337:24. doi: 10.1038/337024a0. - DOI - PubMed
    1. Janeway CA., Jr. Approaching the asymptote? Evolution and revolution in immunology. Cold Spring Harb. Symp. Quant. Biol. 1989;54:1–13. doi: 10.1101/SQB.1989.054.01.003. - DOI - PubMed
    1. Janeway CA., Jr. The priming of helper T cells. Semin. Immunol. 1989;1:13–20. - PubMed
    1. Burnet FM. The immunological significance of the thymus: an extension of the clonal selection theory of immunity. Australas. Ann. Med. 1962;11:79–91. doi: 10.1111/imj.1962.11.2.79. - DOI - PubMed

Publication types

MeSH terms